| Param | Original file | Final file |
|---|---|---|
| Filename | modeM0/AS1A04_089T01_9000002146_14562cztM0_level2.evt | modeM0/AS1A04_089T01_9000002146_14562cztM0_level2_quad_clean.evt |
| Size (bytes) | 491,137,920 | 107,498,880 |
| Size | 468.4 MB | 102.5 MB |
| Events in quadrant A | 3,406,382 | 704,391 |
| Events in quadrant B | 3,723,253 | 717,679 |
| Events in quadrant C | 3,697,789 | 696,408 |
| Events in quadrant D | 3,603,411 | 681,937 |
| Mode SS | |||
|---|---|---|---|
| Quadrant | BADHDUFLAG | Total packets | Discarded packets |
| A | 0 | 134 | 0 |
| B | 0 | 134 | 0 |
| C | 0 | 134 | 0 |
| D | 0 | 134 | 0 |
| Mode M9 | |||
|---|---|---|---|
| Quadrant | BADHDUFLAG | Total packets | Discarded packets |
| A | 0 | 27 | 0 |
| B | 0 | 27 | 0 |
| C | 0 | 27 | 0 |
| D | 0 | 27 | 0 |
| Mode M0 | |||
|---|---|---|---|
| Quadrant | BADHDUFLAG | Total packets | Discarded packets |
| A | 0 | 14257 | 3 |
| B | 0 | 15222 | 2 |
| C | 0 | 14883 | 2 |
| D | 0 | 14958 | 2 |
| Quadrant | Total seconds | Saturated seconds | Saturation percentage |
|---|---|---|---|
| A | 6531 | 87 | 1.332108% |
| B | 6531 | 140 | 2.143623% |
| C | 6531 | 58 | 0.888072% |
| D | 6531 | 160 | 2.449855% |
Noise dominated data is calculated using 1-second bins in cleaned event files. If a bin has >2000 counts, and if more than 50% of those come from <1% of pixels, then it is considered to be noise-dominated and hence unusable.
| Quadrant | # 1 sec bins | Bins with >0 counts | Bins with >2000 counts | High rate bins dominated by noise | Noise dominated (total time) | Noise dominated (detector-on time) | Marked lightcurve |
|---|---|---|---|---|---|---|---|
| A | 9162 | 6534 | 0 | 0 | 0.00% | 0.00% | 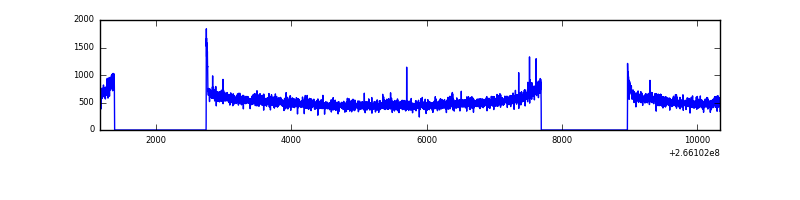 |
| B | 9162 | 6534 | 11 | 11 | 0.12% | 0.17% | 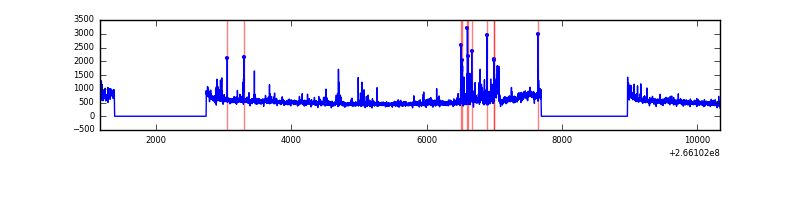 |
| C | 9162 | 6534 | 0 | 0 | 0.00% | 0.00% | 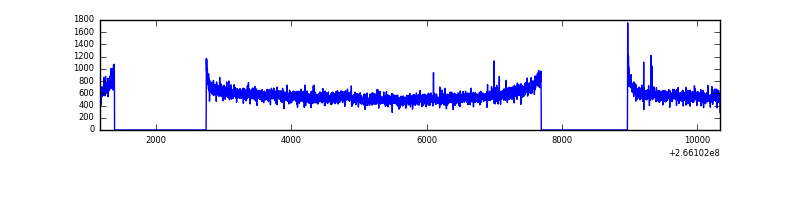 |
| D | 9162 | 6534 | 73 | 73 | 0.80% | 1.12% | 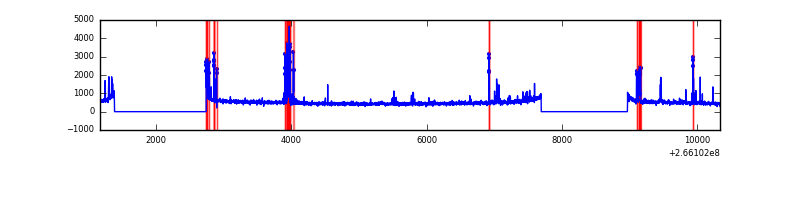 |
Top three noisy pixels from each quadrant. If the there are fewer than three noisy pixels in the level2.evt file, extra rows are filled as -1
| Pixel properties | Quadrant properties | ||||||
|---|---|---|---|---|---|---|---|
| Quadrant | DetID | PixID | Counts | Sigma | Mean | Median | Sigma |
| A | 8 | 15 | 64686 | 373.71 | 851 | 834 | 170.9 |
| A | 12 | 189 | 47749 | 274.58 | 851 | 834 | 170.9 |
| A | 0 | 23 | 16704 | 92.88 | 851 | 834 | 170.9 |
| B | 0 | 189 | 138898 | 856.37 | 856 | 836 | 161.2 |
| B | 4 | 173 | 49813 | 303.79 | 856 | 836 | 161.2 |
| B | 0 | 214 | 49284 | 300.51 | 856 | 836 | 161.2 |
| C | 3 | 233 | 410016 | 2103.39 | 841 | 847 | 194.5 |
| C | 14 | 220 | 7535 | 34.38 | 841 | 847 | 194.5 |
| C | 13 | 61 | 6036 | 26.67 | 841 | 847 | 194.5 |
| D | 10 | 199 | 163071 | 803.2 | 837 | 817 | 202.0 |
| D | 12 | 110 | 105286 | 517.15 | 837 | 817 | 202.0 |
| D | 13 | 122 | 78390 | 384.01 | 837 | 817 | 202.0 |
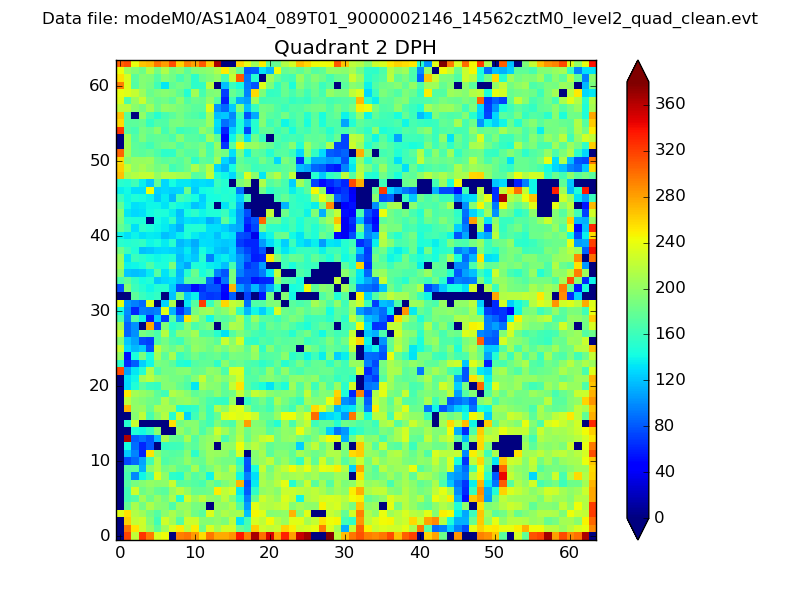
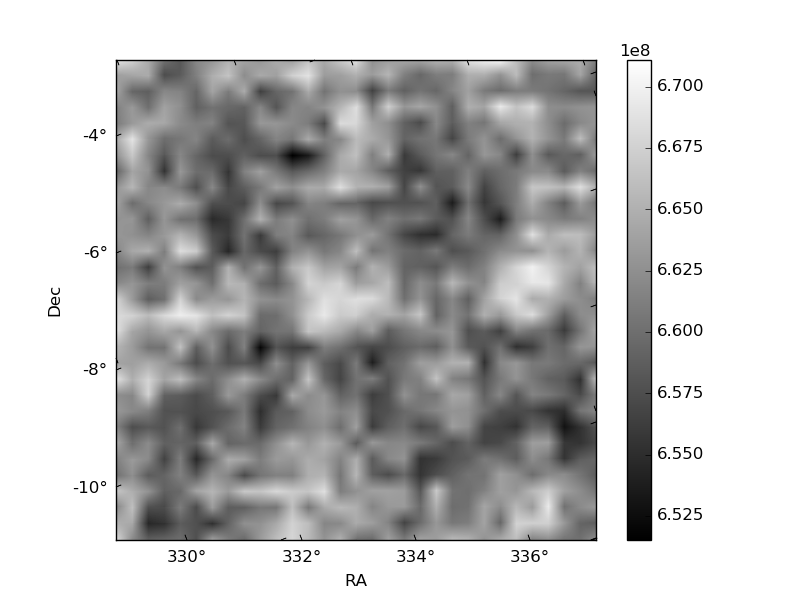
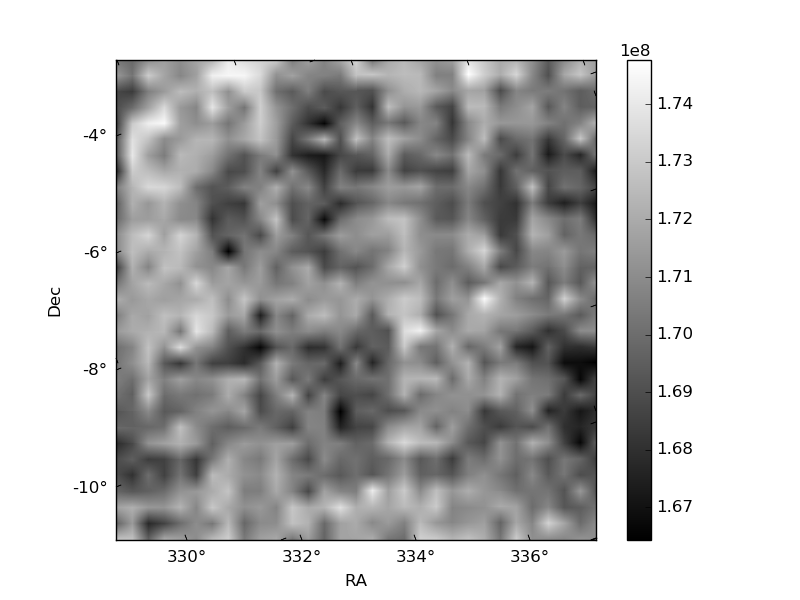
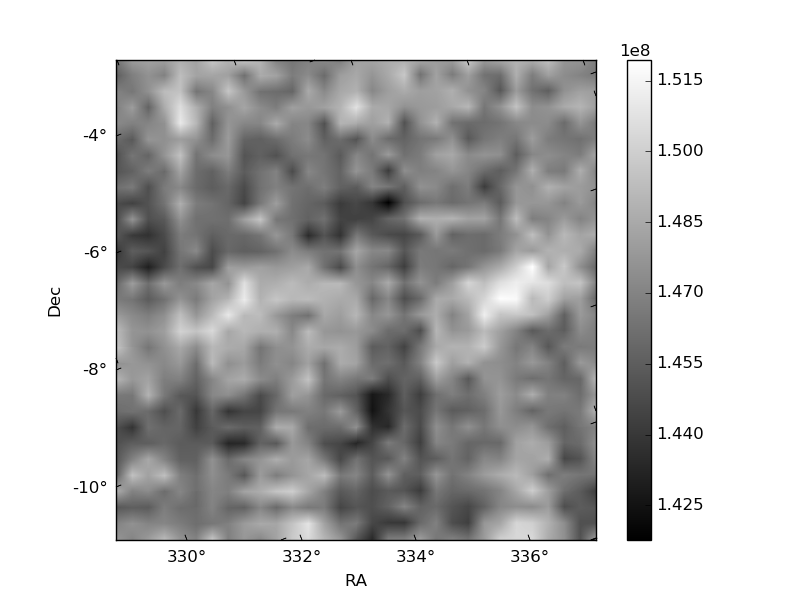
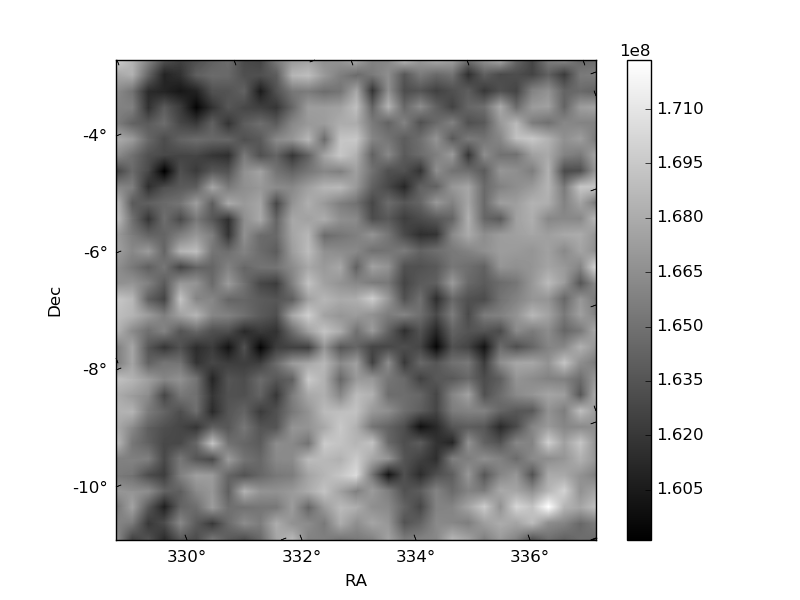
Histogram calculated using DETX and DETY for each event in the final _common_clean file
| Quadrant A | 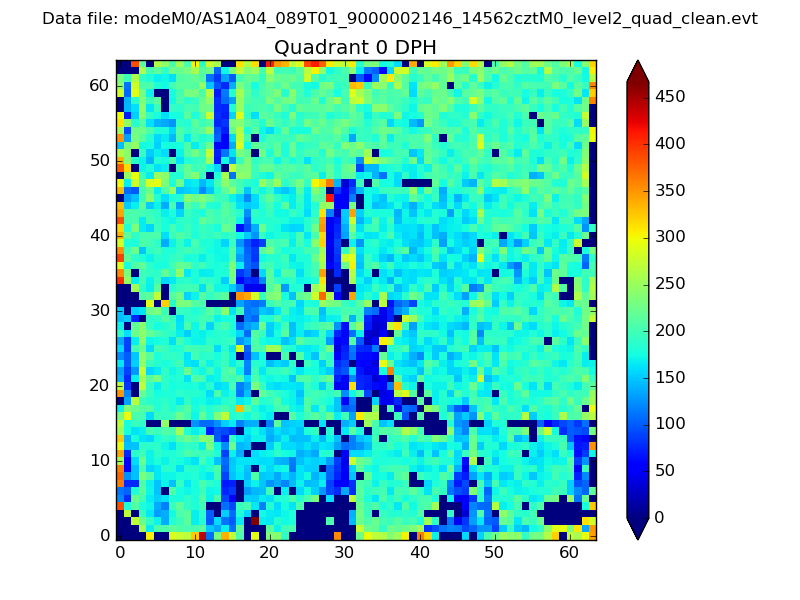 |
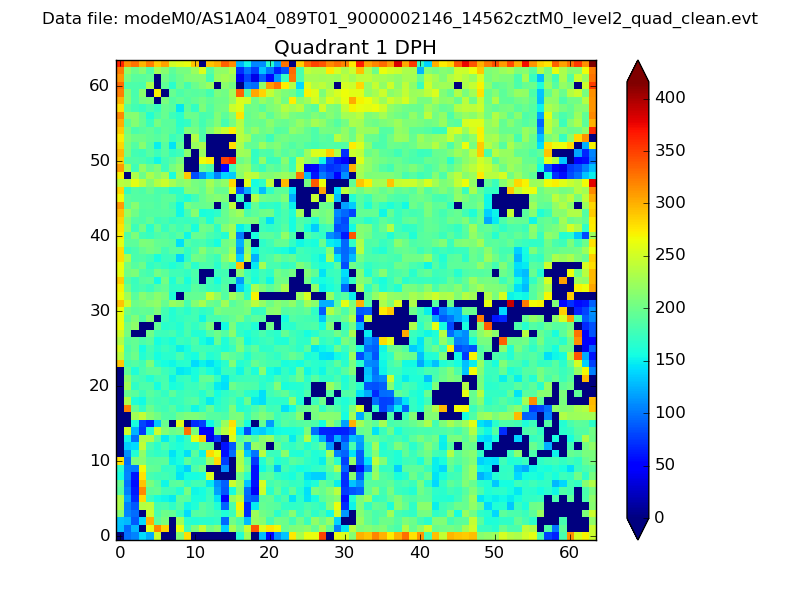 |
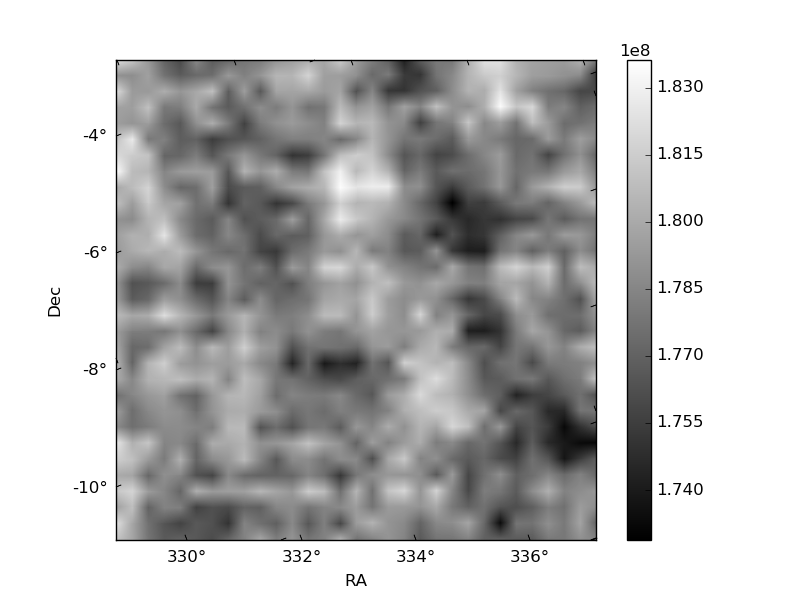
Quadrant B |
|---|---|---|---|
| Quadrant D | 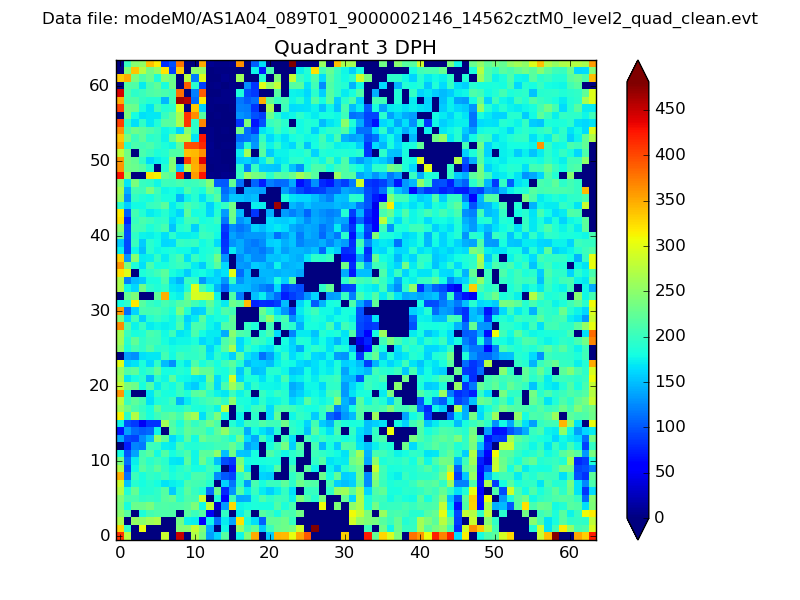 |
 |
Quadrant C |
| Plot type | Count rate plots | Images |
|---|---|---|
| Comparison with Poisson distribution Blue bars denote a histogram of data divided into 1 sec bins. Red curve is a Poisson curve with rate = median count rate of data. |
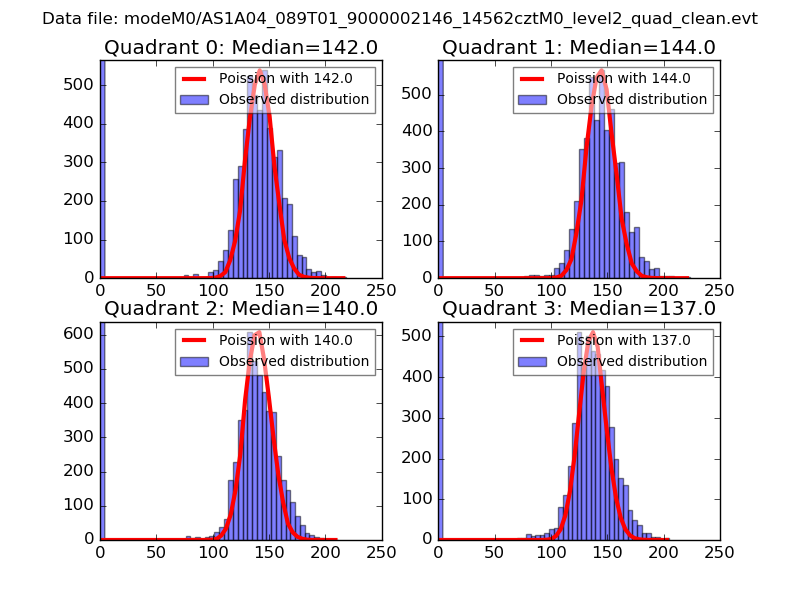 |
 |
| Quadrant-wise count rates Data is divided into 100 sec bins |
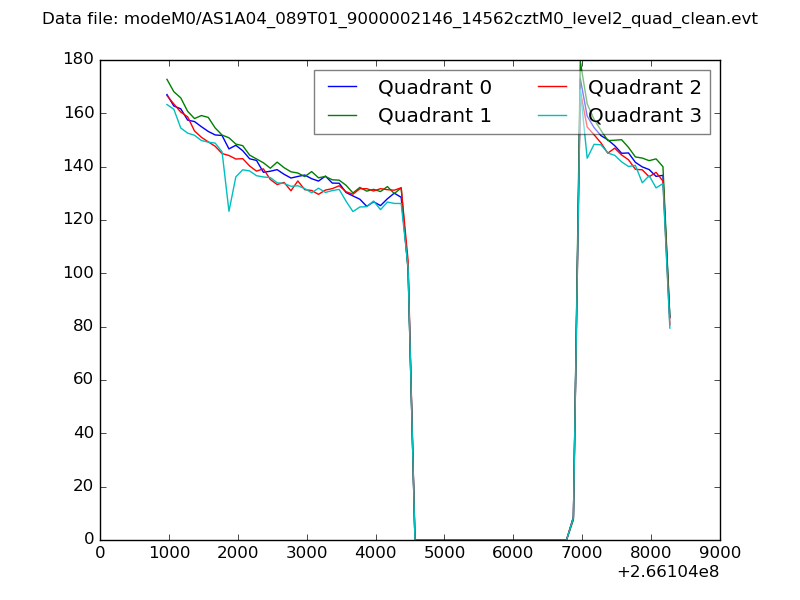 |
|
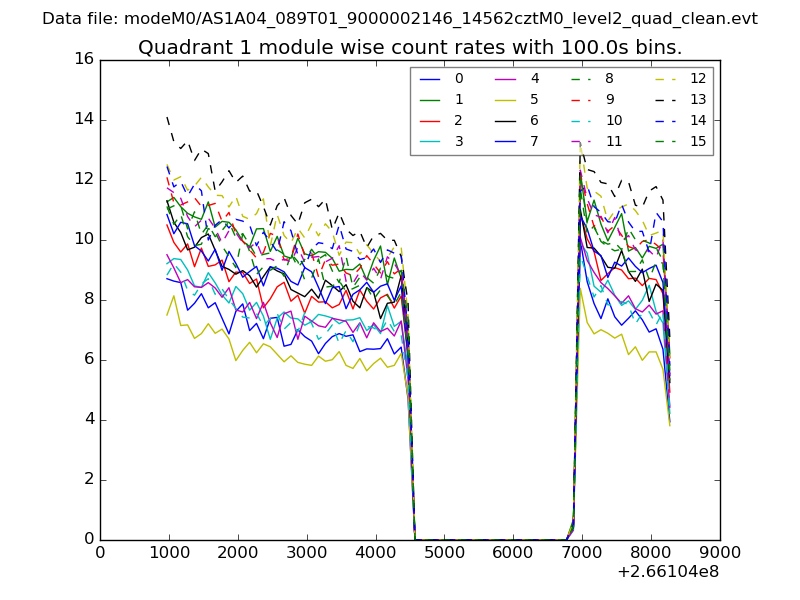
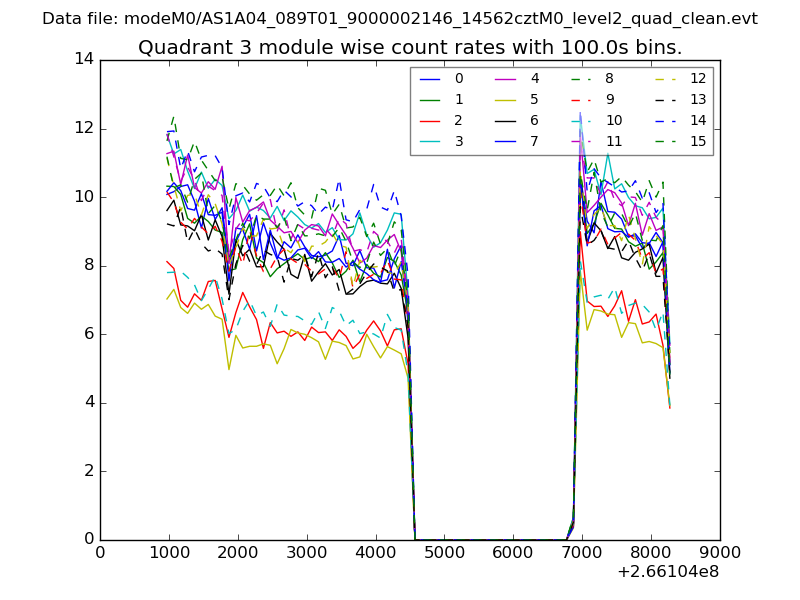
| Module-wise count rates for Quadrant A Data is divided into 100 sec bins |
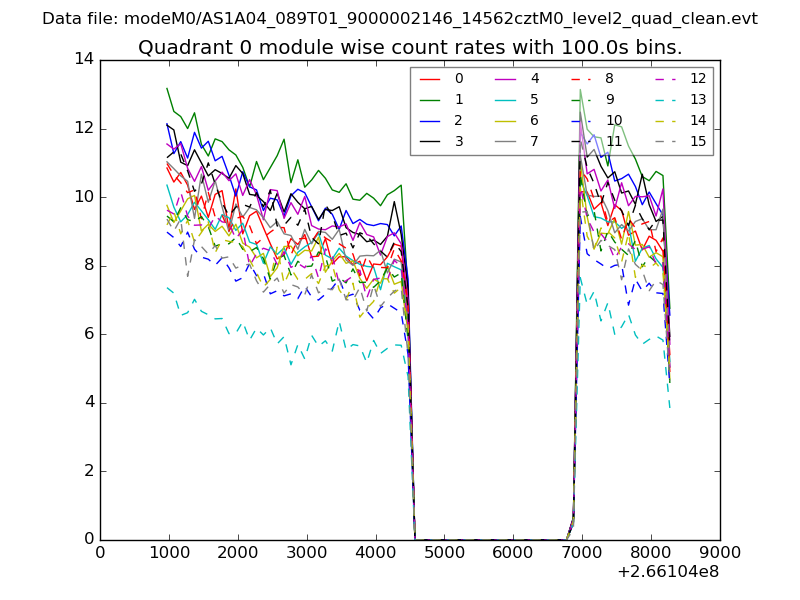 |
 |
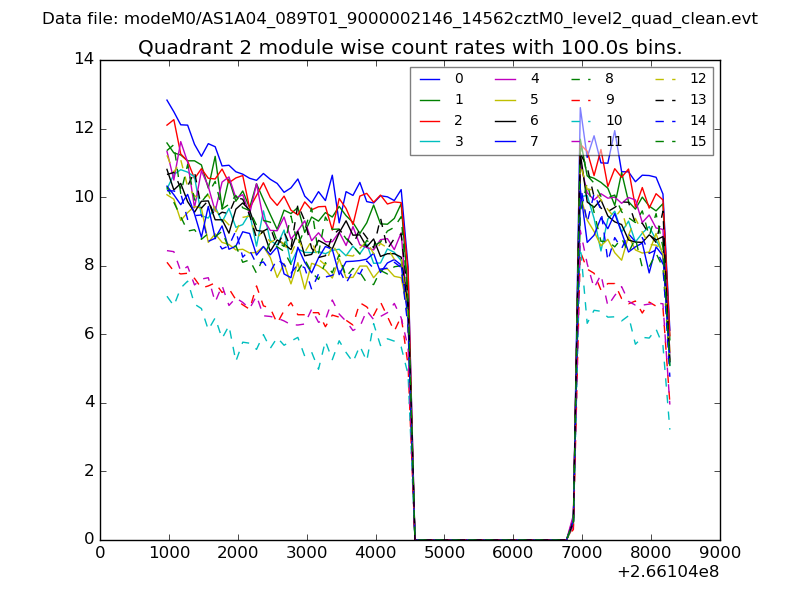
| Module-wise count rates for Quadrant B Data is divided into 100 sec bins |
 |
 |
| Module-wise count rates for Quadrant C Data is divided into 100 sec bins |
 |
 |
| Module-wise count rates for Quadrant D Data is divided into 100 sec bins |
 |
 |
| Parameter | Plot |
|---|---|
| CZT HV Monitor | 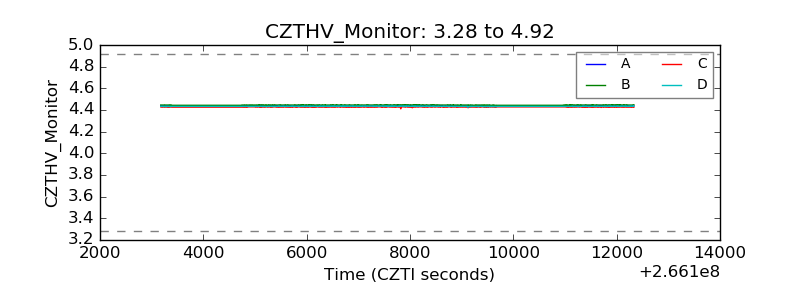 |
| D_VDD | 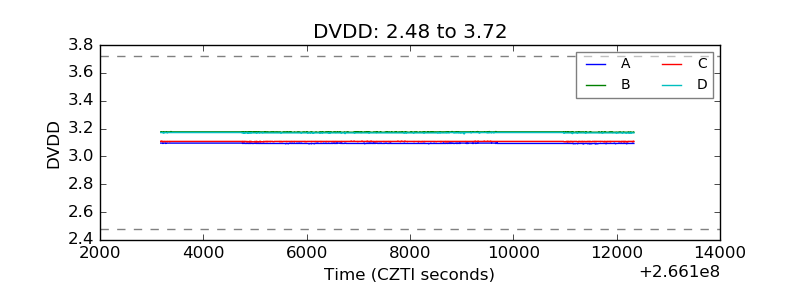 |
| Temperature 1 | 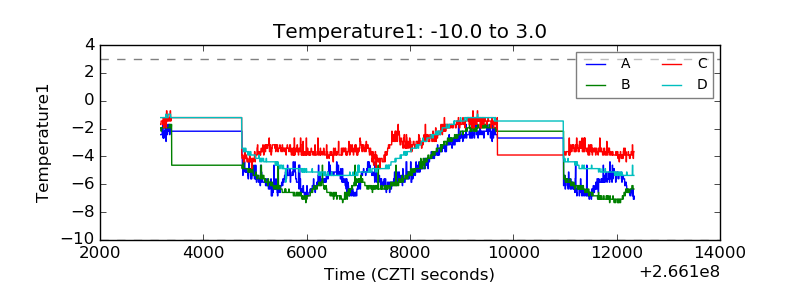 |
| Veto HV Monitor | 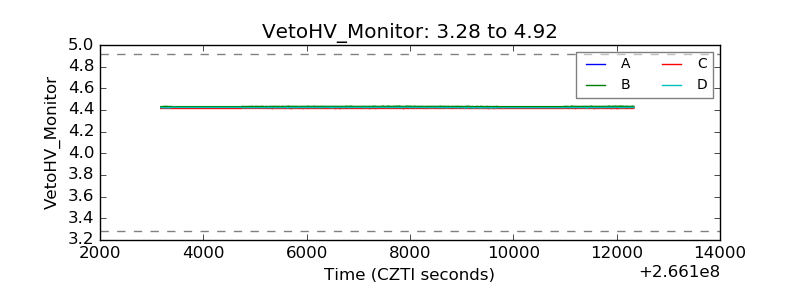 |
| Veto LLD | 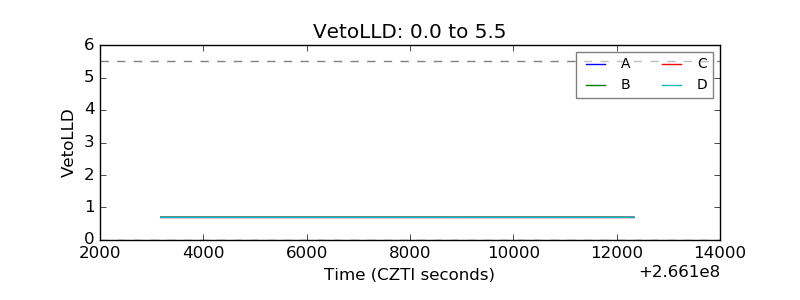 |
| Alpha Counter | 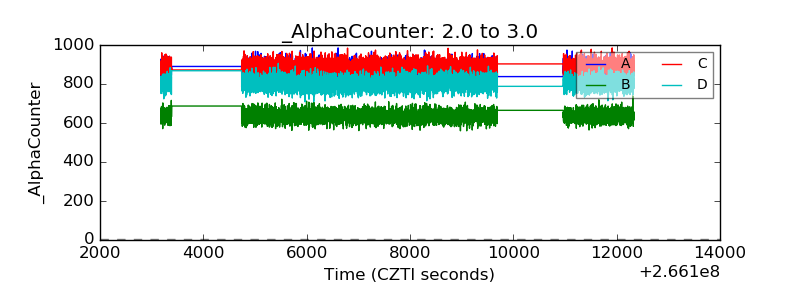 |
| _CPM_Rate | 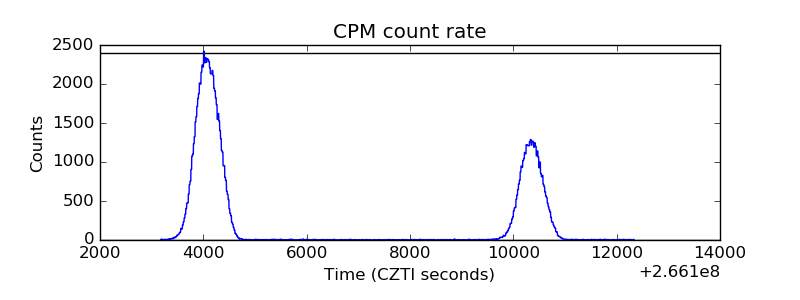 |
| CZT Counter | 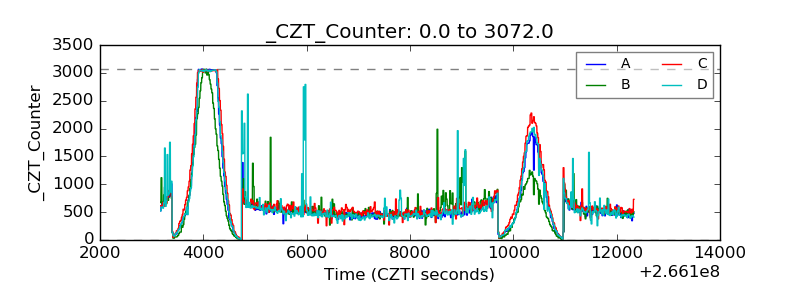 |
| +2.5 Volts monitor | 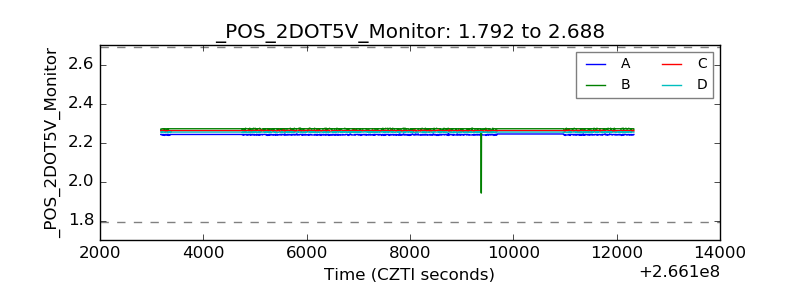 |
| +5 Volts monitor |  |
| _ROLL_ROT | 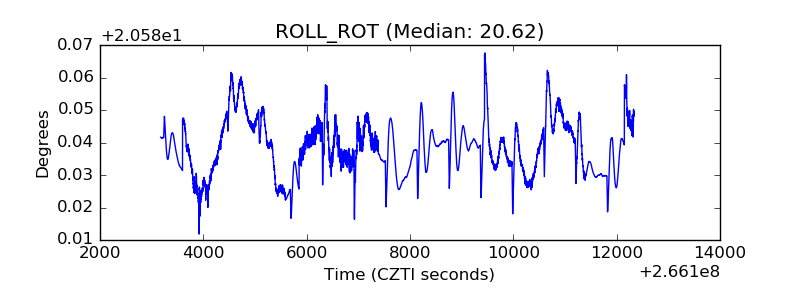 |
| _Roll_DEC | 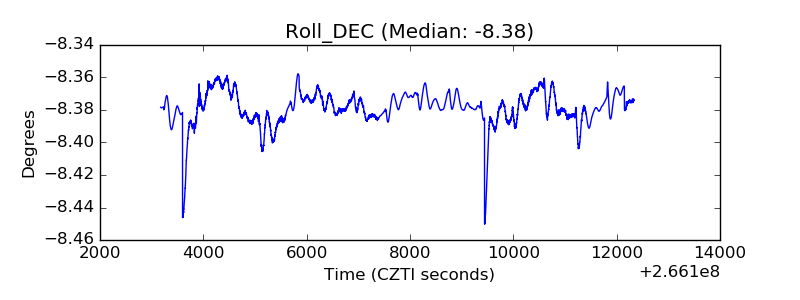 |
| _Roll_RA | 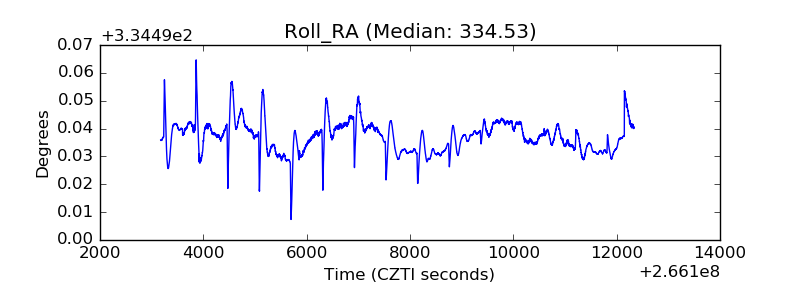 |
| Veto Counter | 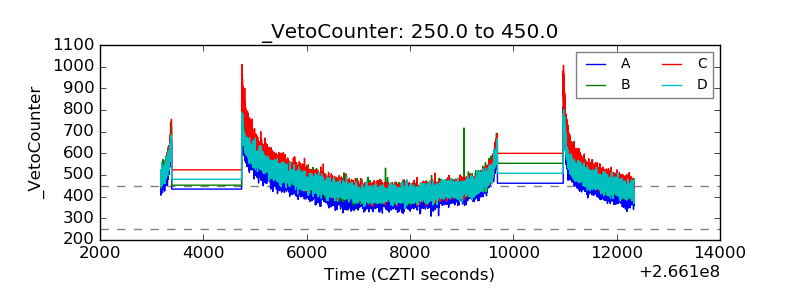 |