| Param | Original file | Final file |
|---|---|---|
| Filename | modeM0/AS1A04_089T01_9000002146_14566cztM0_level2.evt | modeM0/AS1A04_089T01_9000002146_14566cztM0_level2_quad_clean.evt |
| Size (bytes) | 522,927,360 | 103,443,840 |
| Size | 498.7 MB | 98.7 MB |
| Events in quadrant A | 3,559,975 | 657,995 |
| Events in quadrant B | 3,770,124 | 666,702 |
| Events in quadrant C | 4,111,991 | 647,443 |
| Events in quadrant D | 3,882,072 | 635,247 |
| Mode SS | |||
|---|---|---|---|
| Quadrant | BADHDUFLAG | Total packets | Discarded packets |
| A | 0 | 156 | 0 |
| B | 0 | 156 | 0 |
| C | 0 | 156 | 0 |
| D | 0 | 156 | 0 |
| Mode M9 | |||
|---|---|---|---|
| Quadrant | BADHDUFLAG | Total packets | Discarded packets |
| A | 0 | 1 | 0 |
| B | 0 | 1 | 0 |
| C | 0 | 1 | 0 |
| D | 0 | 1 | 0 |
| Mode M0 | |||
|---|---|---|---|
| Quadrant | BADHDUFLAG | Total packets | Discarded packets |
| A | 0 | 15515 | 4 |
| B | 0 | 16023 | 3 |
| C | 0 | 16565 | 3 |
| D | 0 | 16654 | 3 |
| Quadrant | Total seconds | Saturated seconds | Saturation percentage |
|---|---|---|---|
| A | 7540 | 122 | 1.618037% |
| B | 7540 | 135 | 1.790451% |
| C | 7540 | 99 | 1.312997% |
| D | 7540 | 149 | 1.976127% |
Noise dominated data is calculated using 1-second bins in cleaned event files. If a bin has >2000 counts, and if more than 50% of those come from <1% of pixels, then it is considered to be noise-dominated and hence unusable.
| Quadrant | # 1 sec bins | Bins with >0 counts | Bins with >2000 counts | High rate bins dominated by noise | Noise dominated (total time) | Noise dominated (detector-on time) | Marked lightcurve |
|---|---|---|---|---|---|---|---|
| A | 7766 | 7544 | 0 | 0 | 0.00% | 0.00% | 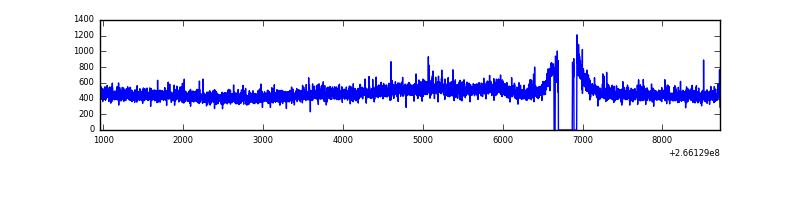 |
| B | 7766 | 7544 | 8 | 8 | 0.10% | 0.11% | 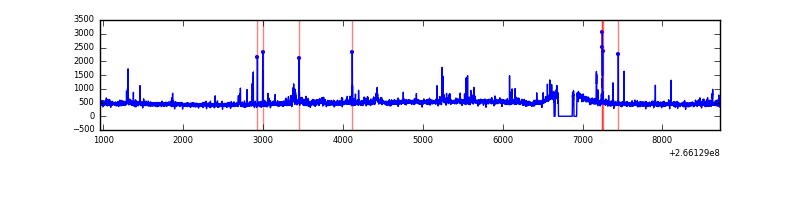 |
| C | 7766 | 7544 | 0 | 0 | 0.00% | 0.00% | 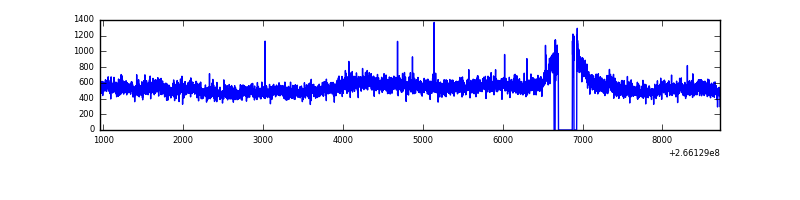 |
| D | 7766 | 7544 | 49 | 49 | 0.63% | 0.65% | 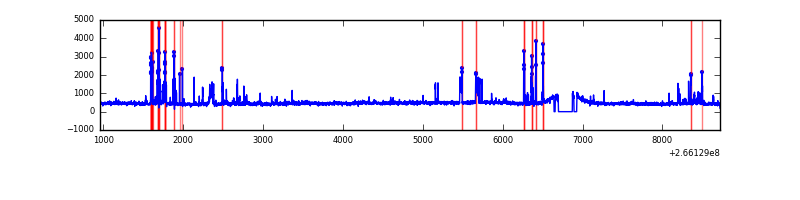 |
Top three noisy pixels from each quadrant. If the there are fewer than three noisy pixels in the level2.evt file, extra rows are filled as -1
| Pixel properties | Quadrant properties | ||||||
|---|---|---|---|---|---|---|---|
| Quadrant | DetID | PixID | Counts | Sigma | Mean | Median | Sigma |
| A | 8 | 15 | 66745 | 358.99 | 900 | 882 | 183.5 |
| A | 12 | 189 | 18775 | 97.53 | 900 | 882 | 183.5 |
| A | 0 | 226 | 8240 | 40.11 | 900 | 882 | 183.5 |
| B | 0 | 189 | 63651 | 364.73 | 895 | 873 | 172.1 |
| B | 4 | 173 | 61289 | 351.01 | 895 | 873 | 172.1 |
| B | 0 | 205 | 24679 | 138.31 | 895 | 873 | 172.1 |
| C | 3 | 233 | 693802 | 3407.46 | 872 | 874 | 203.4 |
| C | 8 | 128 | 8805 | 39.0 | 872 | 874 | 203.4 |
| C | 13 | 61 | 6288 | 26.62 | 872 | 874 | 203.4 |
| D | 10 | 199 | 287010 | 1216.89 | 871 | 856 | 235.2 |
| D | 12 | 110 | 170802 | 722.71 | 871 | 856 | 235.2 |
| D | 13 | 122 | 47931 | 200.19 | 871 | 856 | 235.2 |
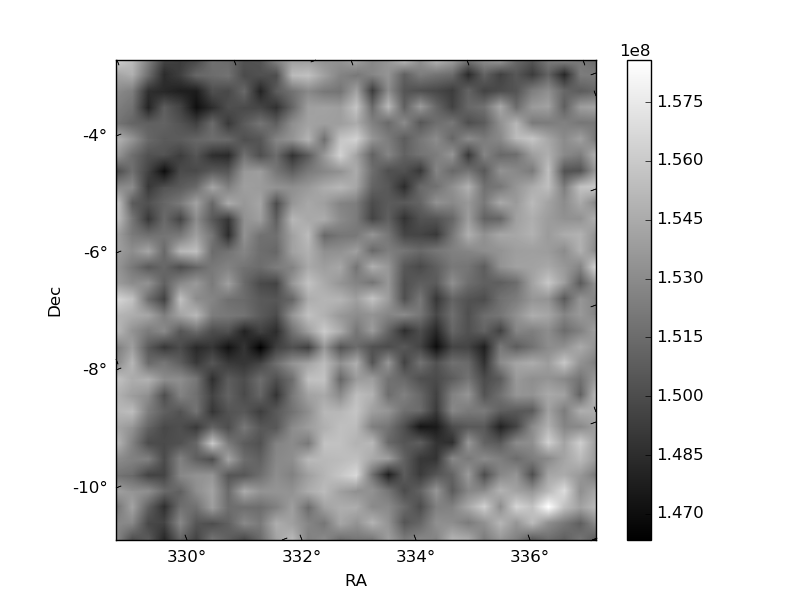
Histogram calculated using DETX and DETY for each event in the final _common_clean file
| Quadrant A | 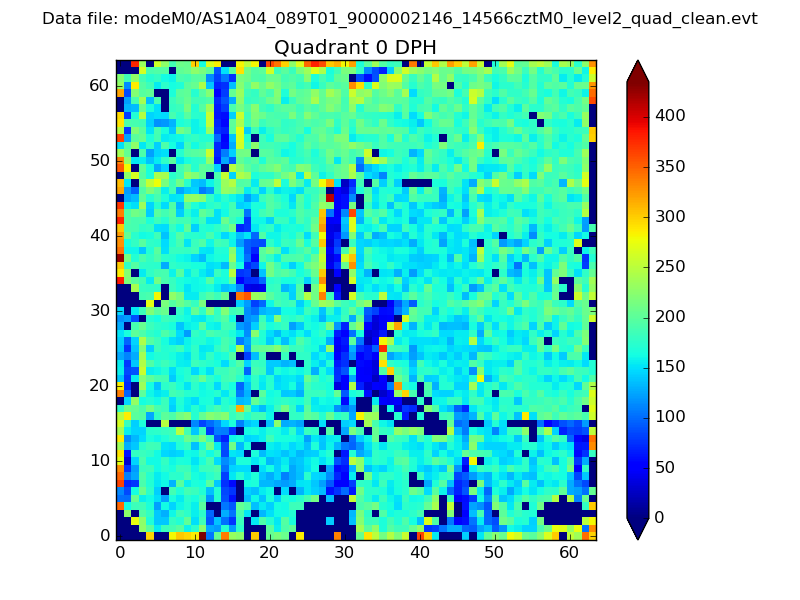 |
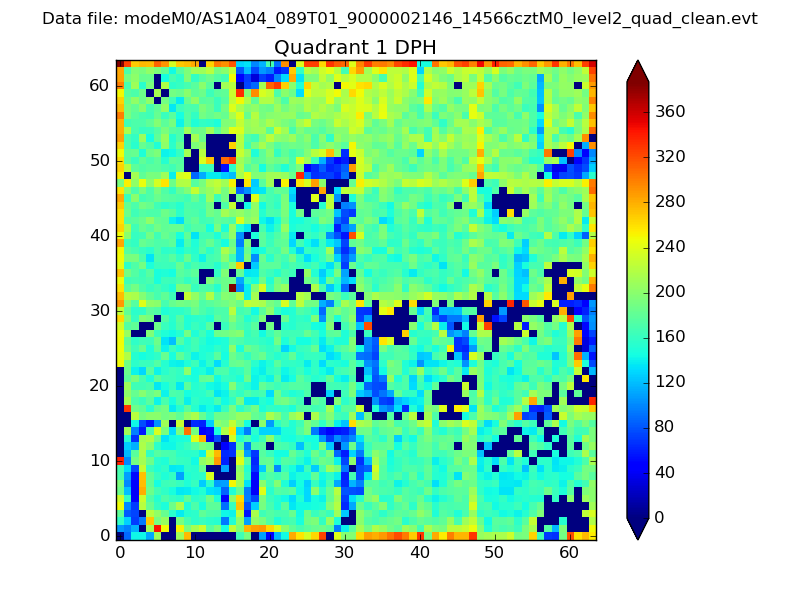 |
Quadrant B |
|---|---|---|---|
| Quadrant D |  |
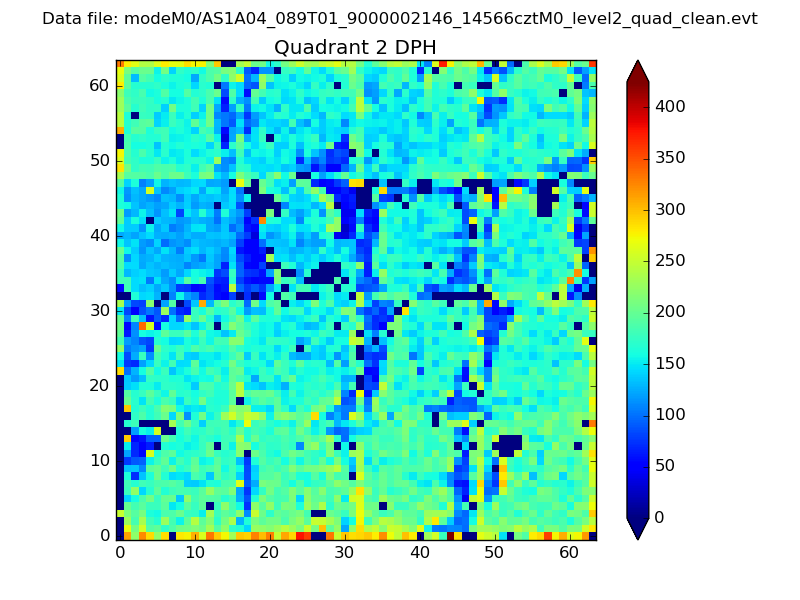 |
Quadrant C |
| Plot type | Count rate plots | Images |
|---|---|---|
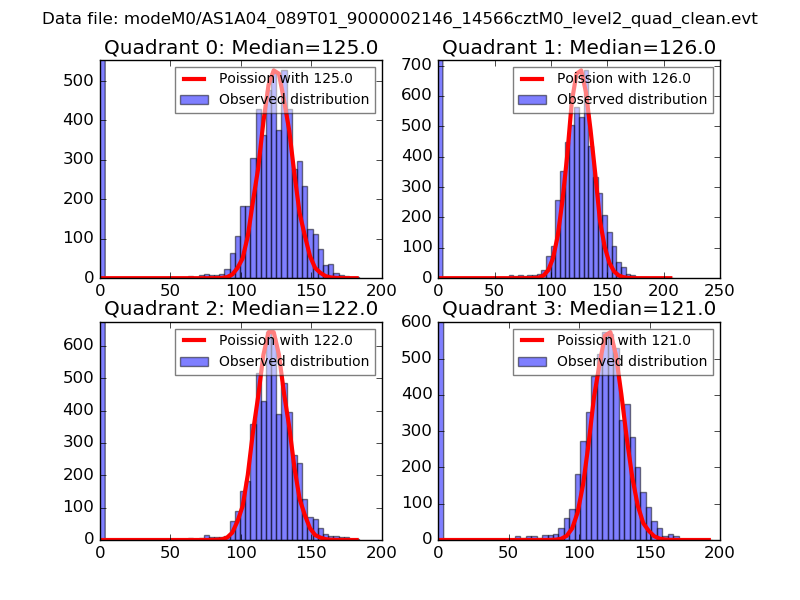
| Comparison with Poisson distribution Blue bars denote a histogram of data divided into 1 sec bins. Red curve is a Poisson curve with rate = median count rate of data. |
 |
 |
| Quadrant-wise count rates Data is divided into 100 sec bins |
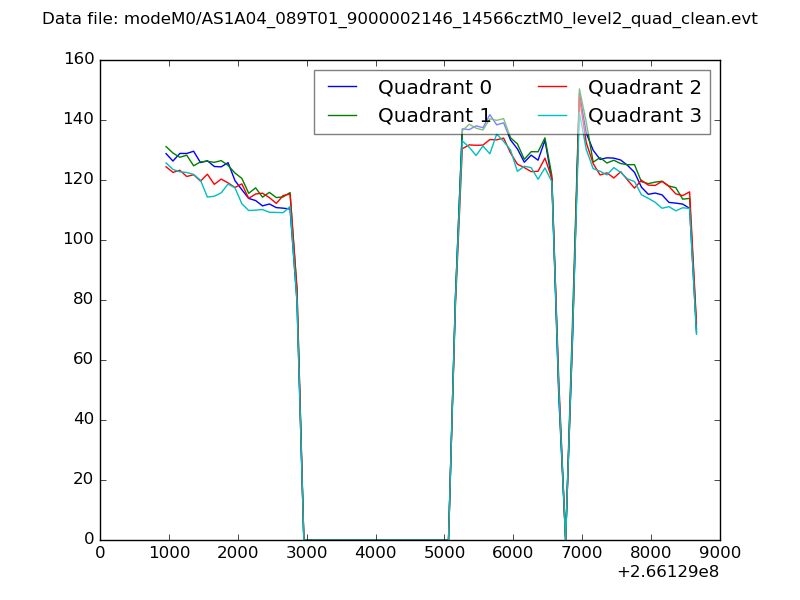 |
|
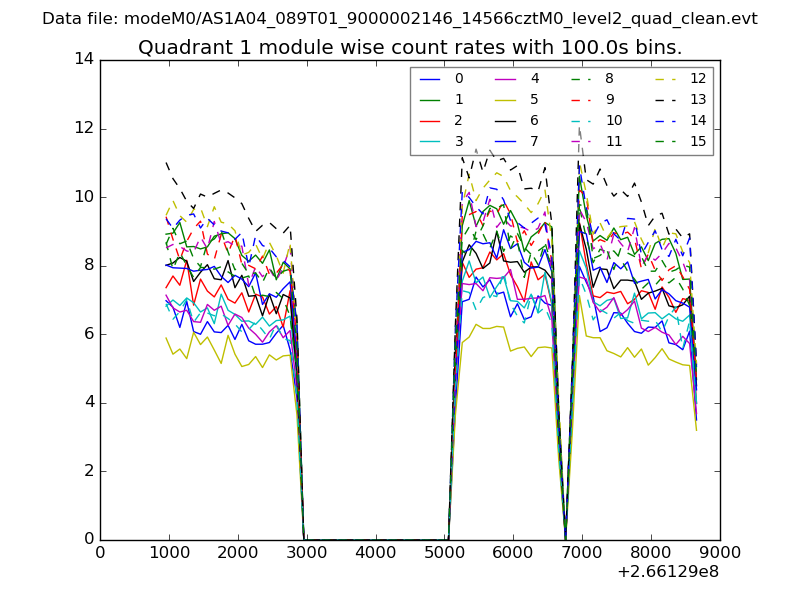
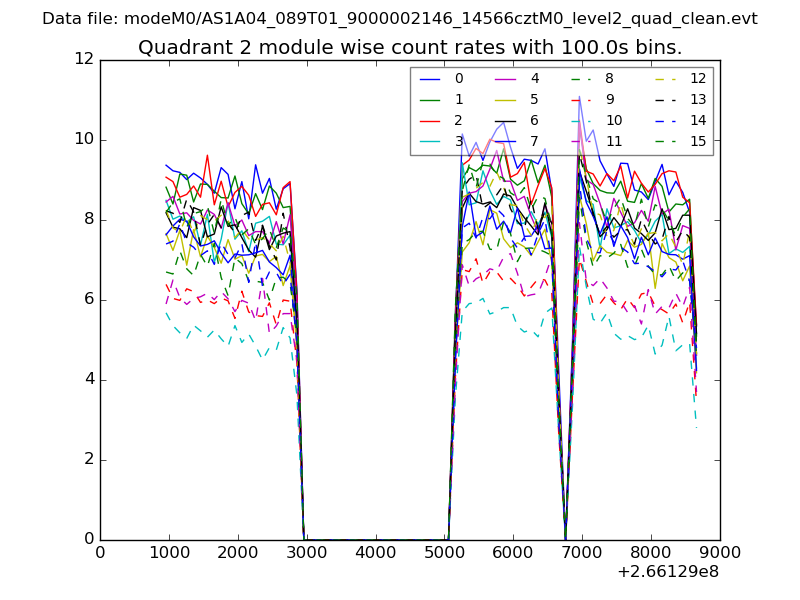
| Module-wise count rates for Quadrant A Data is divided into 100 sec bins |
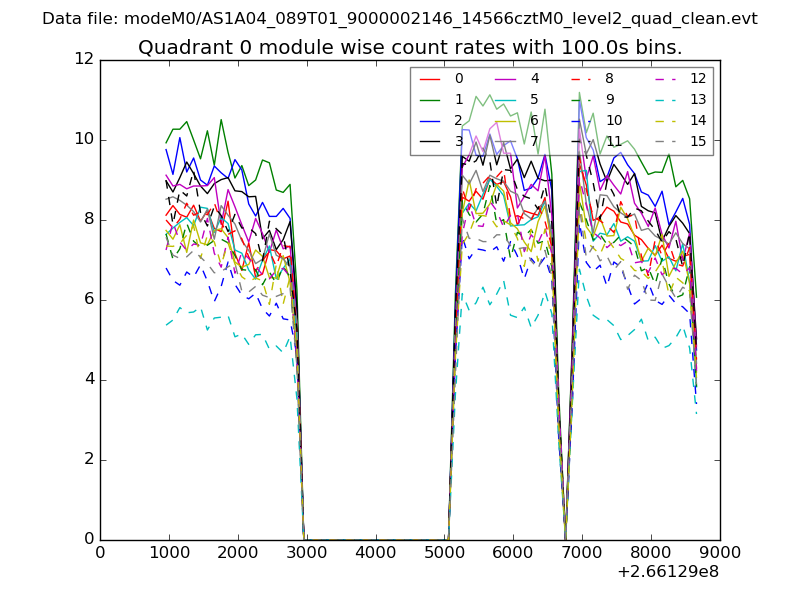 |
 |
| Module-wise count rates for Quadrant B Data is divided into 100 sec bins |
 |
 |
| Module-wise count rates for Quadrant C Data is divided into 100 sec bins |
 |
 |
| Module-wise count rates for Quadrant D Data is divided into 100 sec bins |
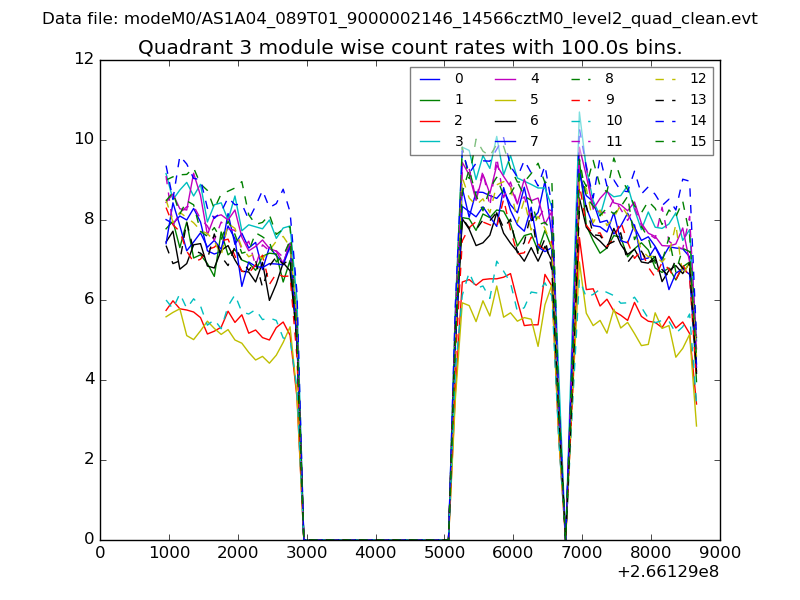 |
 |
| Parameter | Plot |
|---|---|
| CZT HV Monitor | 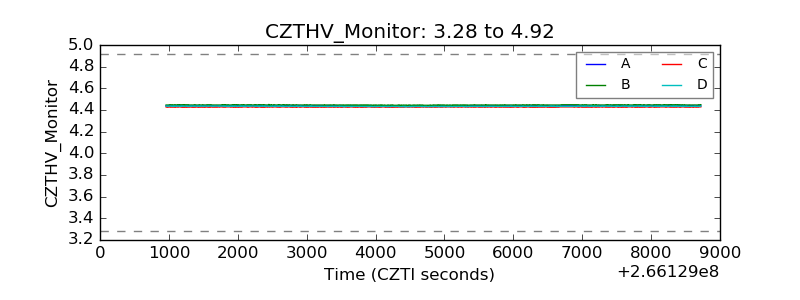 |
| D_VDD | 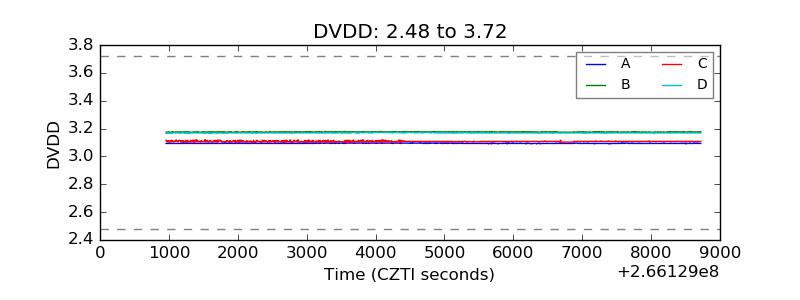 |
| Temperature 1 |  |
| Veto HV Monitor | 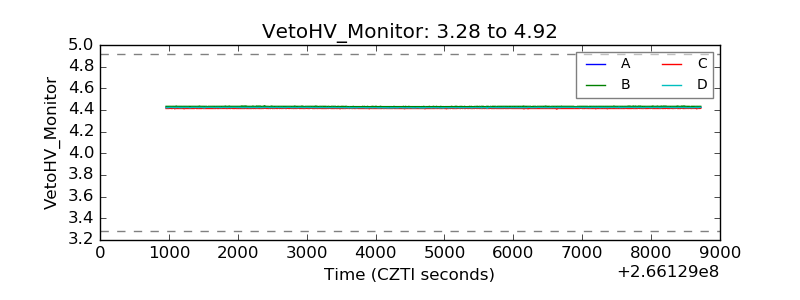 |
| Veto LLD | 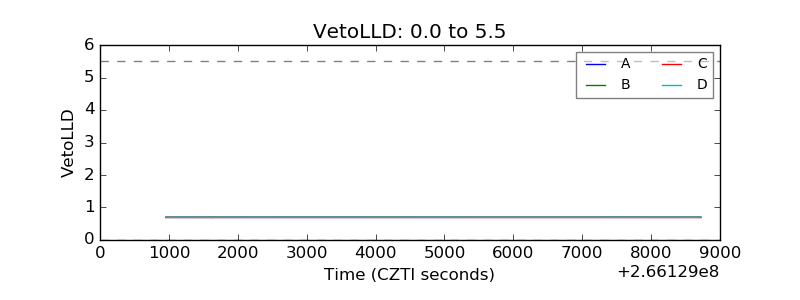 |
| Alpha Counter | 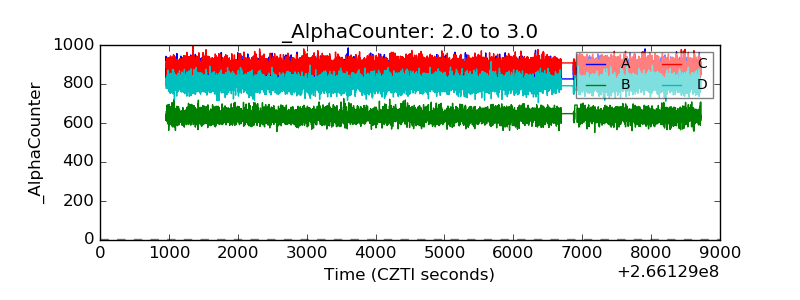 |
| _CPM_Rate | 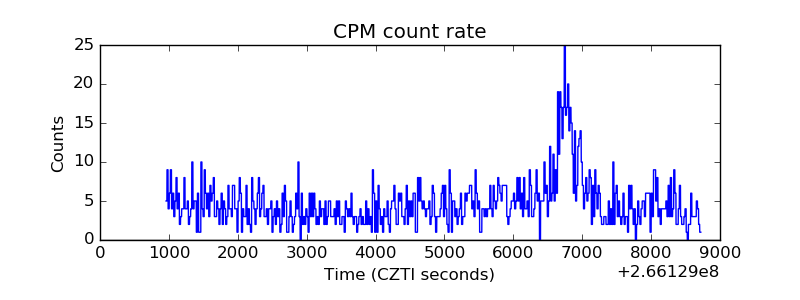 |
| CZT Counter | 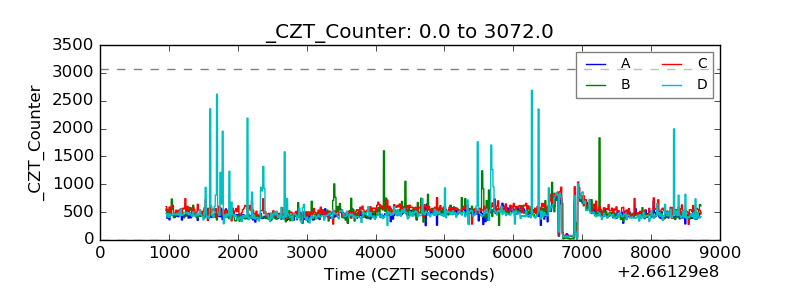 |
| +2.5 Volts monitor |  |
| +5 Volts monitor | 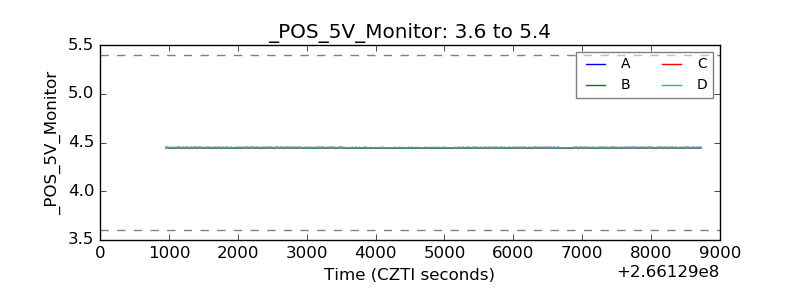 |
| _ROLL_ROT | 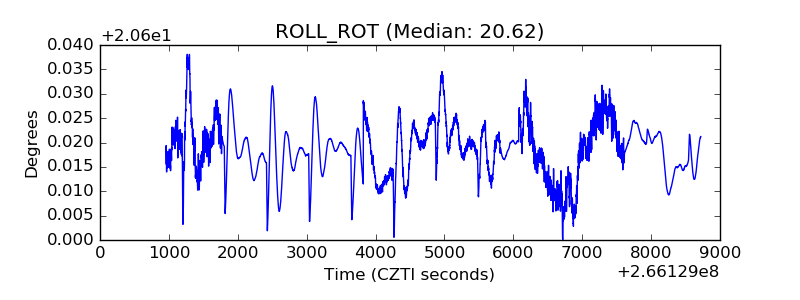 |
| _Roll_DEC | 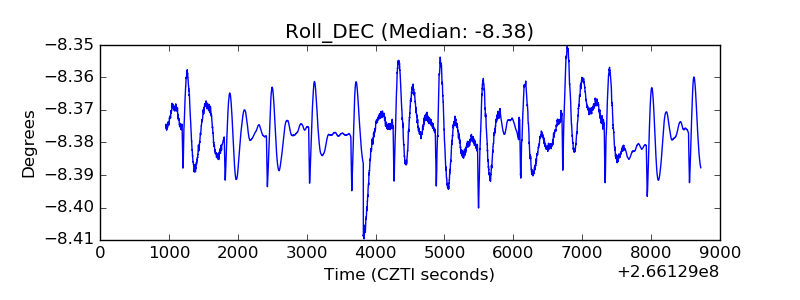 |
| _Roll_RA | 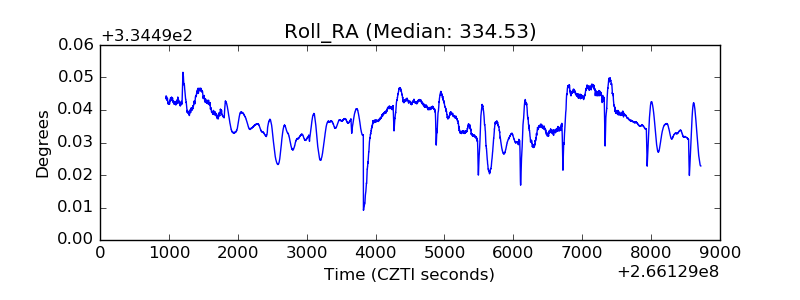 |
| Veto Counter | 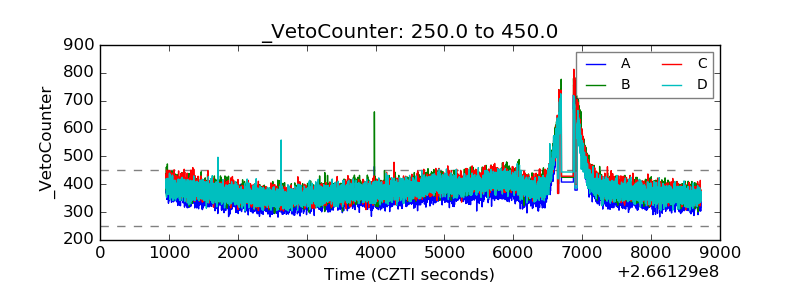 |