| Param | Original file | Final file |
|---|---|---|
| Filename | modeM0/AS1A04_089T01_9000002146_14570cztM0_level2.evt | modeM0/AS1A04_089T01_9000002146_14570cztM0_level2_quad_clean.evt |
| Size (bytes) | 2,637,538,560 | 429,364,800 |
| Size | 2.5 GB | 409.5 MB |
| Events in quadrant A | 18,494,237 | 2,679,247 |
| Events in quadrant B | 18,466,057 | 2,709,001 |
| Events in quadrant C | 20,003,429 | 2,614,960 |
| Events in quadrant D | 20,479,269 | 2,521,548 |
| Mode SS | |||
|---|---|---|---|
| Quadrant | BADHDUFLAG | Total packets | Discarded packets |
| A | 0 | 738 | 0 |
| B | 0 | 738 | 0 |
| C | 0 | 738 | 0 |
| D | 0 | 738 | 0 |
| Mode M9 | |||
|---|---|---|---|
| Quadrant | BADHDUFLAG | Total packets | Discarded packets |
| A | 0 | 36 | 0 |
| B | 0 | 36 | 0 |
| C | 0 | 36 | 0 |
| D | 0 | 36 | 0 |
| Mode M0 | |||
|---|---|---|---|
| Quadrant | BADHDUFLAG | Total packets | Discarded packets |
| A | 0 | 77409 | 10 |
| B | 0 | 77125 | 9 |
| C | 0 | 80965 | 9 |
| D | 0 | 84987 | 9 |
| Quadrant | Total seconds | Saturated seconds | Saturation percentage |
|---|---|---|---|
| A | 36086 | 527 | 1.460400% |
| B | 36086 | 556 | 1.540764% |
| C | 36086 | 431 | 1.194369% |
| D | 36086 | 1507 | 4.176135% |
Noise dominated data is calculated using 1-second bins in cleaned event files. If a bin has >2000 counts, and if more than 50% of those come from <1% of pixels, then it is considered to be noise-dominated and hence unusable.
| Quadrant | # 1 sec bins | Bins with >0 counts | Bins with >2000 counts | High rate bins dominated by noise | Noise dominated (total time) | Noise dominated (detector-on time) | Marked lightcurve |
|---|---|---|---|---|---|---|---|
| A | 39257 | 36096 | 8 | 8 | 0.02% | 0.02% | 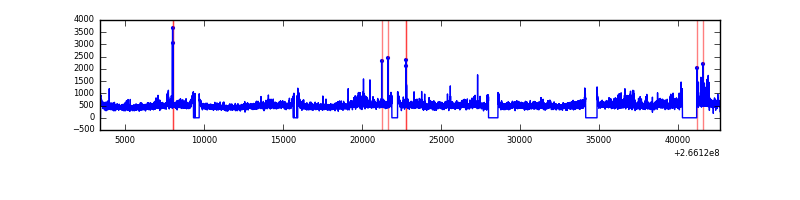 |
| B | 39257 | 36096 | 18 | 18 | 0.05% | 0.05% | 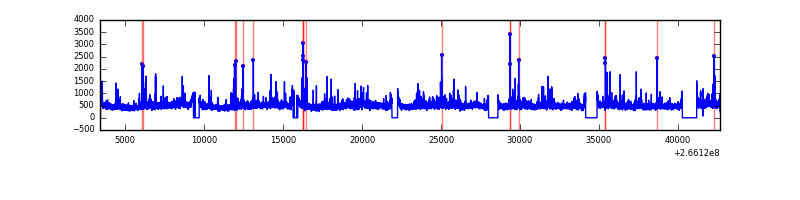 |
| C | 39257 | 36097 | 0 | 0 | 0.00% | 0.00% | 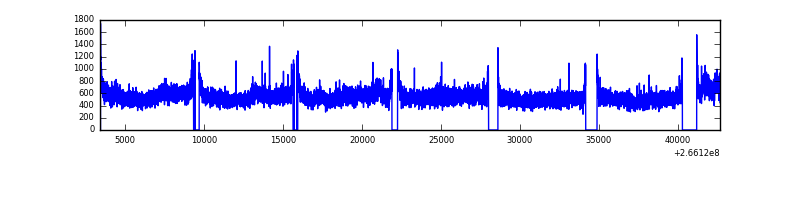 |
| D | 39257 | 36095 | 787 | 787 | 2.00% | 2.18% | 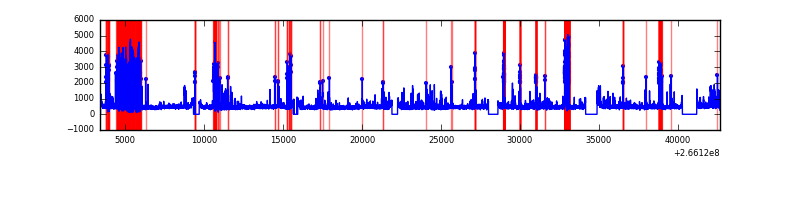 |
Top three noisy pixels from each quadrant. If the there are fewer than three noisy pixels in the level2.evt file, extra rows are filled as -1
| Pixel properties | Quadrant properties | ||||||
|---|---|---|---|---|---|---|---|
| Quadrant | DetID | PixID | Counts | Sigma | Mean | Median | Sigma |
| A | 8 | 15 | 1029411 | 1155.7 | 4383 | 4283 | 887.0 |
| A | 12 | 189 | 415942 | 464.09 | 4383 | 4283 | 887.0 |
| A | 0 | 23 | 152214 | 166.77 | 4383 | 4283 | 887.0 |
| B | 0 | 189 | 463387 | 552.21 | 4369 | 4255 | 831.4 |
| B | 0 | 229 | 118751 | 137.71 | 4369 | 4255 | 831.4 |
| B | 0 | 214 | 107669 | 124.38 | 4369 | 4255 | 831.4 |
| C | 3 | 233 | 3426175 | 3482.18 | 4241 | 4254 | 982.7 |
| C | 13 | 61 | 30479 | 26.69 | 4241 | 4254 | 982.7 |
| C | 8 | 128 | 24834 | 20.94 | 4241 | 4254 | 982.7 |
| D | 10 | 199 | 2992233 | 2736.64 | 4191 | 4098 | 1091.9 |
| D | 12 | 110 | 1006184 | 917.75 | 4191 | 4098 | 1091.9 |
| D | 1 | 52 | 205699 | 184.63 | 4191 | 4098 | 1091.9 |
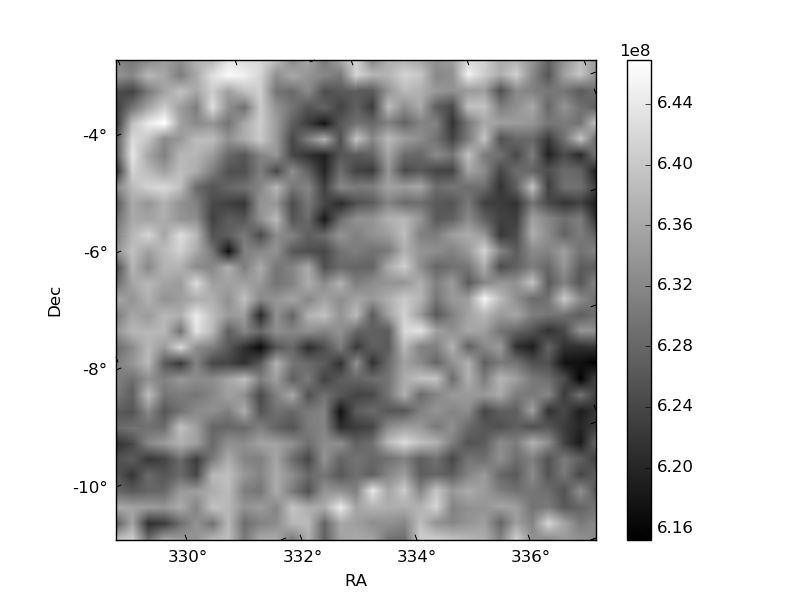
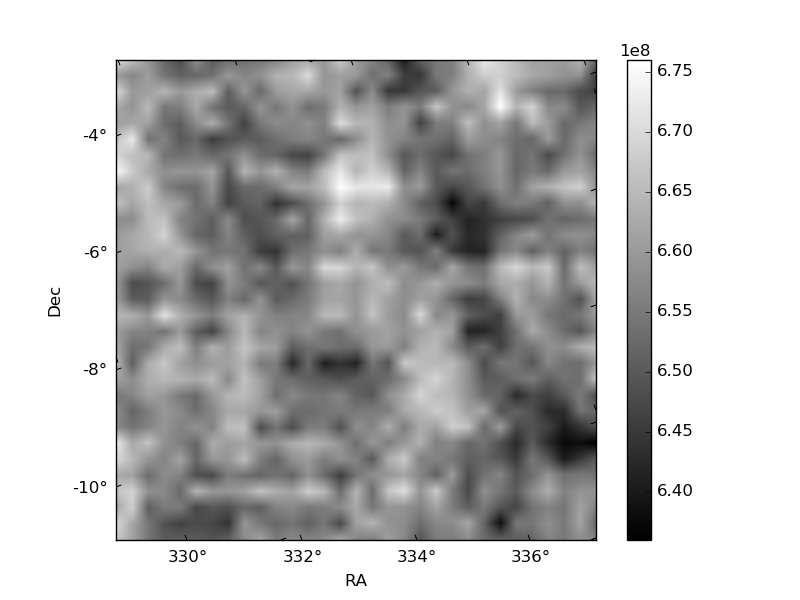
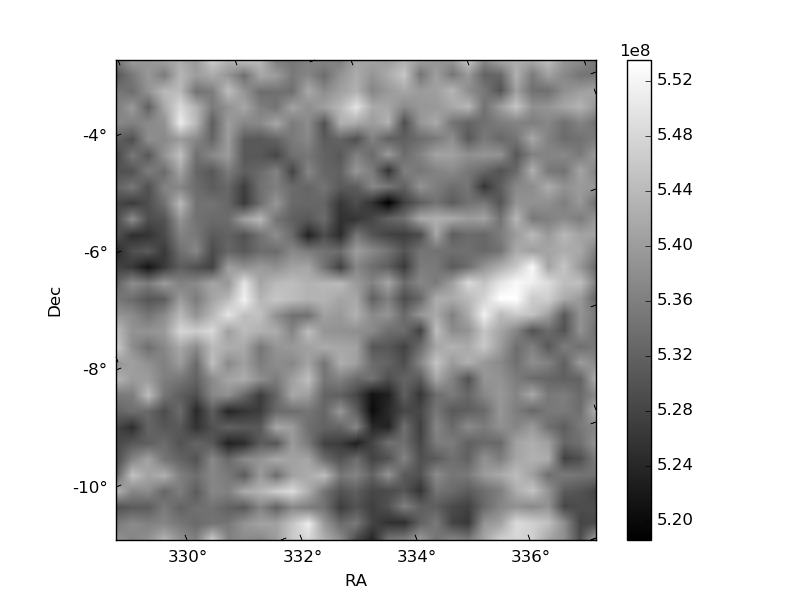
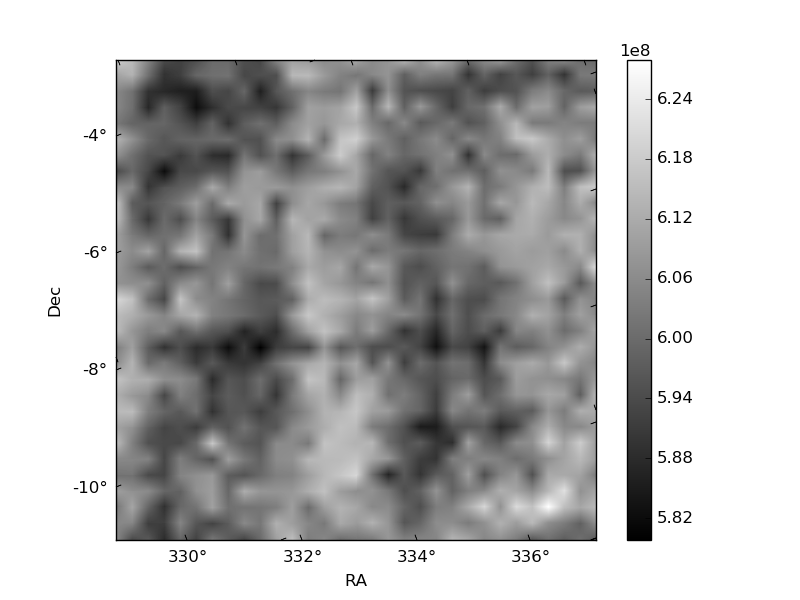
Histogram calculated using DETX and DETY for each event in the final _common_clean file
| Quadrant A |  |
 |
Quadrant B |
|---|---|---|---|
| Quadrant D |  |
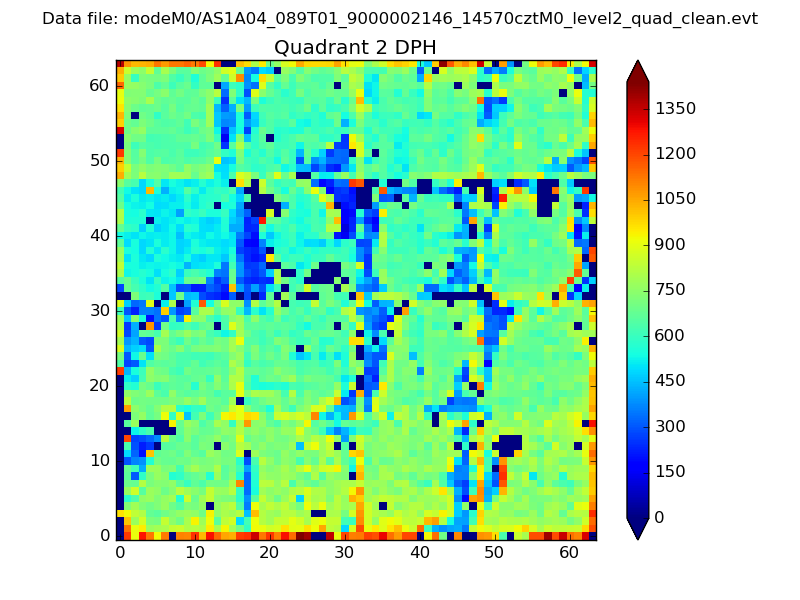 |
Quadrant C |
| Plot type | Count rate plots | Images |
|---|---|---|
| Comparison with Poisson distribution Blue bars denote a histogram of data divided into 1 sec bins. Red curve is a Poisson curve with rate = median count rate of data. |
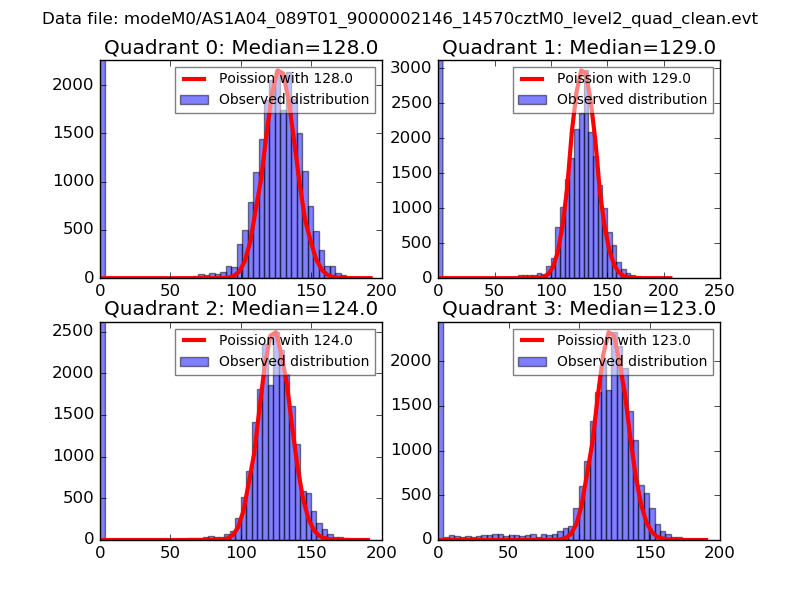 |
 |
| Quadrant-wise count rates Data is divided into 100 sec bins |
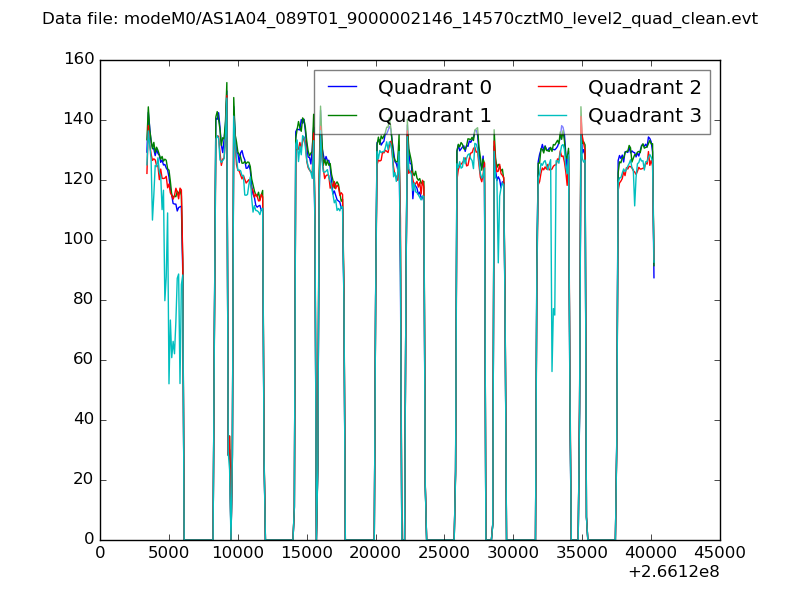 |
|
| Module-wise count rates for Quadrant A Data is divided into 100 sec bins |
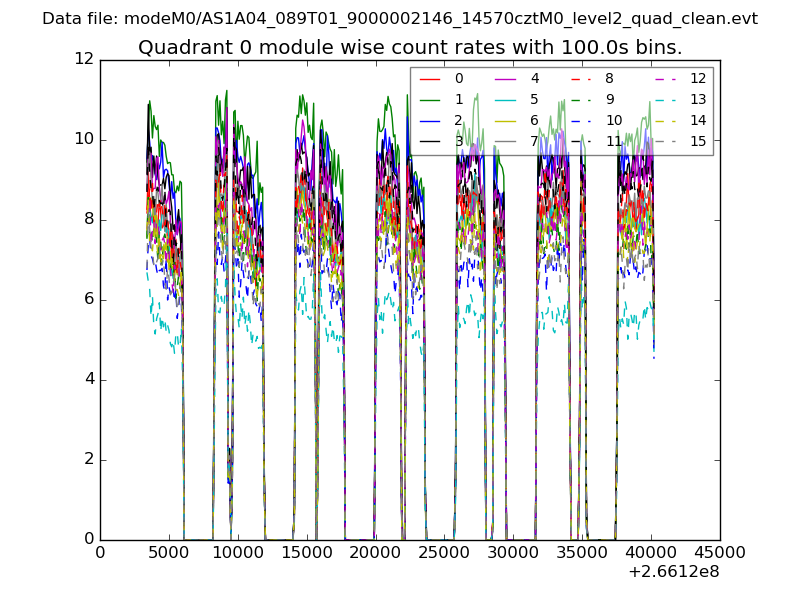 |
 |
| Module-wise count rates for Quadrant B Data is divided into 100 sec bins |
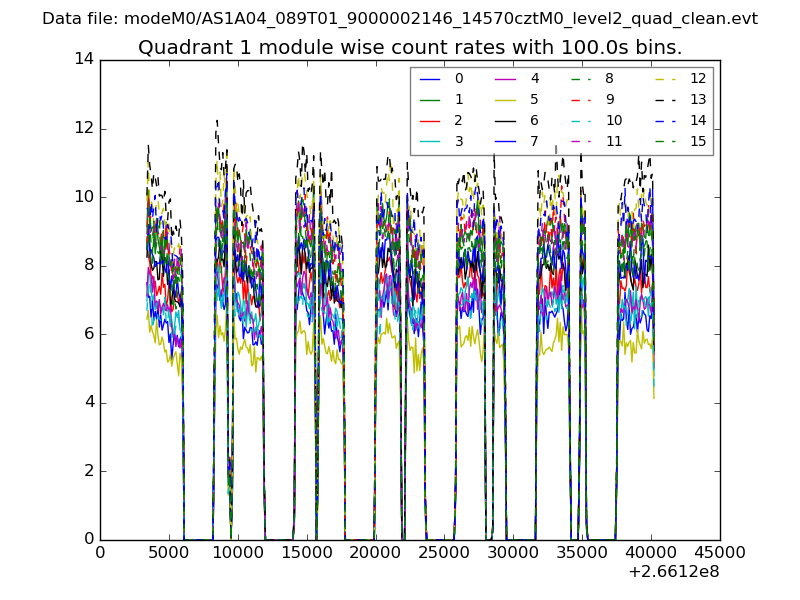 |
 |
| Module-wise count rates for Quadrant C Data is divided into 100 sec bins |
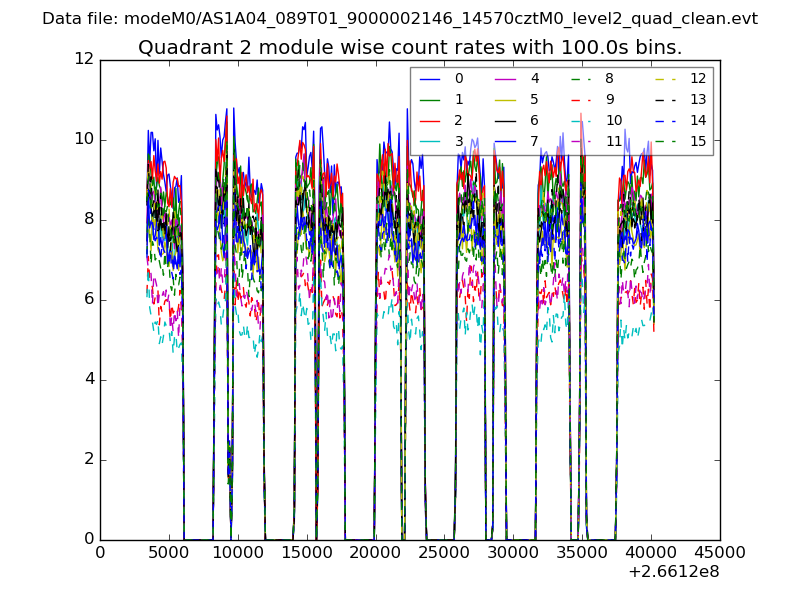 |
 |
| Module-wise count rates for Quadrant D Data is divided into 100 sec bins |
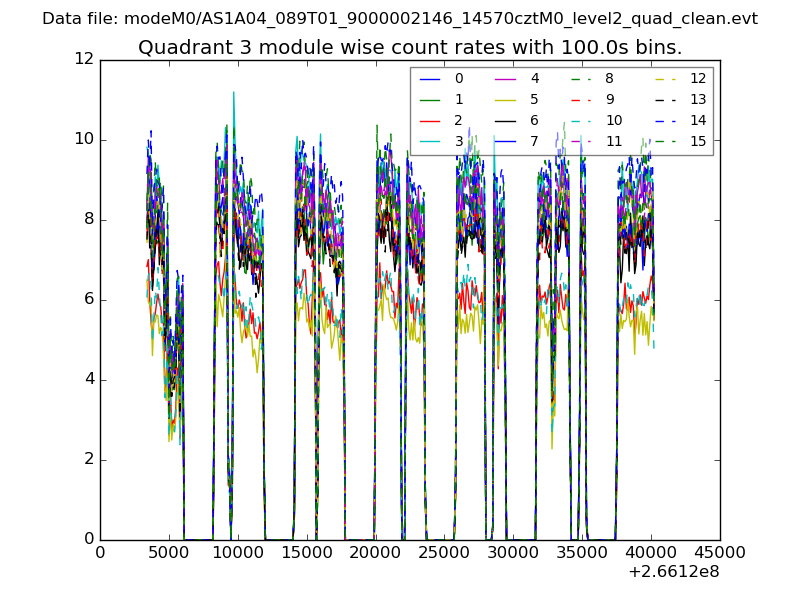 |
 |
| Parameter | Plot |
|---|---|
| CZT HV Monitor | 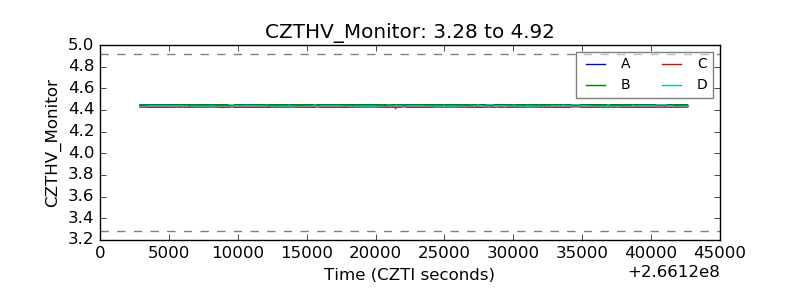 |
| D_VDD | 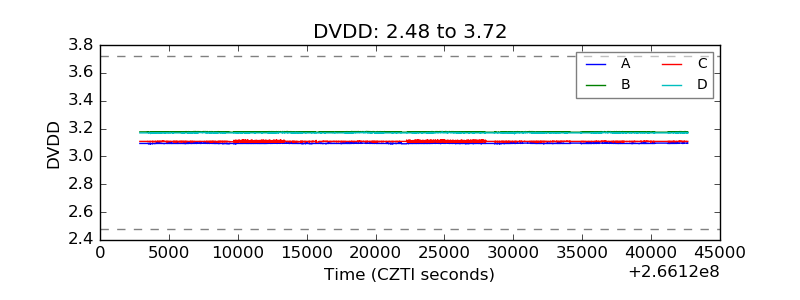 |
| Temperature 1 | 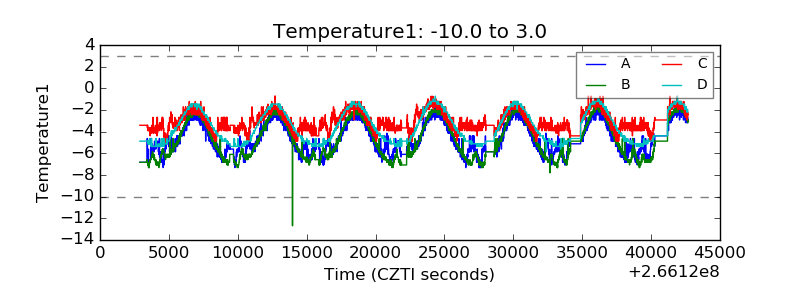 |
| Veto HV Monitor | 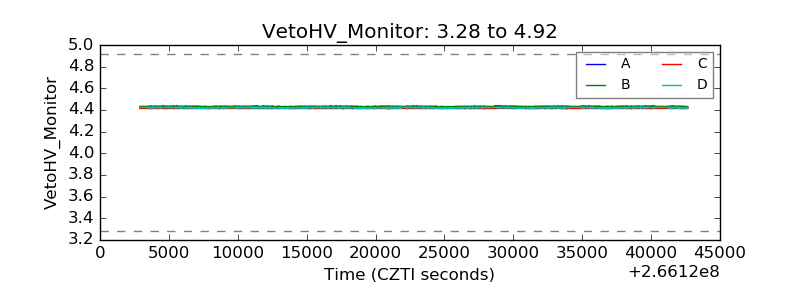 |
| Veto LLD | 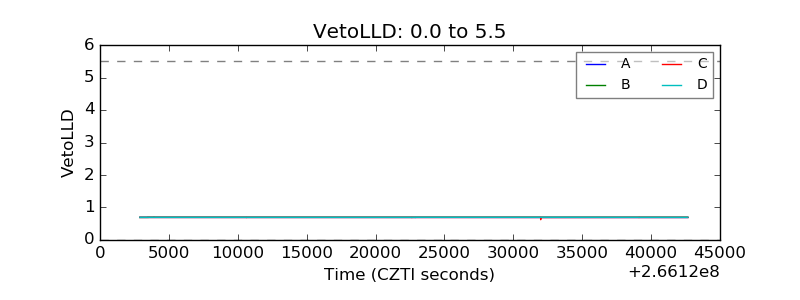 |
| Alpha Counter | 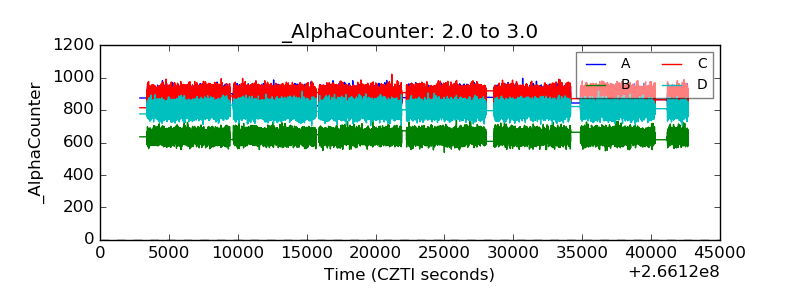 |
| _CPM_Rate | 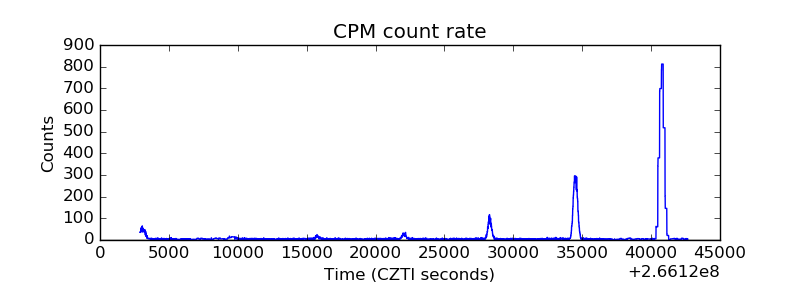 |
| CZT Counter | 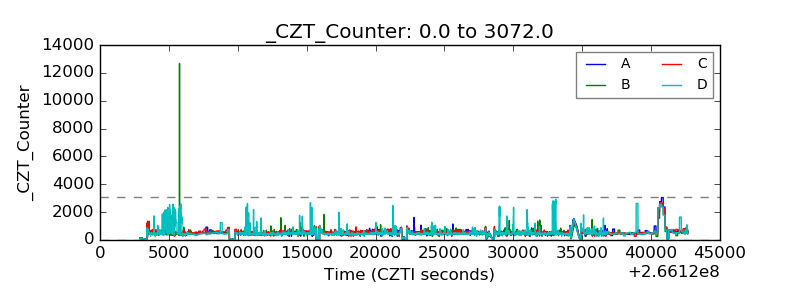 |
| +2.5 Volts monitor |  |
| +5 Volts monitor | 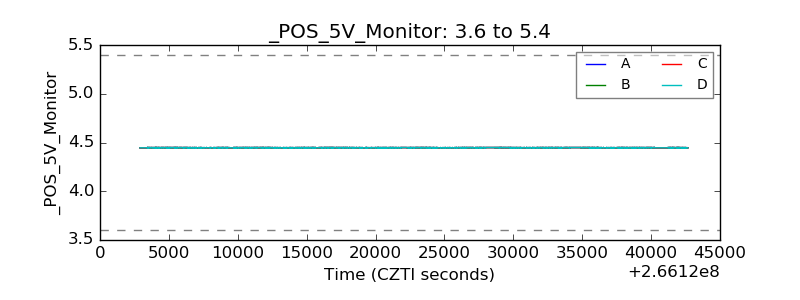 |
| _ROLL_ROT | 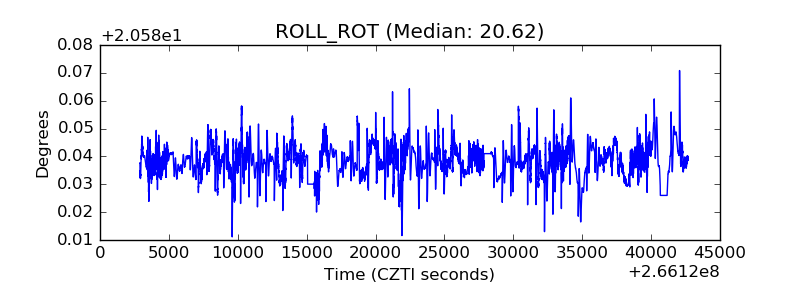 |
| _Roll_DEC | 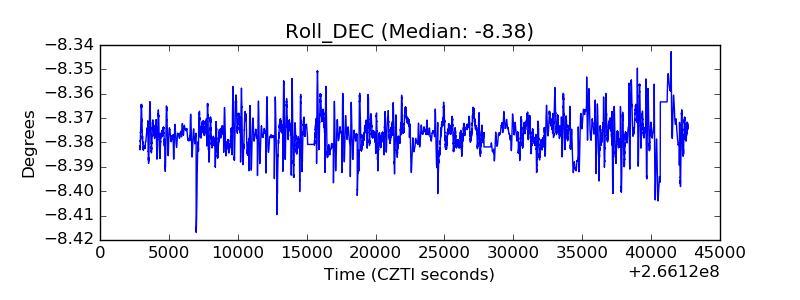 |
| _Roll_RA |  |
| Veto Counter | 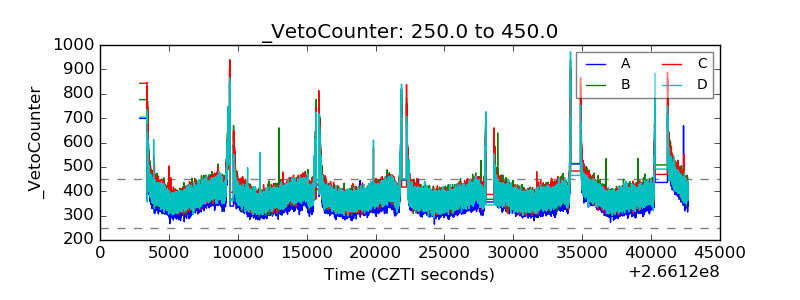 |