| Param | Original file | Final file |
|---|---|---|
| Filename | modeM0/AS1A04_089T01_9000002146_14571cztM0_level2.evt | modeM0/AS1A04_089T01_9000002146_14571cztM0_level2_quad_clean.evt |
| Size (bytes) | 510,791,040 | 65,479,680 |
| Size | 487.1 MB | 62.4 MB |
| Events in quadrant A | 3,904,539 | 389,147 |
| Events in quadrant B | 3,548,397 | 390,471 |
| Events in quadrant C | 4,131,521 | 372,607 |
| Events in quadrant D | 3,443,733 | 376,406 |
| Mode SS | |||
|---|---|---|---|
| Quadrant | BADHDUFLAG | Total packets | Discarded packets |
| A | 0 | 134 | 0 |
| B | 0 | 134 | 0 |
| C | 0 | 134 | 0 |
| D | 0 | 134 | 0 |
| Mode M9 | |||
|---|---|---|---|
| Quadrant | BADHDUFLAG | Total packets | Discarded packets |
| A | 0 | 11 | 0 |
| B | 0 | 11 | 0 |
| C | 0 | 11 | 0 |
| D | 0 | 12 | 0 |
| Mode M0 | |||
|---|---|---|---|
| Quadrant | BADHDUFLAG | Total packets | Discarded packets |
| A | 0 | 15827 | 3 |
| B | 0 | 14636 | 2 |
| C | 0 | 17043 | 2 |
| D | 0 | 14535 | 2 |
| Quadrant | Total seconds | Saturated seconds | Saturation percentage |
|---|---|---|---|
| A | 6501 | 89 | 1.369020% |
| B | 6501 | 97 | 1.492078% |
| C | 6501 | 68 | 1.045993% |
| D | 6501 | 64 | 0.984464% |
Noise dominated data is calculated using 1-second bins in cleaned event files. If a bin has >2000 counts, and if more than 50% of those come from <1% of pixels, then it is considered to be noise-dominated and hence unusable.
| Quadrant | # 1 sec bins | Bins with >0 counts | Bins with >2000 counts | High rate bins dominated by noise | Noise dominated (total time) | Noise dominated (detector-on time) | Marked lightcurve |
|---|---|---|---|---|---|---|---|
| A | 7547 | 6503 | 4 | 4 | 0.05% | 0.06% | 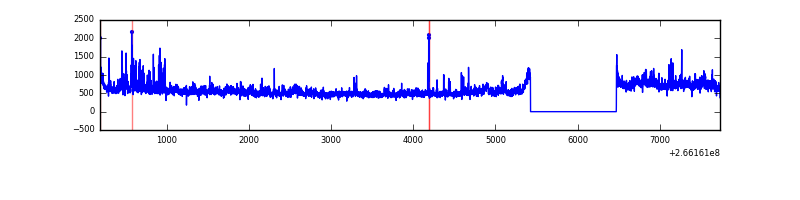 |
| B | 7547 | 6503 | 13 | 13 | 0.17% | 0.20% | 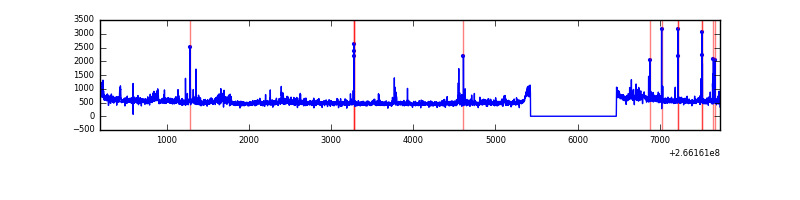 |
| C | 7547 | 6503 | 1 | 1 | 0.01% | 0.02% | 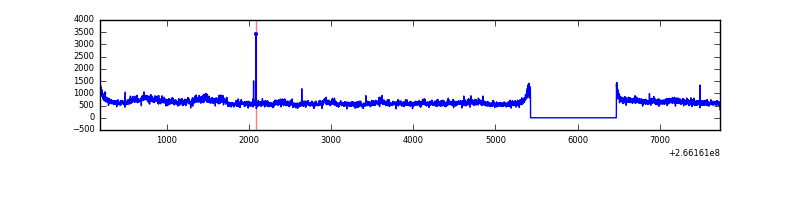 |
| D | 7547 | 6503 | 1 | 1 | 0.01% | 0.02% | 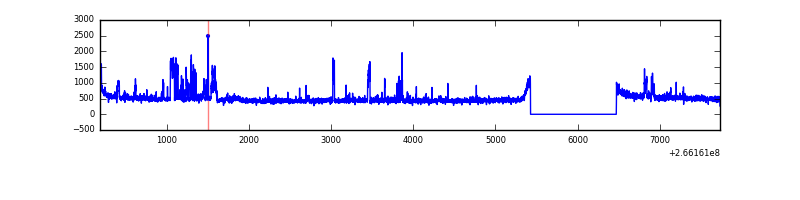 |
Top three noisy pixels from each quadrant. If the there are fewer than three noisy pixels in the level2.evt file, extra rows are filled as -1
| Pixel properties | Quadrant properties | ||||||
|---|---|---|---|---|---|---|---|
| Quadrant | DetID | PixID | Counts | Sigma | Mean | Median | Sigma |
| A | 8 | 15 | 472204 | 2799.61 | 829 | 811 | 168.4 |
| A | 0 | 23 | 142181 | 839.6 | 829 | 811 | 168.4 |
| A | 12 | 189 | 62007 | 363.44 | 829 | 811 | 168.4 |
| B | 0 | 189 | 117504 | 737.63 | 827 | 806 | 158.2 |
| B | 10 | 16 | 64804 | 404.52 | 827 | 806 | 158.2 |
| B | 0 | 219 | 29703 | 182.65 | 827 | 806 | 158.2 |
| C | 3 | 233 | 1005282 | 5440.64 | 798 | 803 | 184.6 |
| C | 14 | 234 | 7653 | 37.1 | 798 | 803 | 184.6 |
| C | 13 | 61 | 5788 | 27.0 | 798 | 803 | 184.6 |
| D | 12 | 110 | 313076 | 1453.66 | 804 | 788 | 214.8 |
| D | 2 | 152 | 30571 | 138.64 | 804 | 788 | 214.8 |
| D | 10 | 199 | 25826 | 116.55 | 804 | 788 | 214.8 |
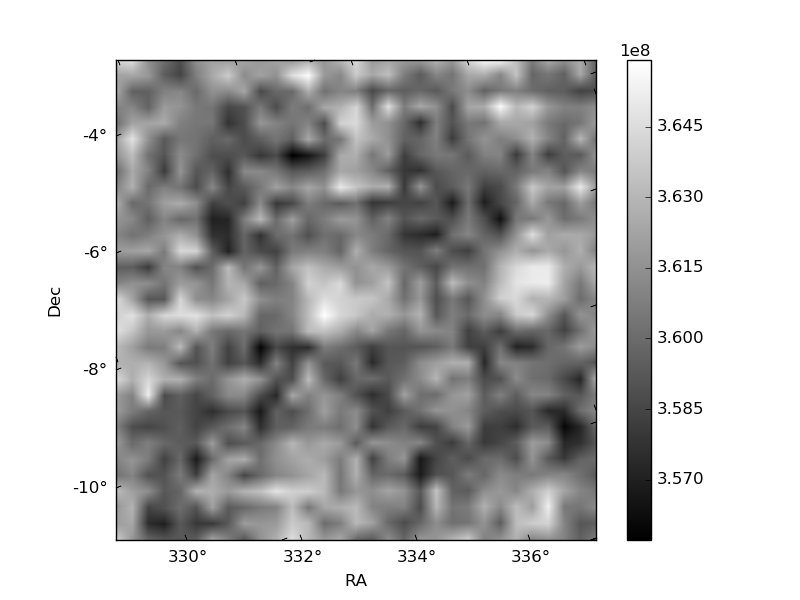
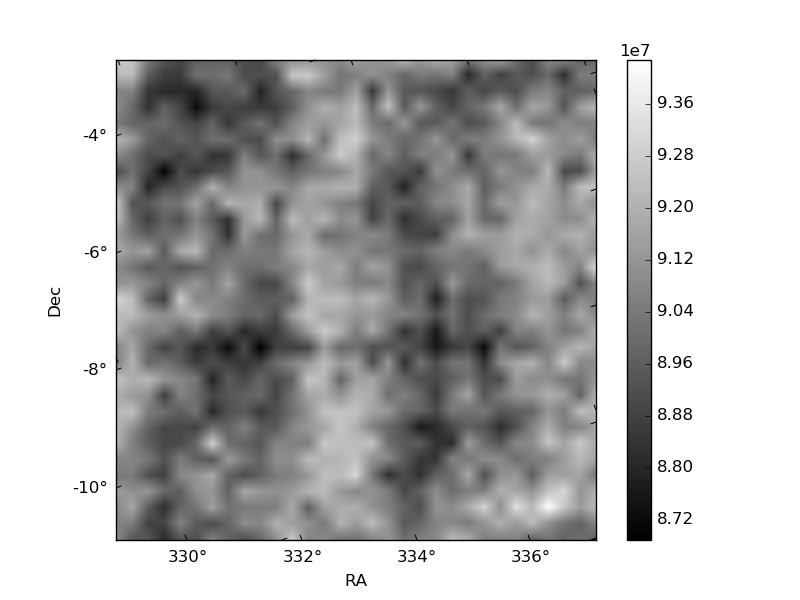
Histogram calculated using DETX and DETY for each event in the final _common_clean file
| Quadrant A | 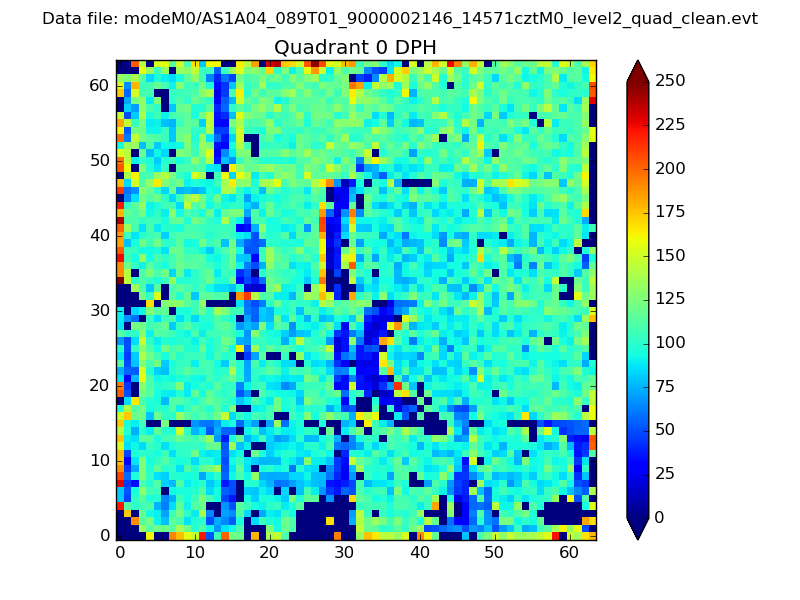 |
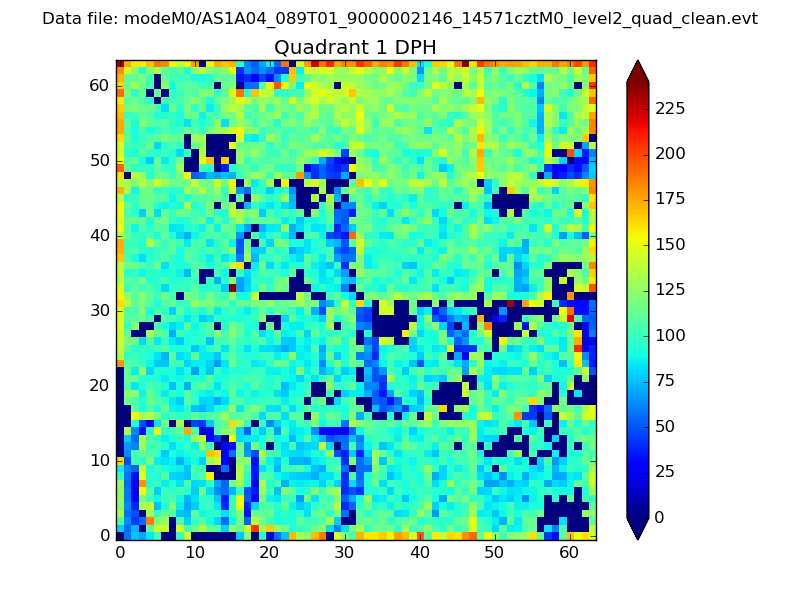 |
Quadrant B |
|---|---|---|---|
| Quadrant D | 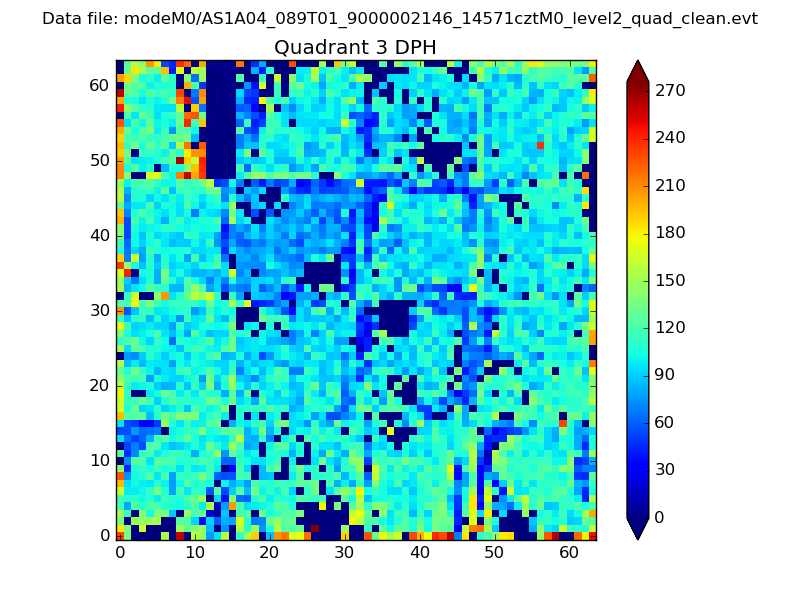 |
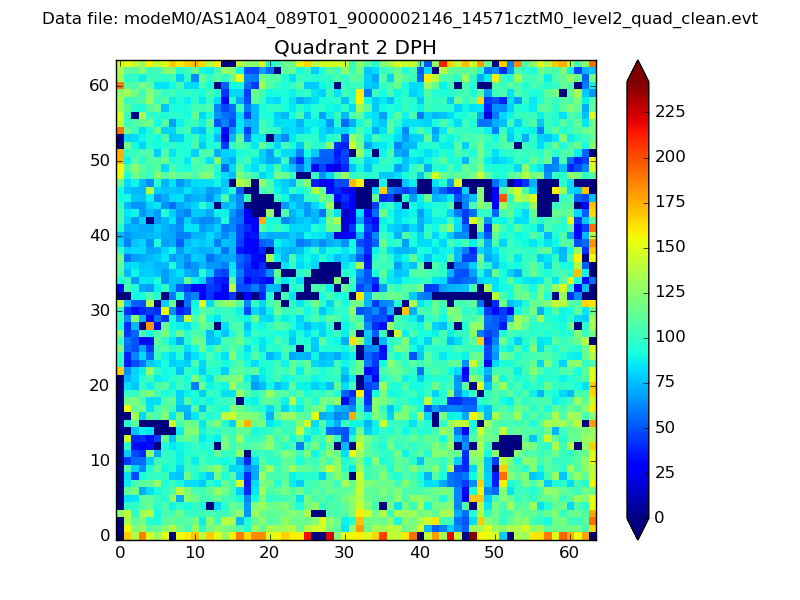 |
Quadrant C |
| Plot type | Count rate plots | Images |
|---|---|---|
| Comparison with Poisson distribution Blue bars denote a histogram of data divided into 1 sec bins. Red curve is a Poisson curve with rate = median count rate of data. |
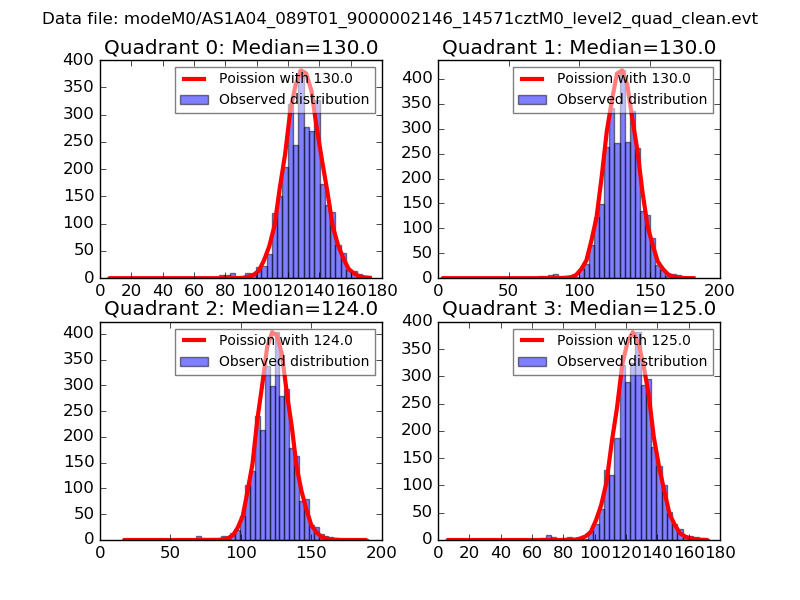 |
 |
| Quadrant-wise count rates Data is divided into 100 sec bins |
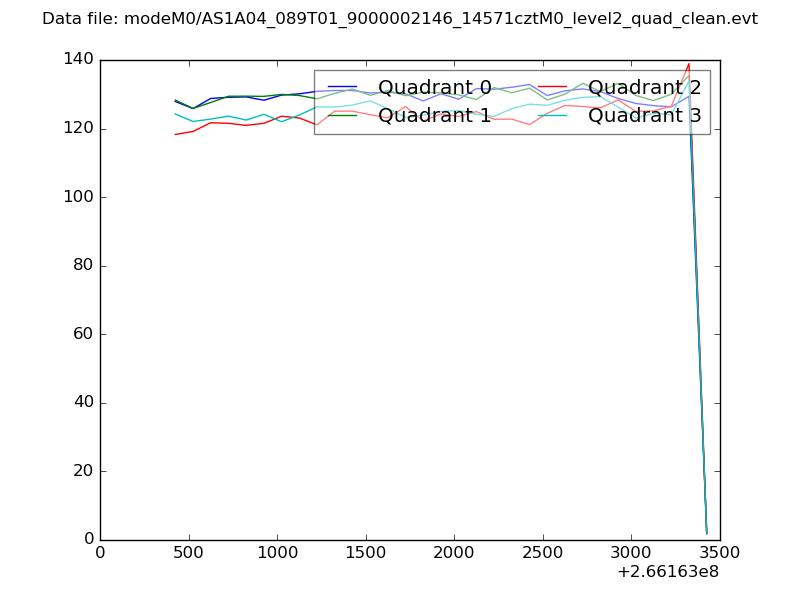 |
|
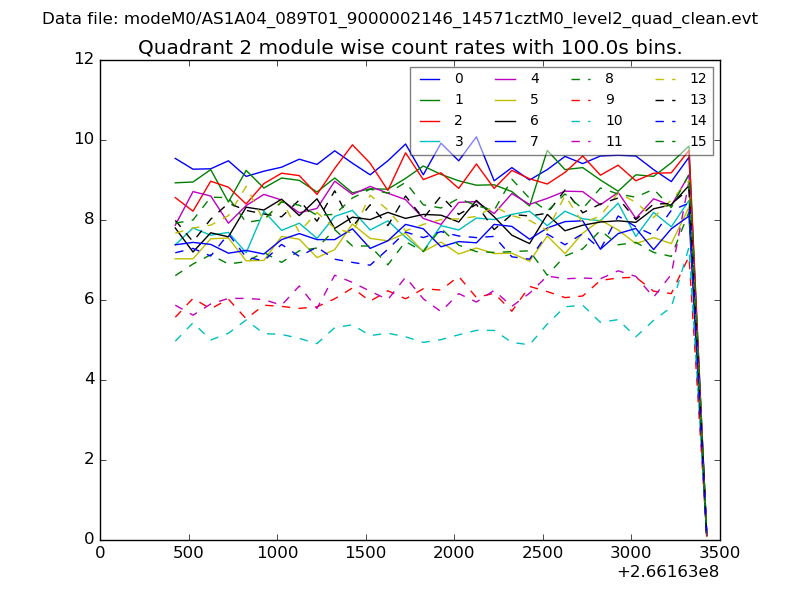
| Module-wise count rates for Quadrant A Data is divided into 100 sec bins |
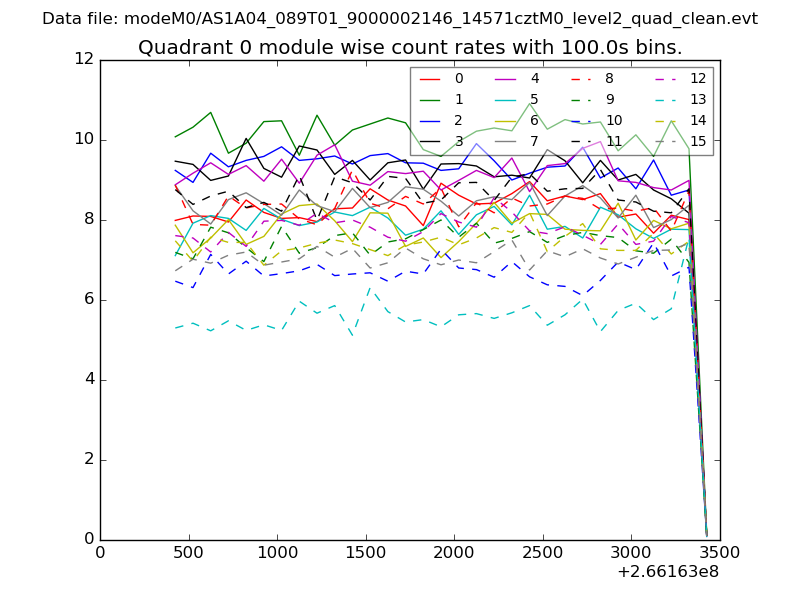 |
 |
| Module-wise count rates for Quadrant B Data is divided into 100 sec bins |
 |
 |
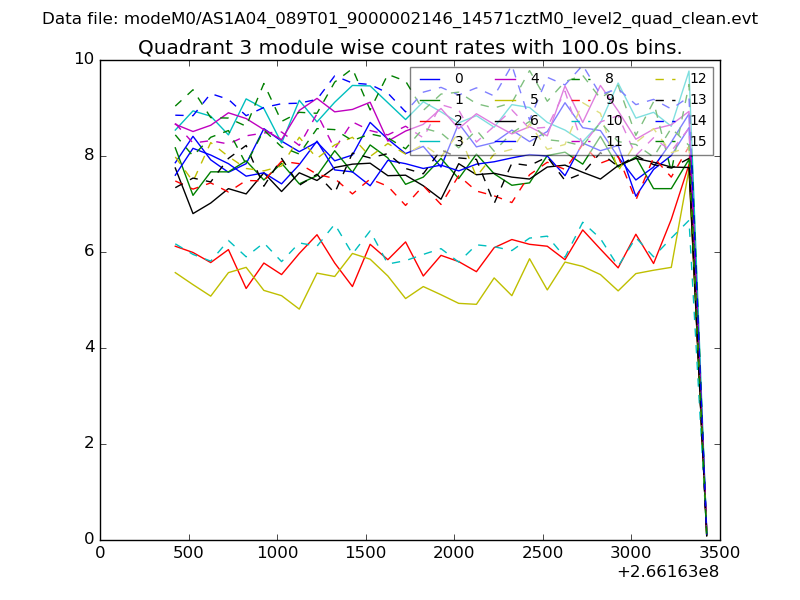
| Module-wise count rates for Quadrant C Data is divided into 100 sec bins |
 |
 |
| Module-wise count rates for Quadrant D Data is divided into 100 sec bins |
 |
 |
| Parameter | Plot |
|---|---|
| CZT HV Monitor | 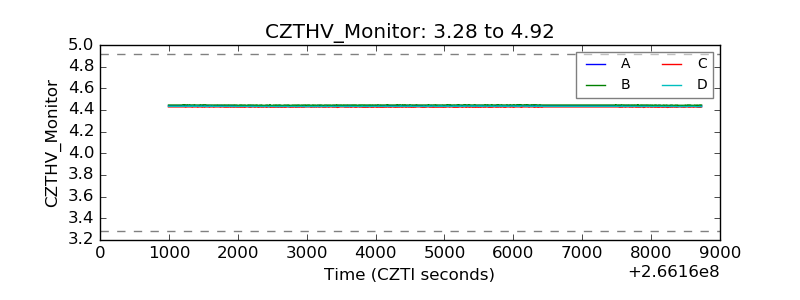 |
| D_VDD | 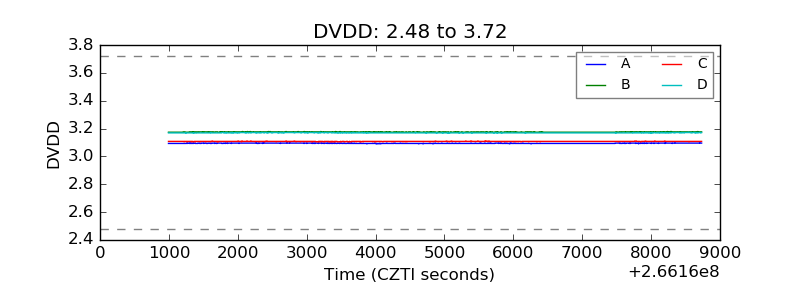 |
| Temperature 1 | 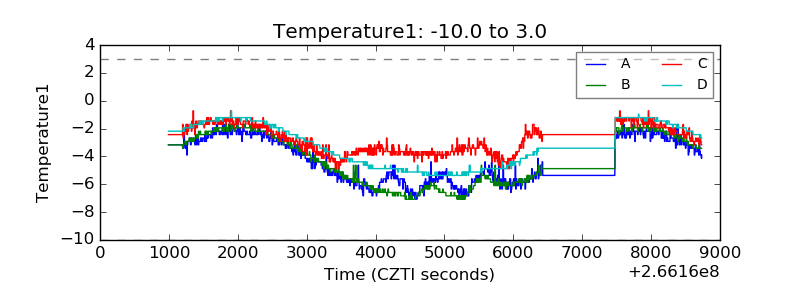 |
| Veto HV Monitor | 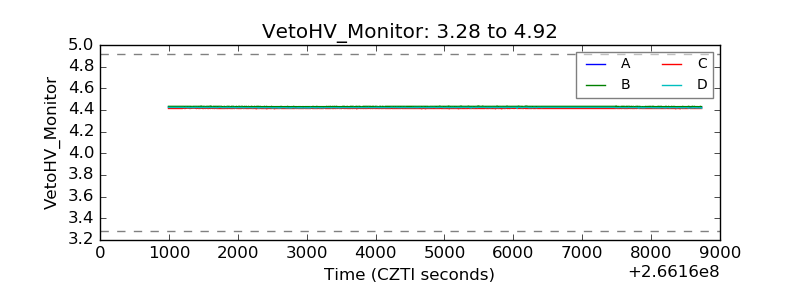 |
| Veto LLD | 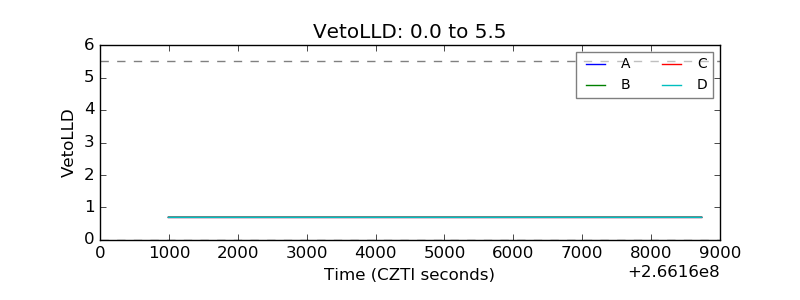 |
| Alpha Counter | 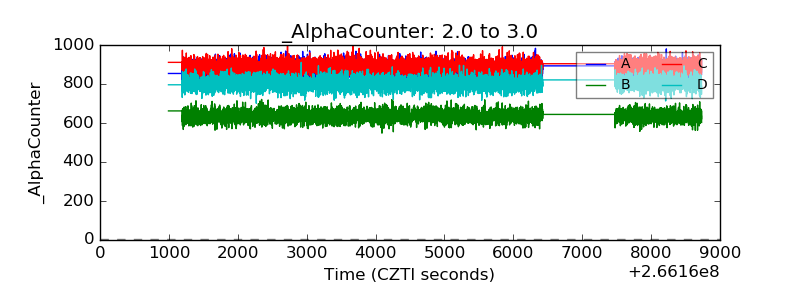 |
| _CPM_Rate | 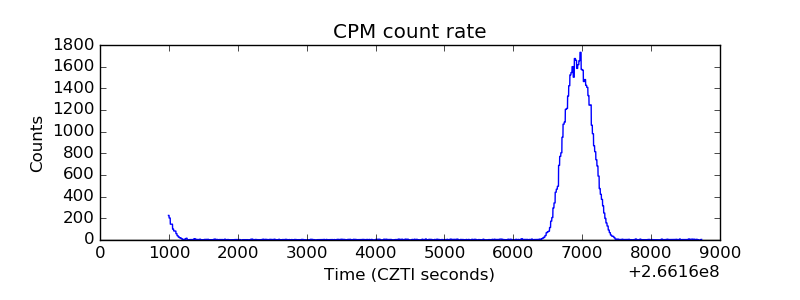 |
| CZT Counter | 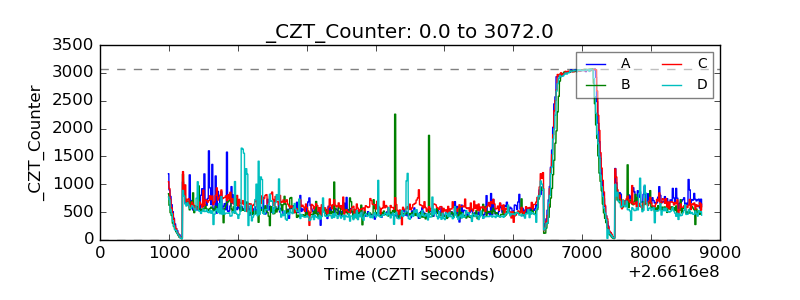 |
| +2.5 Volts monitor |  |
| +5 Volts monitor |  |
| _ROLL_ROT | 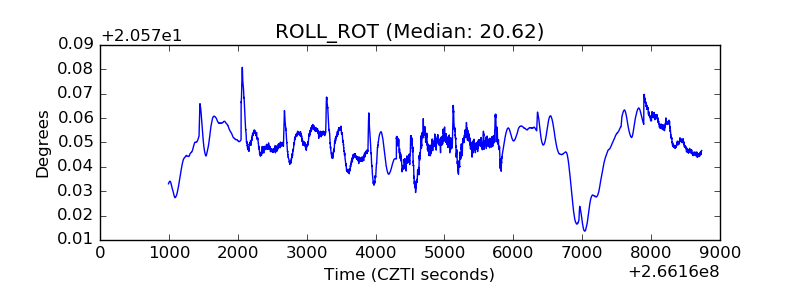 |
| _Roll_DEC | 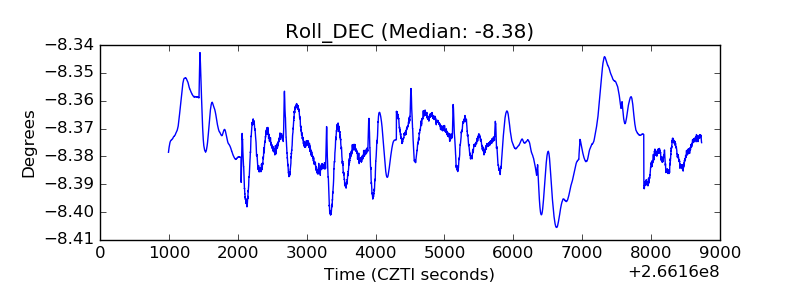 |
| _Roll_RA | 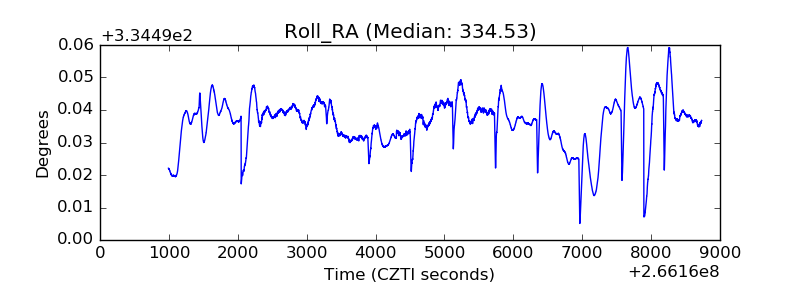 |
| Veto Counter |  |