| Param | Original file | Final file |
|---|---|---|
| Filename | modeM0/AS1A04_089T01_9000002146_14573cztM0_level2.evt | modeM0/AS1A04_089T01_9000002146_14573cztM0_level2_quad_clean.evt |
| Size (bytes) | 560,522,880 | 71,461,440 |
| Size | 534.6 MB | 68.2 MB |
| Events in quadrant A | 5,877,799 | 429,932 |
| Events in quadrant B | 3,571,846 | 443,046 |
| Events in quadrant C | 3,788,068 | 426,690 |
| Events in quadrant D | 3,309,698 | 422,596 |
| Mode SS | |||
|---|---|---|---|
| Quadrant | BADHDUFLAG | Total packets | Discarded packets |
| A | 0 | 128 | 0 |
| B | 0 | 128 | 0 |
| C | 0 | 128 | 0 |
| D | 0 | 128 | 0 |
| Mode M9 | |||
|---|---|---|---|
| Quadrant | BADHDUFLAG | Total packets | Discarded packets |
| A | 0 | 12 | 0 |
| B | 0 | 12 | 0 |
| C | 0 | 12 | 0 |
| D | 0 | 13 | 0 |
| Mode M0 | |||
|---|---|---|---|
| Quadrant | BADHDUFLAG | Total packets | Discarded packets |
| A | 0 | 21868 | 3 |
| B | 0 | 14839 | 2 |
| C | 0 | 15428 | 2 |
| D | 0 | 13940 | 2 |
| Quadrant | Total seconds | Saturated seconds | Saturation percentage |
|---|---|---|---|
| A | 6327 | 320 | 5.057689% |
| B | 6327 | 124 | 1.959855% |
| C | 6327 | 57 | 0.900901% |
| D | 6327 | 61 | 0.964122% |
Noise dominated data is calculated using 1-second bins in cleaned event files. If a bin has >2000 counts, and if more than 50% of those come from <1% of pixels, then it is considered to be noise-dominated and hence unusable.
| Quadrant | # 1 sec bins | Bins with >0 counts | Bins with >2000 counts | High rate bins dominated by noise | Noise dominated (total time) | Noise dominated (detector-on time) | Marked lightcurve |
|---|---|---|---|---|---|---|---|
| A | 7493 | 6329 | 203 | 203 | 2.71% | 3.21% | 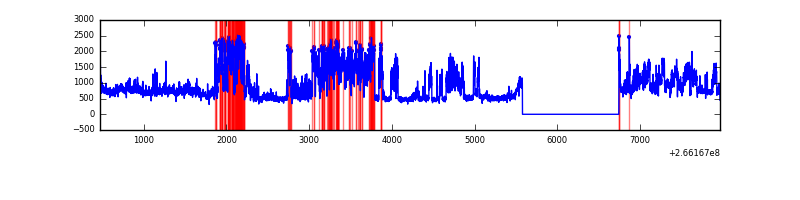 |
| B | 7493 | 6329 | 21 | 21 | 0.28% | 0.33% | 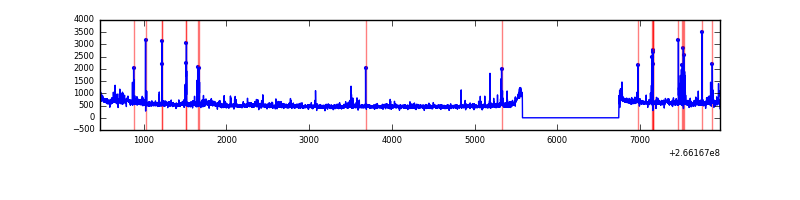 |
| C | 7493 | 6329 | 0 | 0 | 0.00% | 0.00% | 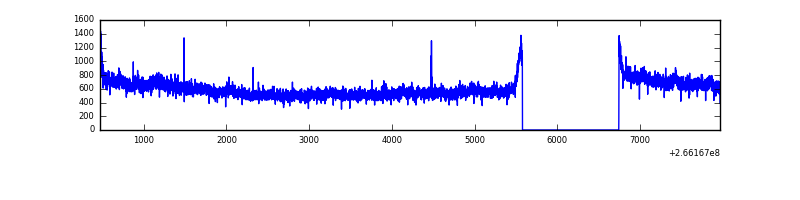 |
| D | 7493 | 6329 | 11 | 11 | 0.15% | 0.17% | 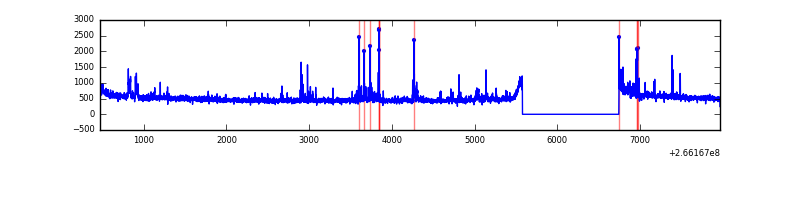 |
Top three noisy pixels from each quadrant. If the there are fewer than three noisy pixels in the level2.evt file, extra rows are filled as -1
| Pixel properties | Quadrant properties | ||||||
|---|---|---|---|---|---|---|---|
| Quadrant | DetID | PixID | Counts | Sigma | Mean | Median | Sigma |
| A | 0 | 23 | 2205164 | 13263.01 | 829 | 812 | 166.2 |
| A | 8 | 15 | 299742 | 1798.58 | 829 | 812 | 166.2 |
| A | 0 | 226 | 142137 | 850.31 | 829 | 812 | 166.2 |
| B | 10 | 16 | 129987 | 811.44 | 834 | 815 | 159.2 |
| B | 0 | 189 | 65126 | 403.99 | 834 | 815 | 159.2 |
| B | 0 | 219 | 46051 | 284.17 | 834 | 815 | 159.2 |
| C | 3 | 233 | 632549 | 3405.49 | 807 | 814 | 185.5 |
| C | 13 | 61 | 5753 | 26.62 | 807 | 814 | 185.5 |
| C | 14 | 225 | 5615 | 25.88 | 807 | 814 | 185.5 |
| D | 12 | 110 | 59549 | 300.39 | 815 | 795 | 195.6 |
| D | 13 | 122 | 46267 | 232.48 | 815 | 795 | 195.6 |
| D | 2 | 152 | 45988 | 231.06 | 815 | 795 | 195.6 |
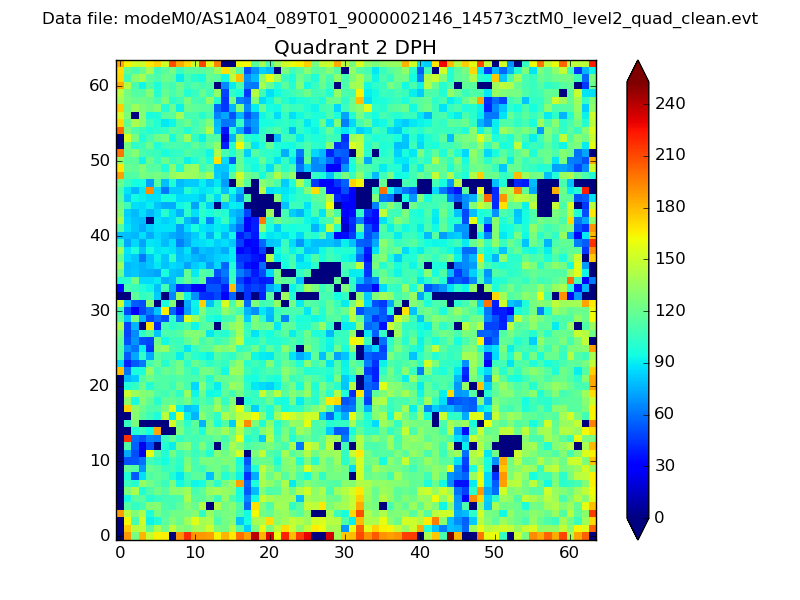
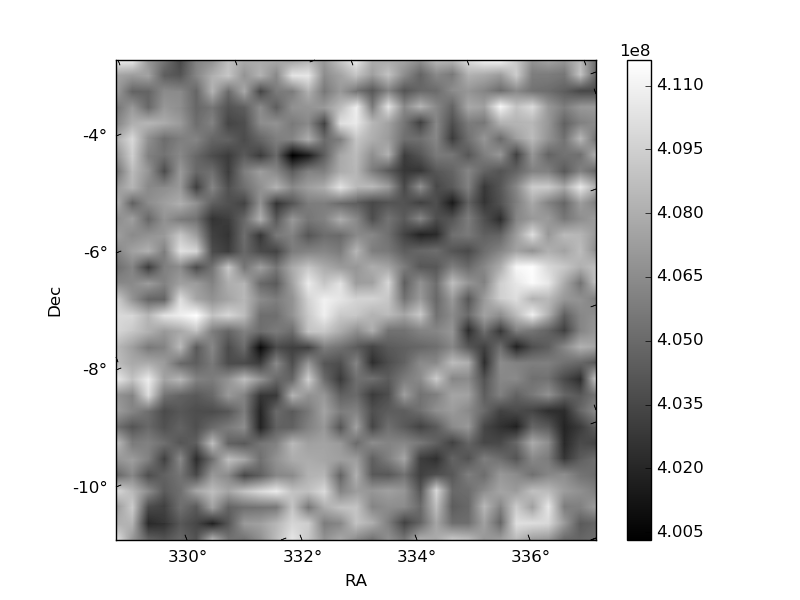
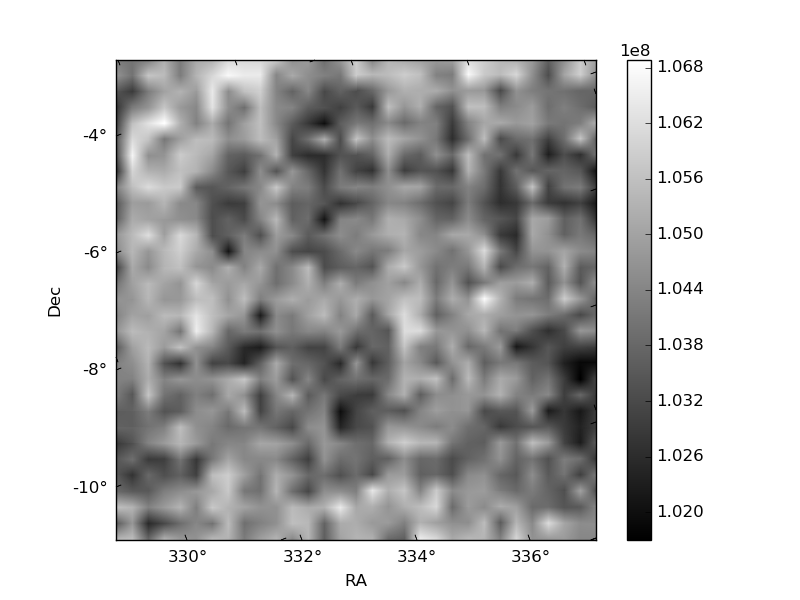
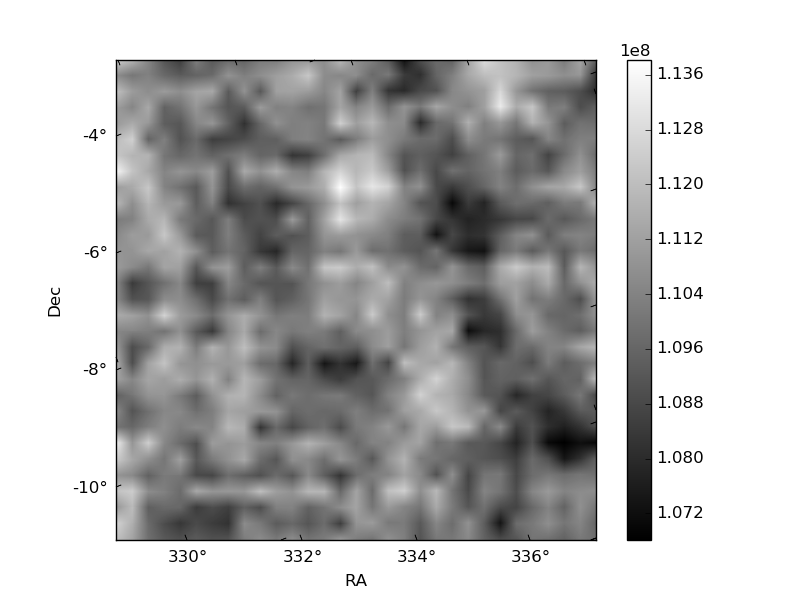
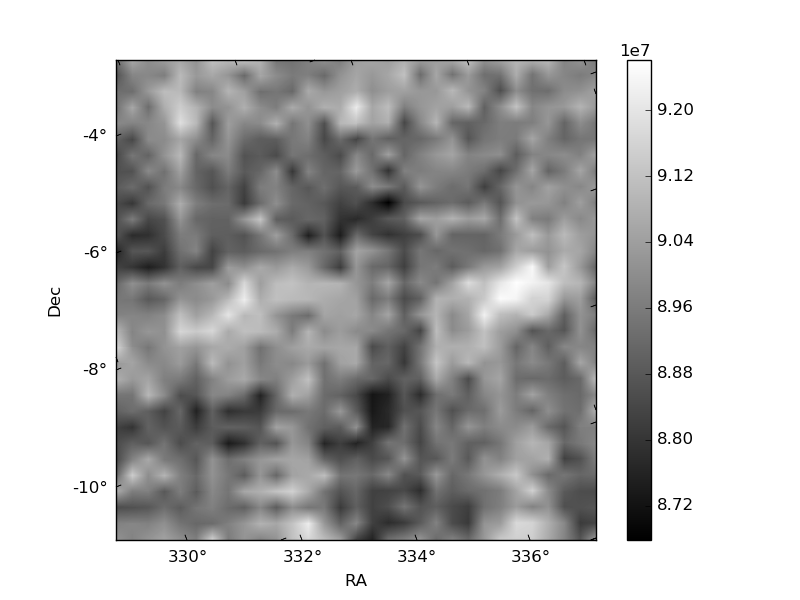
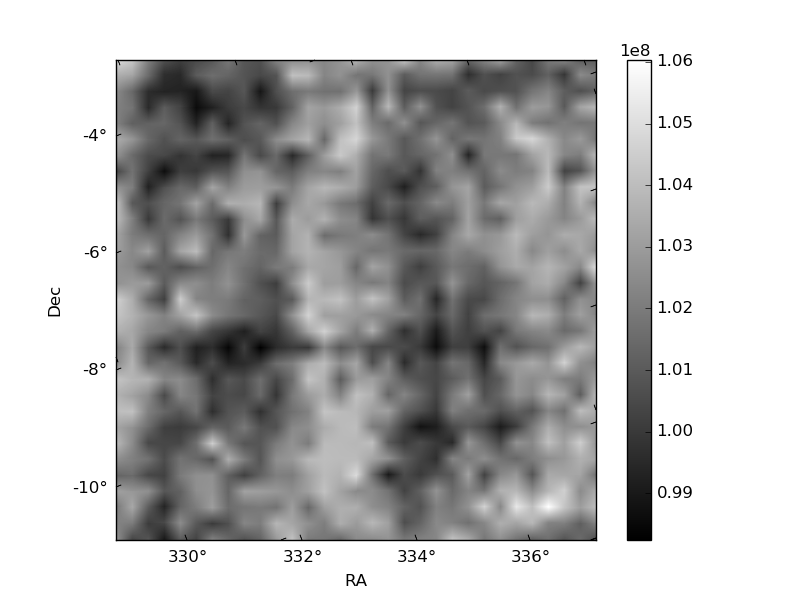
Histogram calculated using DETX and DETY for each event in the final _common_clean file
| Quadrant A | 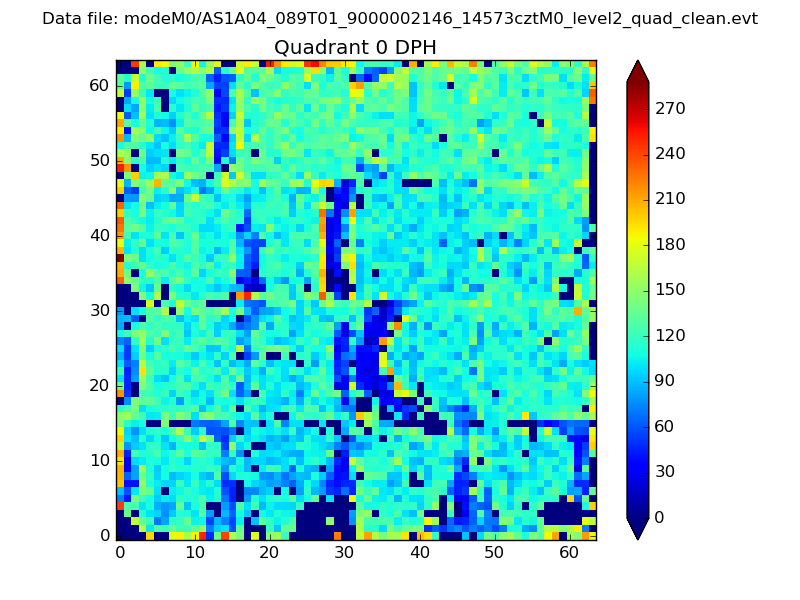 |
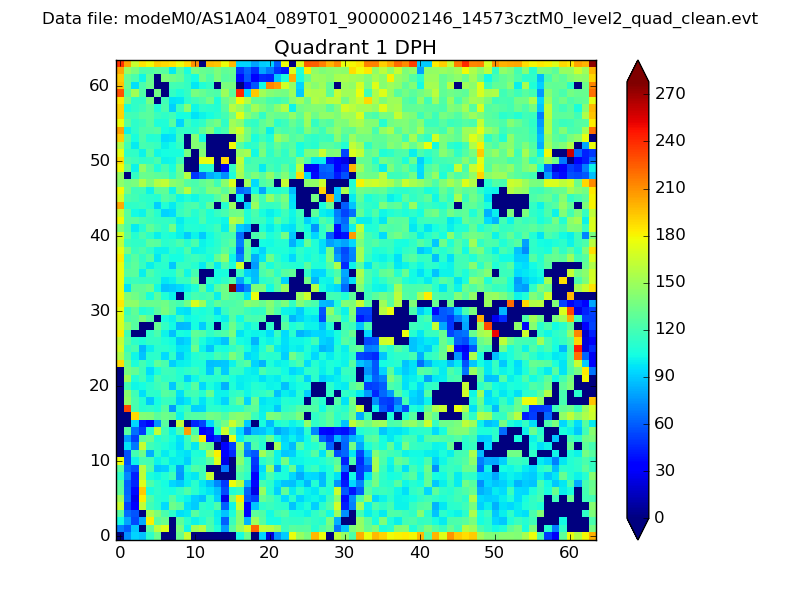 |
Quadrant B |
|---|---|---|---|
| Quadrant D | 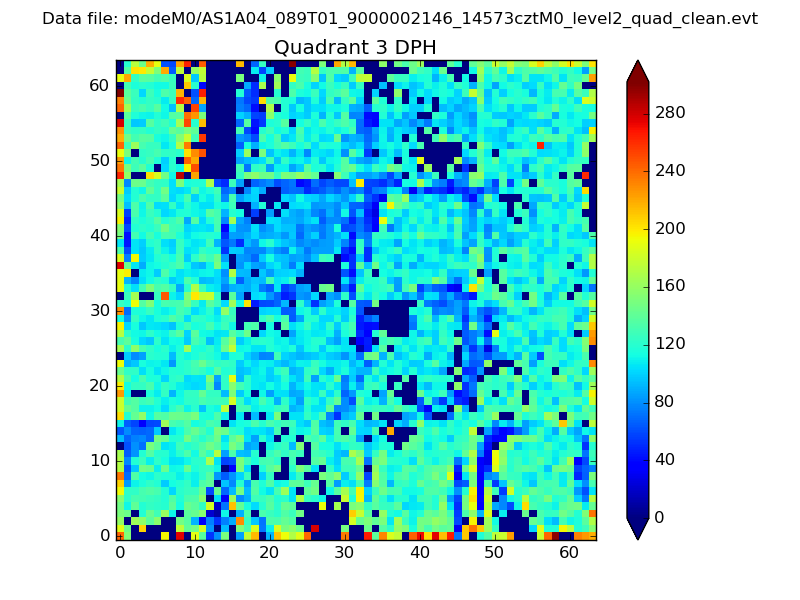 |
 |
Quadrant C |
| Plot type | Count rate plots | Images |
|---|---|---|
| Comparison with Poisson distribution Blue bars denote a histogram of data divided into 1 sec bins. Red curve is a Poisson curve with rate = median count rate of data. |
 |
 |
| Quadrant-wise count rates Data is divided into 100 sec bins |
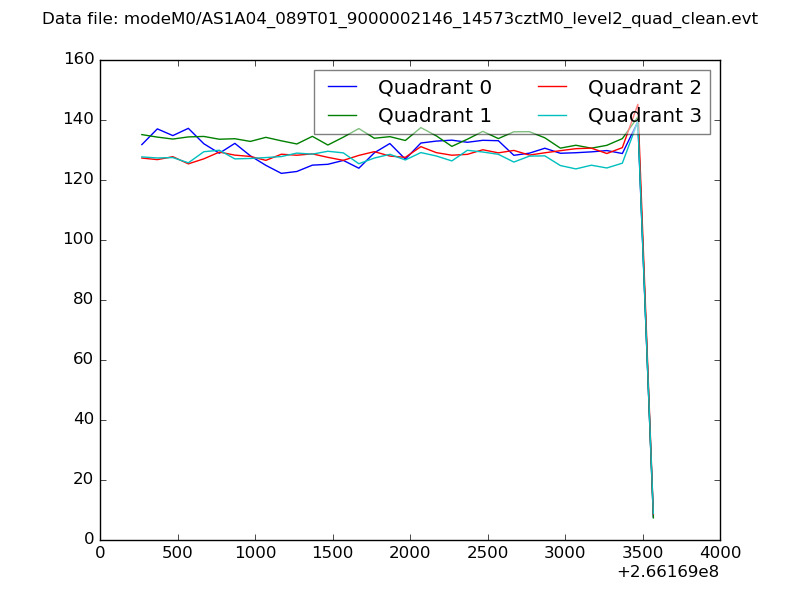 |
|
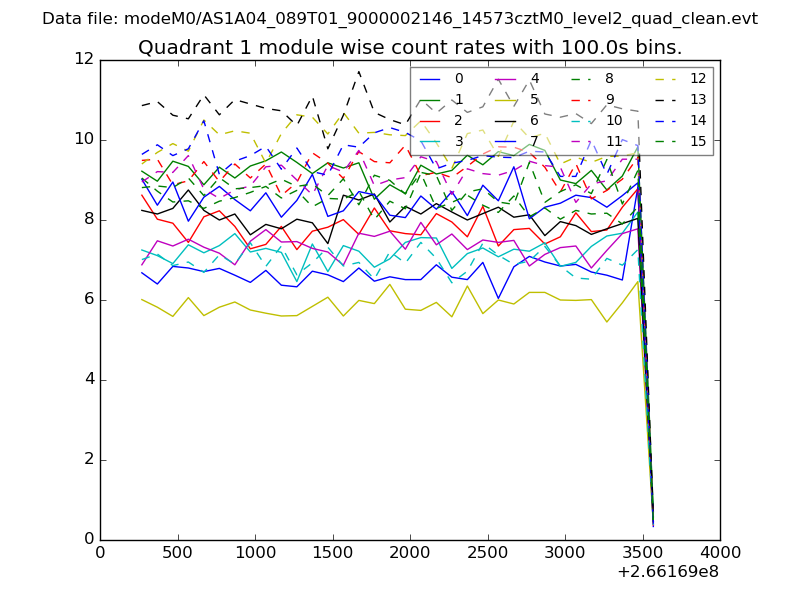
| Module-wise count rates for Quadrant A Data is divided into 100 sec bins |
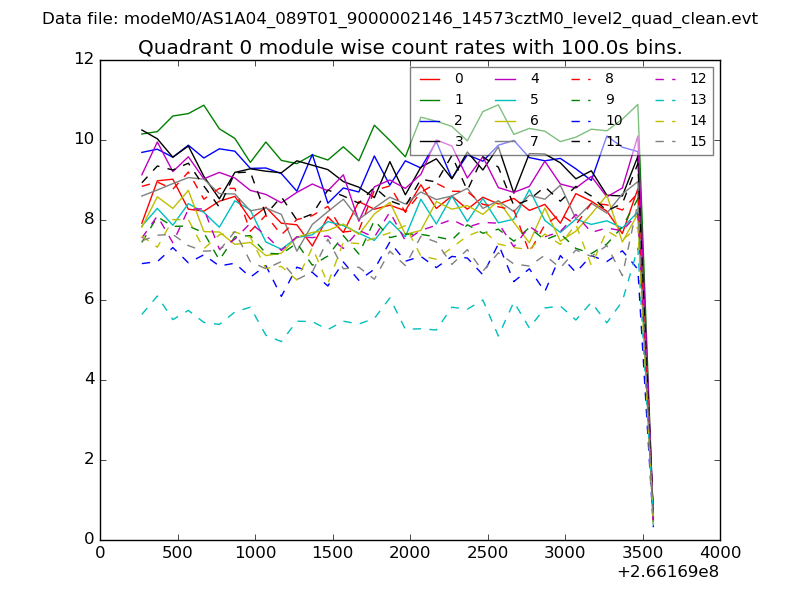 |
 |
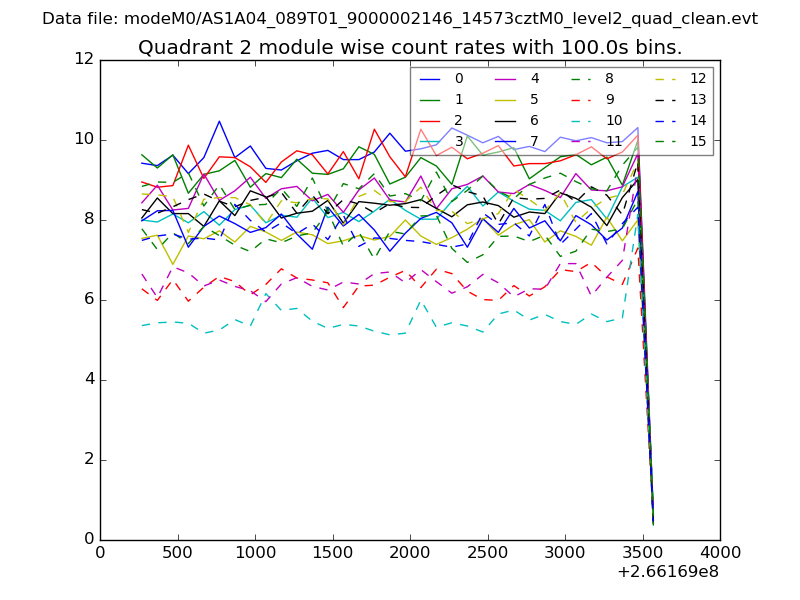
| Module-wise count rates for Quadrant B Data is divided into 100 sec bins |
 |
 |
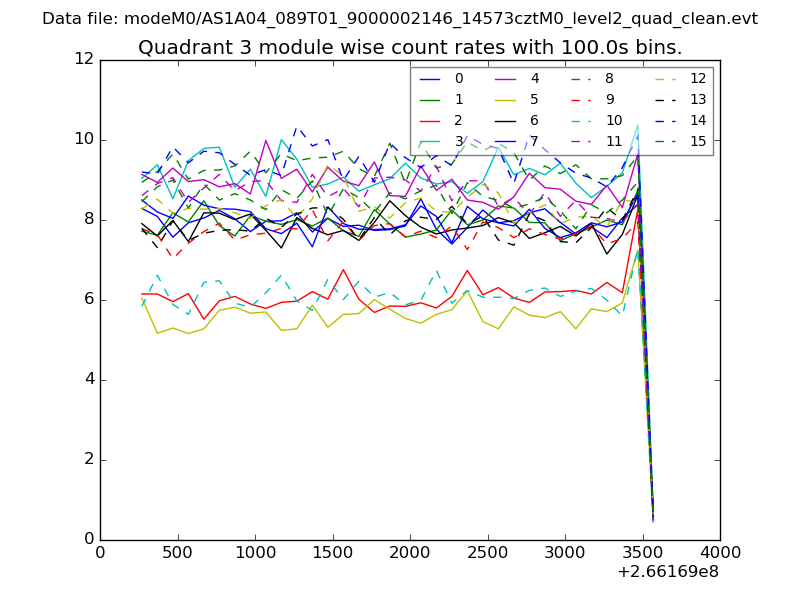
| Module-wise count rates for Quadrant C Data is divided into 100 sec bins |
 |
 |
| Module-wise count rates for Quadrant D Data is divided into 100 sec bins |
 |
 |
| Parameter | Plot |
|---|---|
| CZT HV Monitor | 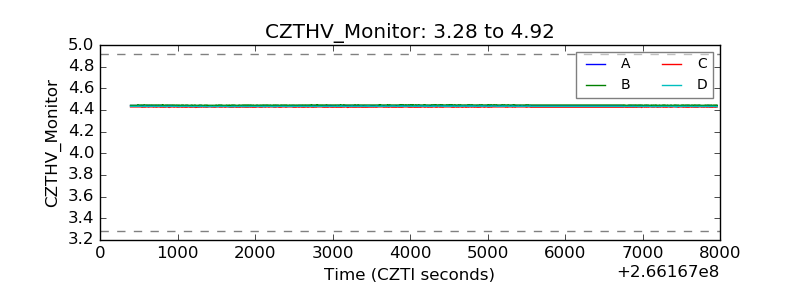 |
| D_VDD |  |
| Temperature 1 |  |
| Veto HV Monitor | 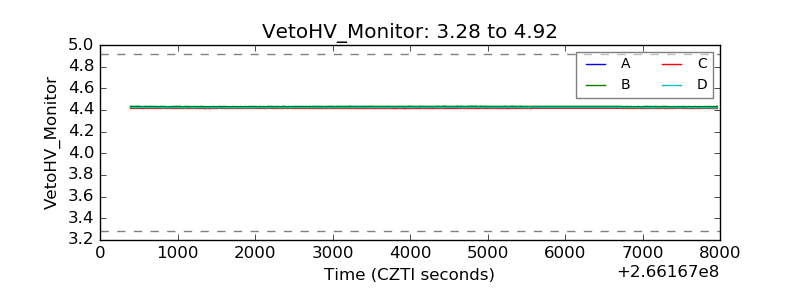 |
| Veto LLD |  |
| Alpha Counter | 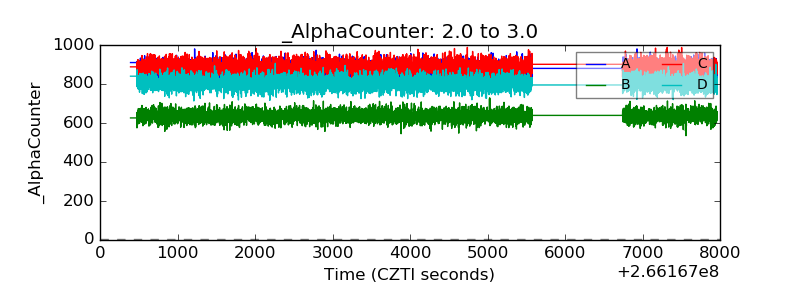 |
| _CPM_Rate | 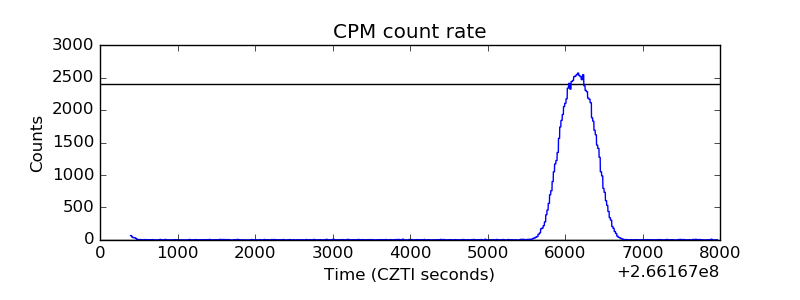 |
| CZT Counter | 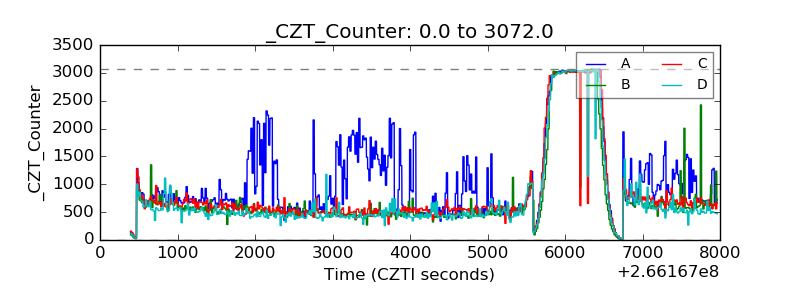 |
| +2.5 Volts monitor |  |
| +5 Volts monitor |  |
| _ROLL_ROT |  |
| _Roll_DEC | 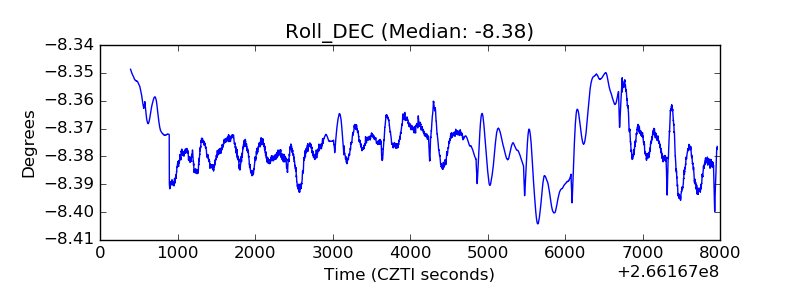 |
| _Roll_RA | 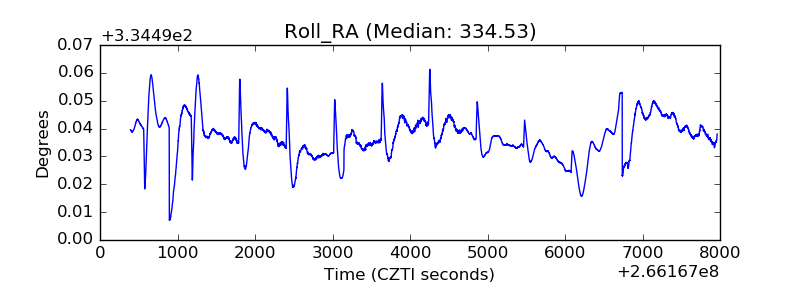 |
| Veto Counter | 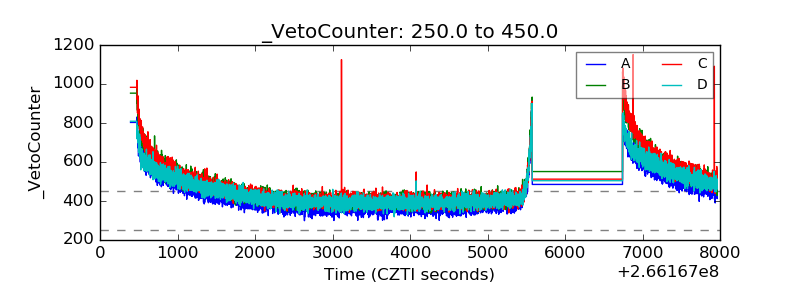 |