| Param | Original file | Final file |
|---|---|---|
| Filename | modeM0/AS1A04_089T01_9000002146_14576cztM0_level2.evt | modeM0/AS1A04_089T01_9000002146_14576cztM0_level2_quad_clean.evt |
| Size (bytes) | 584,075,520 | 101,828,160 |
| Size | 557.0 MB | 97.1 MB |
| Events in quadrant A | 6,128,066 | 658,269 |
| Events in quadrant B | 3,753,696 | 679,976 |
| Events in quadrant C | 4,051,694 | 664,773 |
| Events in quadrant D | 3,338,115 | 649,930 |
| Mode SS | |||
|---|---|---|---|
| Quadrant | BADHDUFLAG | Total packets | Discarded packets |
| A | 0 | 124 | 0 |
| B | 0 | 124 | 0 |
| C | 0 | 124 | 0 |
| D | 0 | 124 | 0 |
| Mode M9 | |||
|---|---|---|---|
| Quadrant | BADHDUFLAG | Total packets | Discarded packets |
| A | 0 | 18 | 0 |
| B | 0 | 18 | 0 |
| C | 0 | 18 | 0 |
| D | 0 | 19 | 0 |
| Mode M0 | |||
|---|---|---|---|
| Quadrant | BADHDUFLAG | Total packets | Discarded packets |
| A | 0 | 22694 | 3 |
| B | 0 | 15174 | 2 |
| C | 0 | 16901 | 2 |
| D | 0 | 13720 | 2 |
| Quadrant | Total seconds | Saturated seconds | Saturation percentage |
|---|---|---|---|
| A | 6178 | 189 | 3.059242% |
| B | 6178 | 194 | 3.140175% |
| C | 6178 | 61 | 0.987375% |
| D | 6178 | 86 | 1.392036% |
Noise dominated data is calculated using 1-second bins in cleaned event files. If a bin has >2000 counts, and if more than 50% of those come from <1% of pixels, then it is considered to be noise-dominated and hence unusable.
| Quadrant | # 1 sec bins | Bins with >0 counts | Bins with >2000 counts | High rate bins dominated by noise | Noise dominated (total time) | Noise dominated (detector-on time) | Marked lightcurve |
|---|---|---|---|---|---|---|---|
| A | 7499 | 6180 | 6 | 6 | 0.08% | 0.10% | 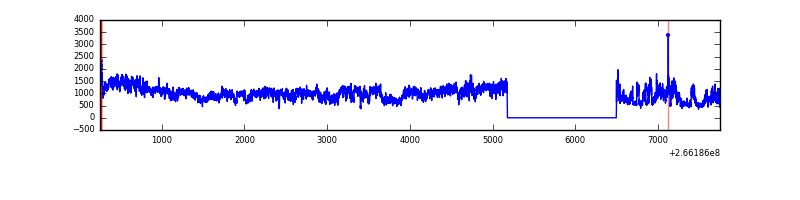 |
| B | 7499 | 6180 | 93 | 93 | 1.24% | 1.50% | 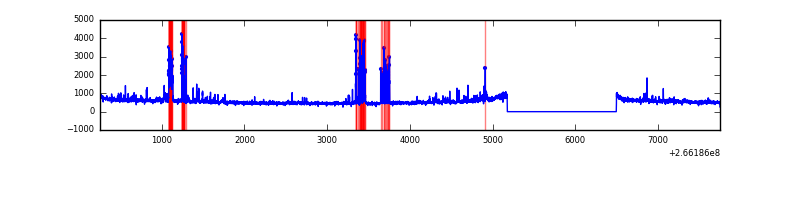 |
| C | 7499 | 6180 | 0 | 0 | 0.00% | 0.00% | 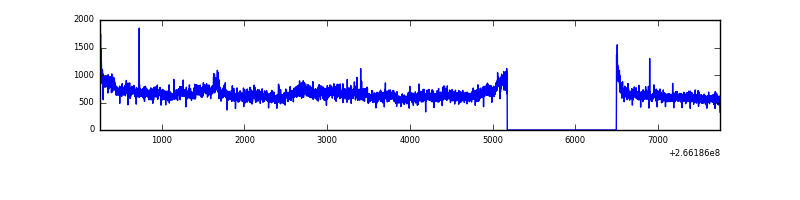 |
| D | 7499 | 6180 | 38 | 38 | 0.51% | 0.61% | 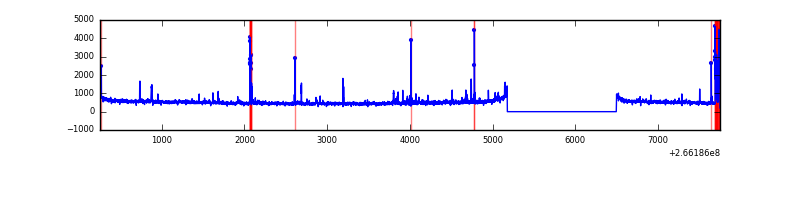 |
Top three noisy pixels from each quadrant. If the there are fewer than three noisy pixels in the level2.evt file, extra rows are filled as -1
| Pixel properties | Quadrant properties | ||||||
|---|---|---|---|---|---|---|---|
| Quadrant | DetID | PixID | Counts | Sigma | Mean | Median | Sigma |
| A | 0 | 23 | 2765952 | 17002.5 | 806 | 791 | 162.6 |
| A | 0 | 226 | 172655 | 1056.76 | 806 | 791 | 162.6 |
| A | 12 | 189 | 57269 | 347.27 | 806 | 791 | 162.6 |
| B | 10 | 16 | 397366 | 2603.03 | 816 | 800 | 152.3 |
| B | 0 | 189 | 62143 | 402.65 | 816 | 800 | 152.3 |
| B | 0 | 219 | 28462 | 181.57 | 816 | 800 | 152.3 |
| C | 3 | 233 | 909274 | 4934.02 | 803 | 811 | 184.1 |
| C | 13 | 61 | 5803 | 27.11 | 803 | 811 | 184.1 |
| C | 10 | 22 | 4824 | 21.8 | 803 | 811 | 184.1 |
| D | 10 | 199 | 151629 | 773.28 | 802 | 781 | 195.1 |
| D | 12 | 110 | 46553 | 234.64 | 802 | 781 | 195.1 |
| D | 2 | 152 | 45851 | 231.04 | 802 | 781 | 195.1 |
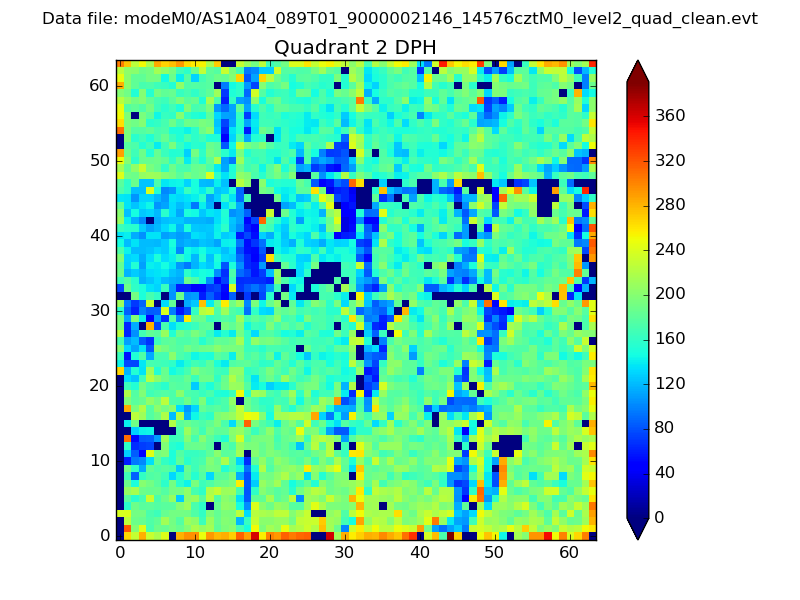
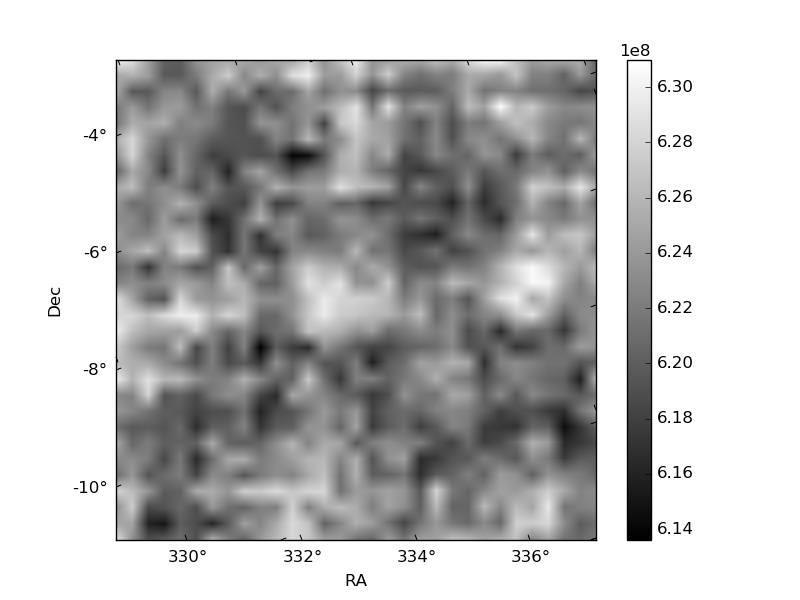
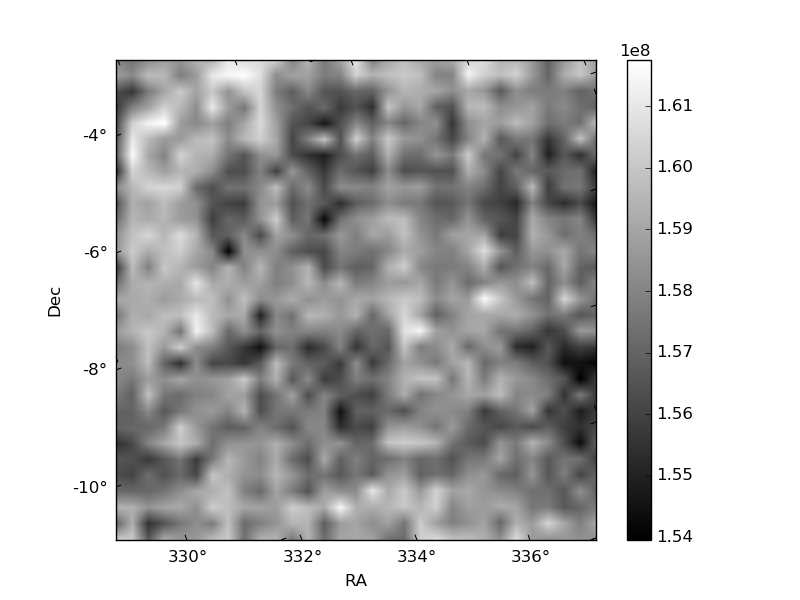
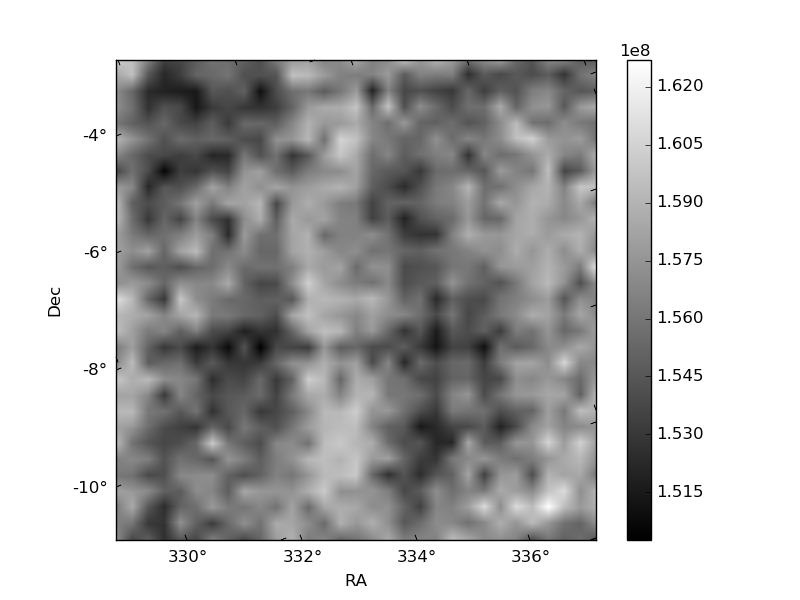
Histogram calculated using DETX and DETY for each event in the final _common_clean file
| Quadrant A | 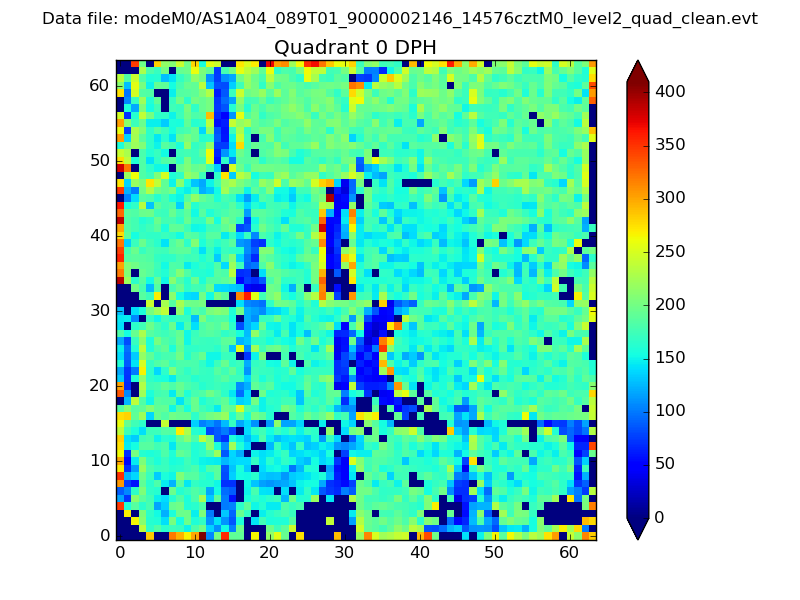 |
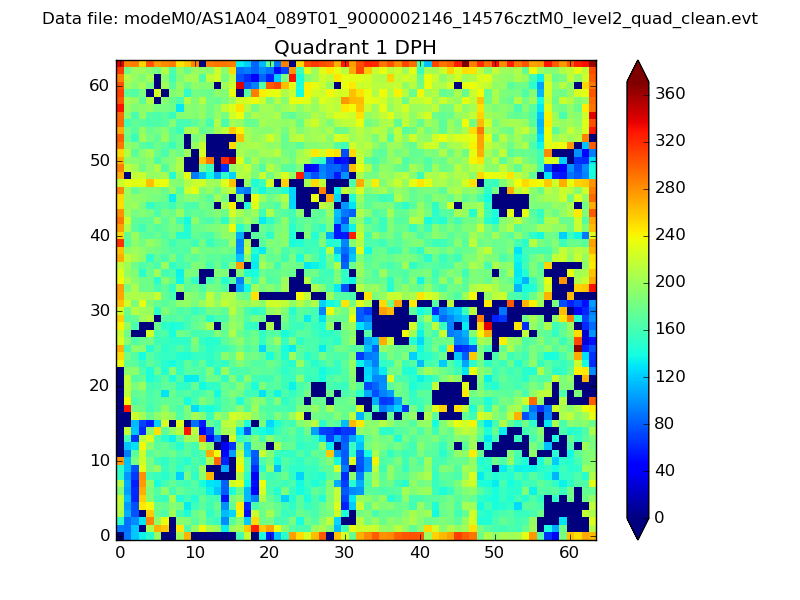 |
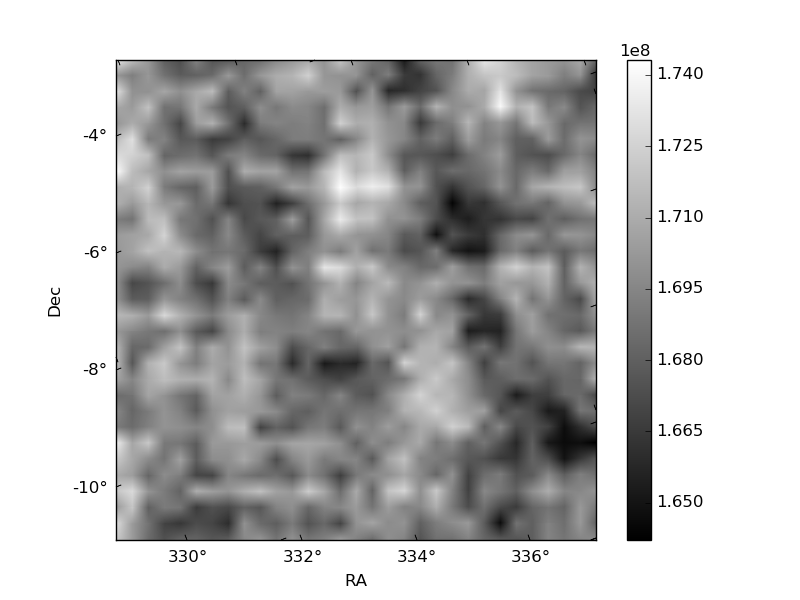
Quadrant B |
|---|---|---|---|
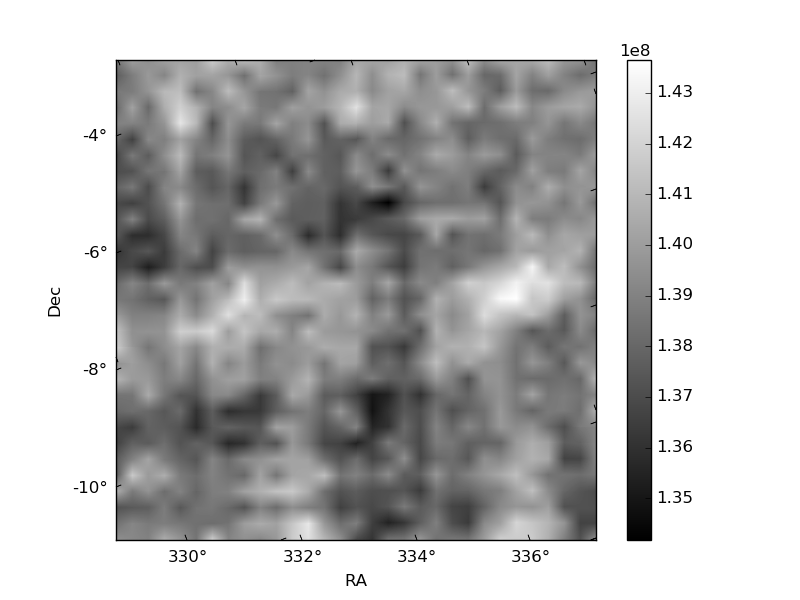
| Quadrant D | 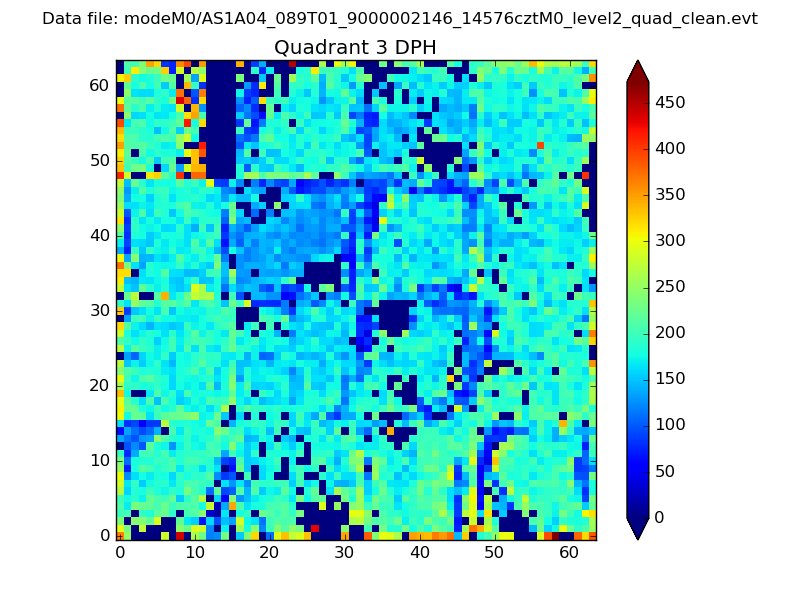 |
 |
Quadrant C |
| Plot type | Count rate plots | Images |
|---|---|---|
| Comparison with Poisson distribution Blue bars denote a histogram of data divided into 1 sec bins. Red curve is a Poisson curve with rate = median count rate of data. |
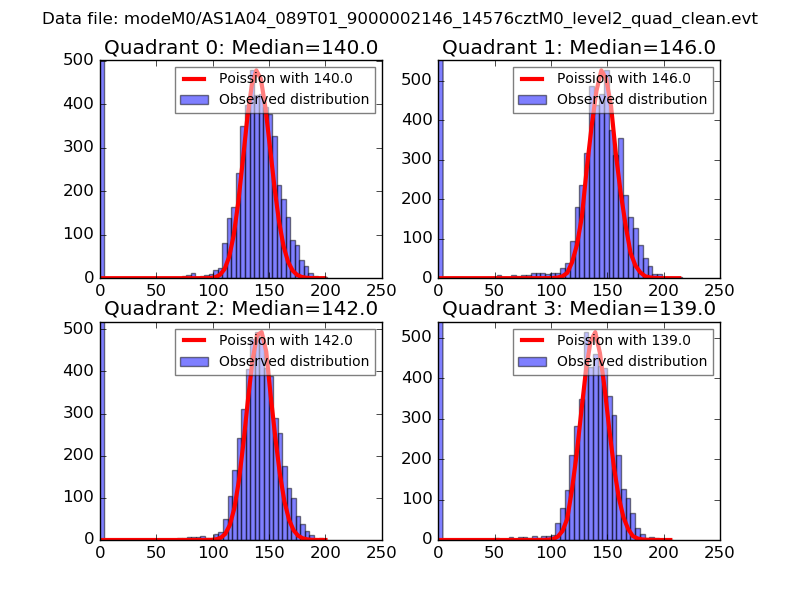 |
 |
| Quadrant-wise count rates Data is divided into 100 sec bins |
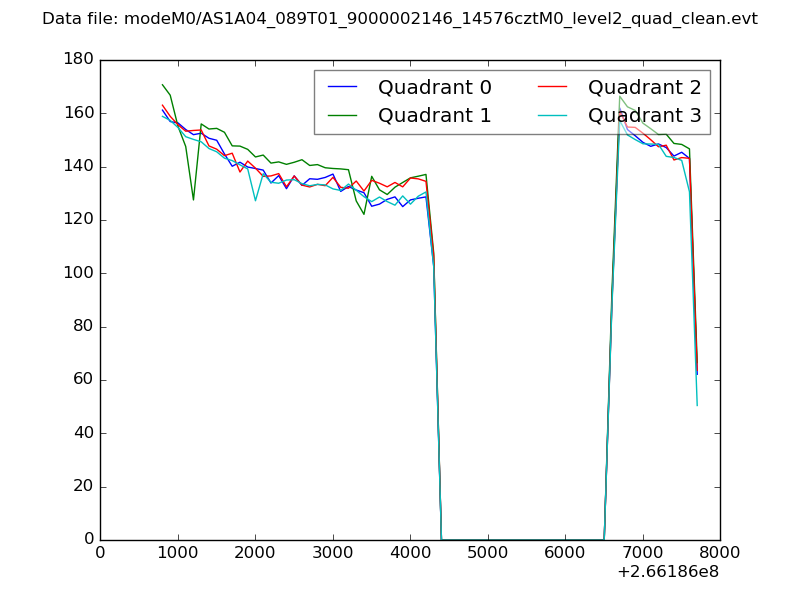 |
|
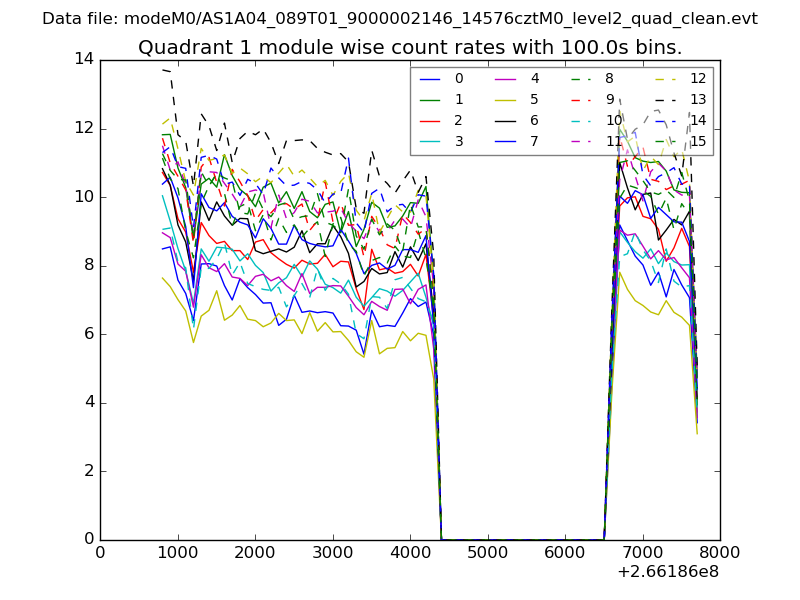
| Module-wise count rates for Quadrant A Data is divided into 100 sec bins |
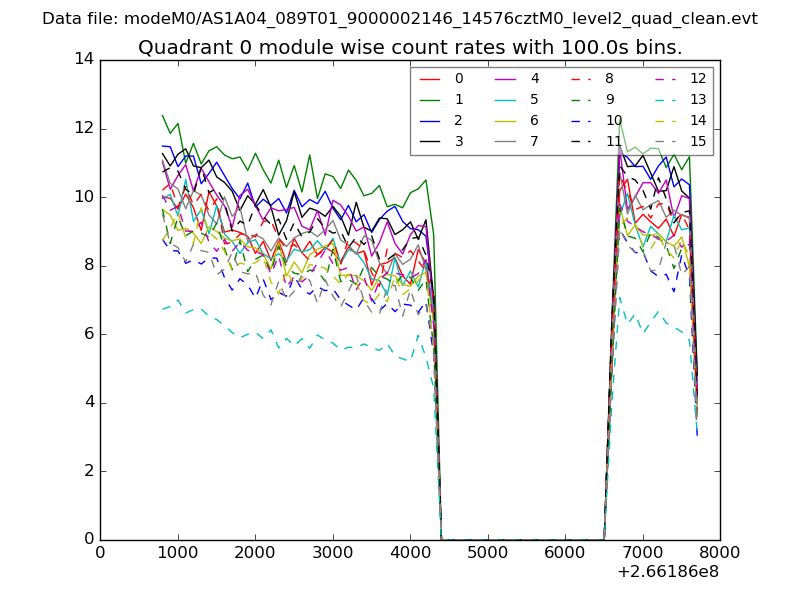 |
 |
| Module-wise count rates for Quadrant B Data is divided into 100 sec bins |
 |
 |
| Module-wise count rates for Quadrant C Data is divided into 100 sec bins |
 |
 |
| Module-wise count rates for Quadrant D Data is divided into 100 sec bins |
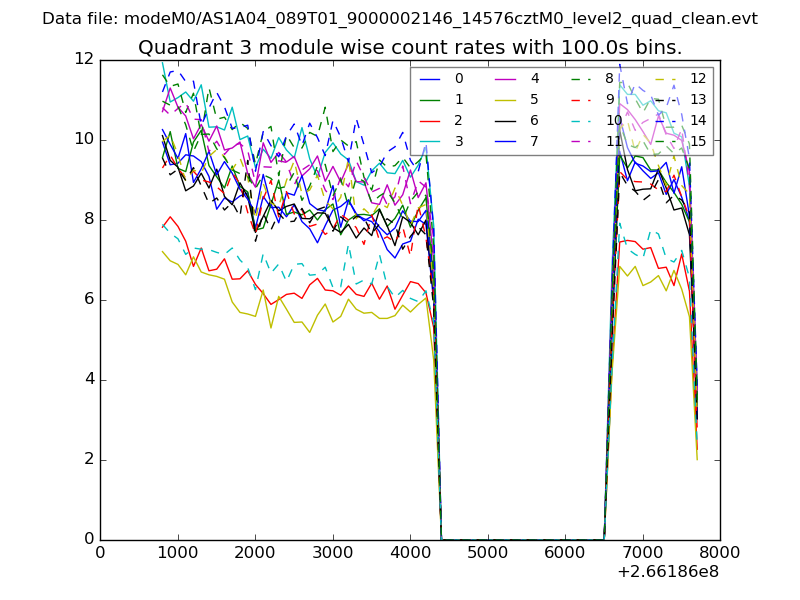 |
 |
| Parameter | Plot |
|---|---|
| CZT HV Monitor | 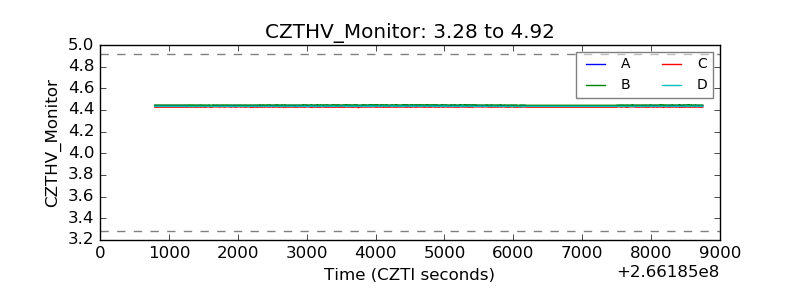 |
| D_VDD | 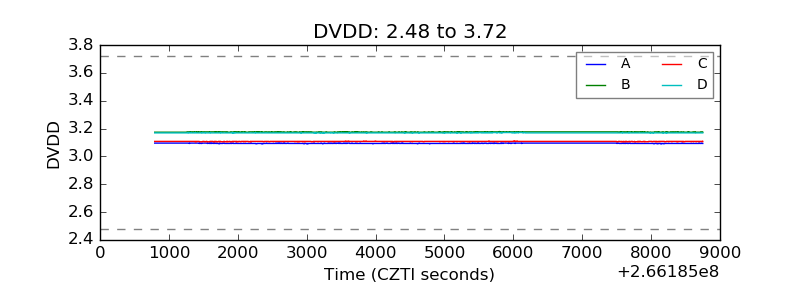 |
| Temperature 1 | 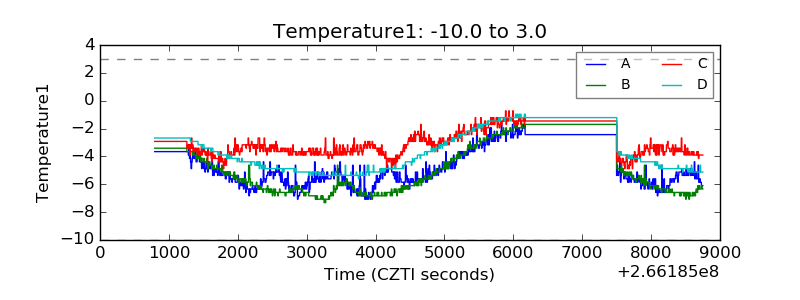 |
| Veto HV Monitor | 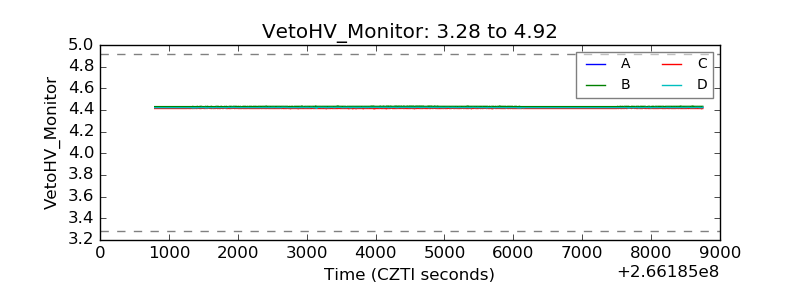 |
| Veto LLD | 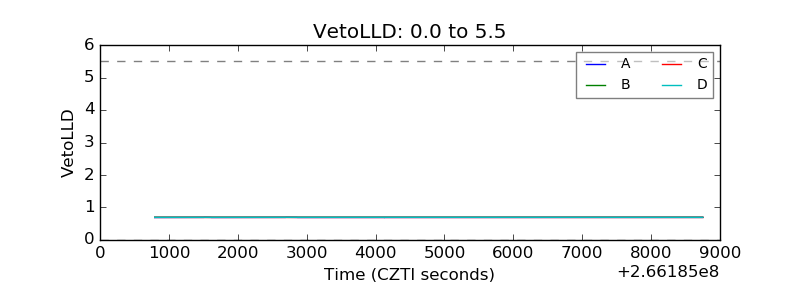 |
| Alpha Counter | 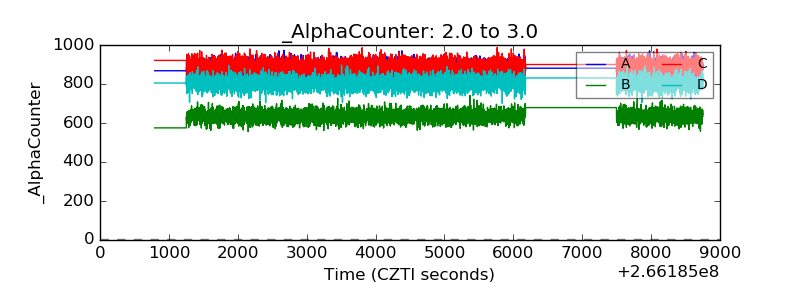 |
| _CPM_Rate |  |
| CZT Counter | 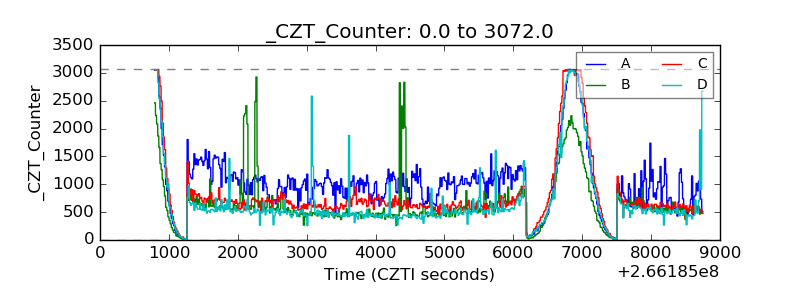 |
| +2.5 Volts monitor |  |
| +5 Volts monitor |  |
| _ROLL_ROT | 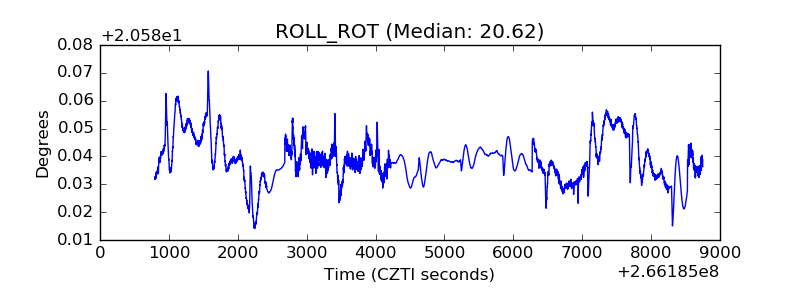 |
| _Roll_DEC | 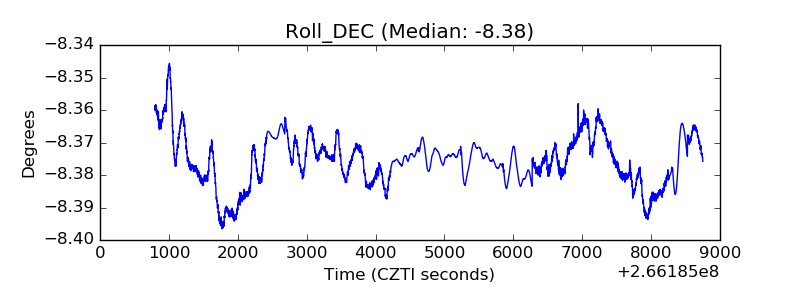 |
| _Roll_RA | 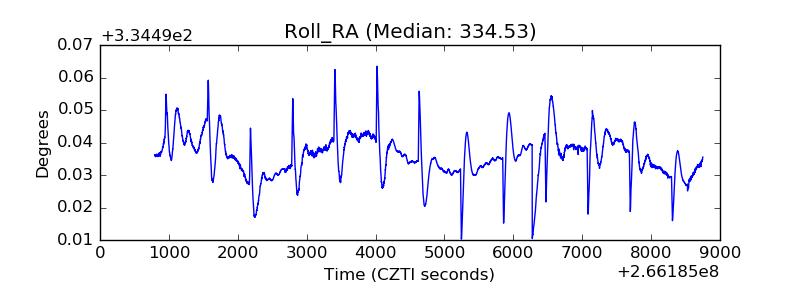 |
| Veto Counter | 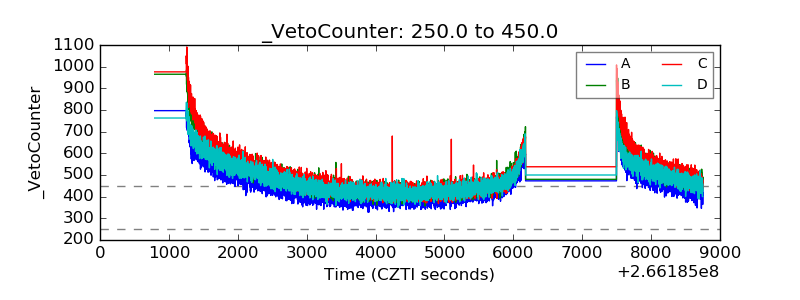 |