| Param | Original file | Final file |
|---|---|---|
| Filename | modeM0/AS1A04_089T01_9000002146_14577cztM0_level2.evt | modeM0/AS1A04_089T01_9000002146_14577cztM0_level2_quad_clean.evt |
| Size (bytes) | 582,759,360 | 101,859,840 |
| Size | 555.8 MB | 97.1 MB |
| Events in quadrant A | 5,988,514 | 653,329 |
| Events in quadrant B | 3,372,287 | 686,113 |
| Events in quadrant C | 3,751,083 | 666,535 |
| Events in quadrant D | 4,108,472 | 636,600 |
| Mode SS | |||
|---|---|---|---|
| Quadrant | BADHDUFLAG | Total packets | Discarded packets |
| A | 0 | 128 | 0 |
| B | 0 | 128 | 0 |
| C | 0 | 128 | 0 |
| D | 0 | 128 | 0 |
| Mode M9 | |||
|---|---|---|---|
| Quadrant | BADHDUFLAG | Total packets | Discarded packets |
| A | 0 | 18 | 0 |
| B | 0 | 18 | 0 |
| C | 0 | 18 | 0 |
| D | 0 | 19 | 0 |
| Mode M0 | |||
|---|---|---|---|
| Quadrant | BADHDUFLAG | Total packets | Discarded packets |
| A | 0 | 22447 | 3 |
| B | 0 | 14118 | 2 |
| C | 0 | 15061 | 2 |
| D | 0 | 16348 | 2 |
| Quadrant | Total seconds | Saturated seconds | Saturation percentage |
|---|---|---|---|
| A | 6339 | 199 | 3.139296% |
| B | 6339 | 79 | 1.246253% |
| C | 6339 | 54 | 0.851869% |
| D | 6339 | 280 | 4.417100% |
Noise dominated data is calculated using 1-second bins in cleaned event files. If a bin has >2000 counts, and if more than 50% of those come from <1% of pixels, then it is considered to be noise-dominated and hence unusable.
| Quadrant | # 1 sec bins | Bins with >0 counts | Bins with >2000 counts | High rate bins dominated by noise | Noise dominated (total time) | Noise dominated (detector-on time) | Marked lightcurve |
|---|---|---|---|---|---|---|---|
| A | 7505 | 6341 | 15 | 15 | 0.20% | 0.24% | 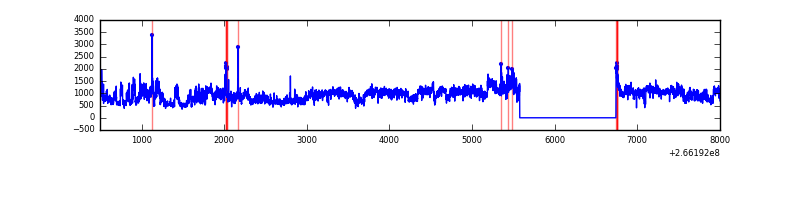 |
| B | 7505 | 6341 | 7 | 7 | 0.09% | 0.11% | 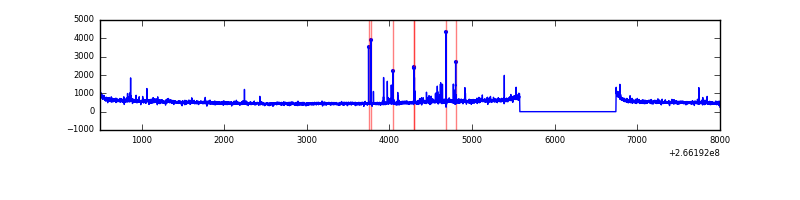 |
| C | 7505 | 6341 | 0 | 0 | 0.00% | 0.00% | 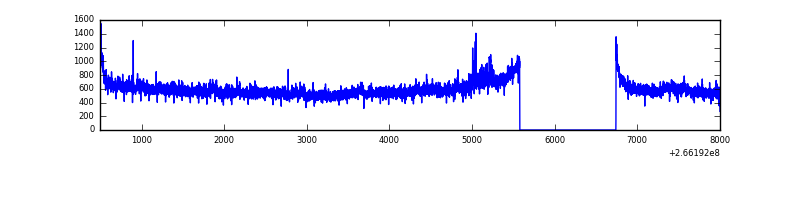 |
| D | 7505 | 6341 | 246 | 246 | 3.28% | 3.88% | 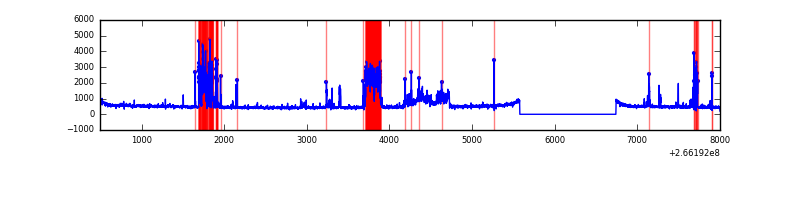 |
Top three noisy pixels from each quadrant. If the there are fewer than three noisy pixels in the level2.evt file, extra rows are filled as -1
| Pixel properties | Quadrant properties | ||||||
|---|---|---|---|---|---|---|---|
| Quadrant | DetID | PixID | Counts | Sigma | Mean | Median | Sigma |
| A | 0 | 23 | 2457830 | 15206.75 | 797 | 782 | 161.6 |
| A | 8 | 15 | 173794 | 1070.78 | 797 | 782 | 161.6 |
| A | 0 | 226 | 152618 | 939.72 | 797 | 782 | 161.6 |
| B | 0 | 219 | 50819 | 319.98 | 814 | 795 | 156.3 |
| B | 10 | 16 | 37255 | 233.22 | 814 | 795 | 156.3 |
| B | 4 | 48 | 22879 | 141.26 | 814 | 795 | 156.3 |
| C | 3 | 233 | 600945 | 3248.59 | 796 | 802 | 184.7 |
| C | 14 | 220 | 40954 | 217.34 | 796 | 802 | 184.7 |
| C | 13 | 61 | 5702 | 26.52 | 796 | 802 | 184.7 |
| D | 10 | 199 | 785596 | 4115.77 | 787 | 766 | 190.7 |
| D | 12 | 110 | 275608 | 1441.31 | 787 | 766 | 190.7 |
| D | 2 | 152 | 23291 | 118.12 | 787 | 766 | 190.7 |
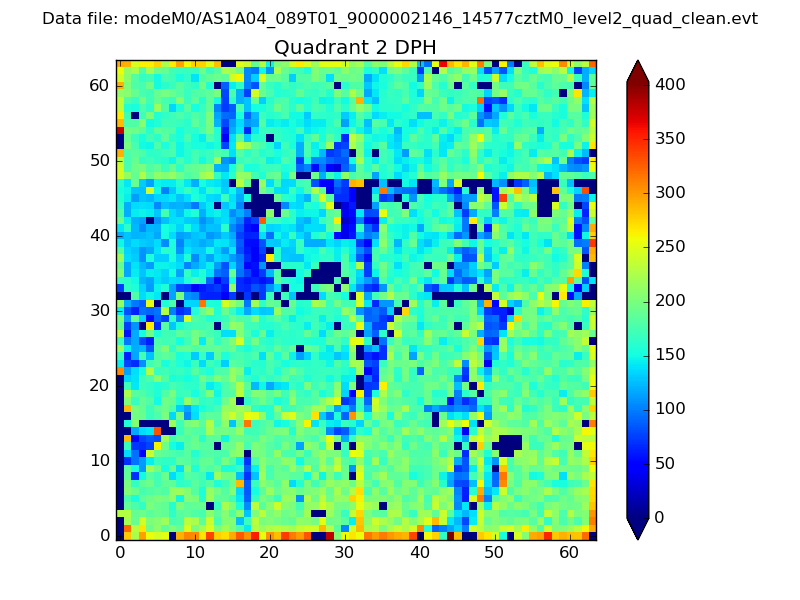
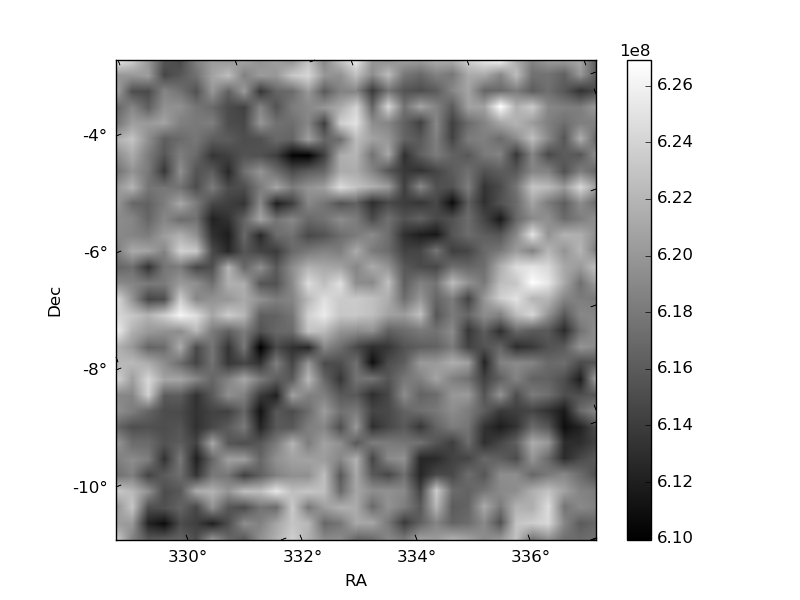
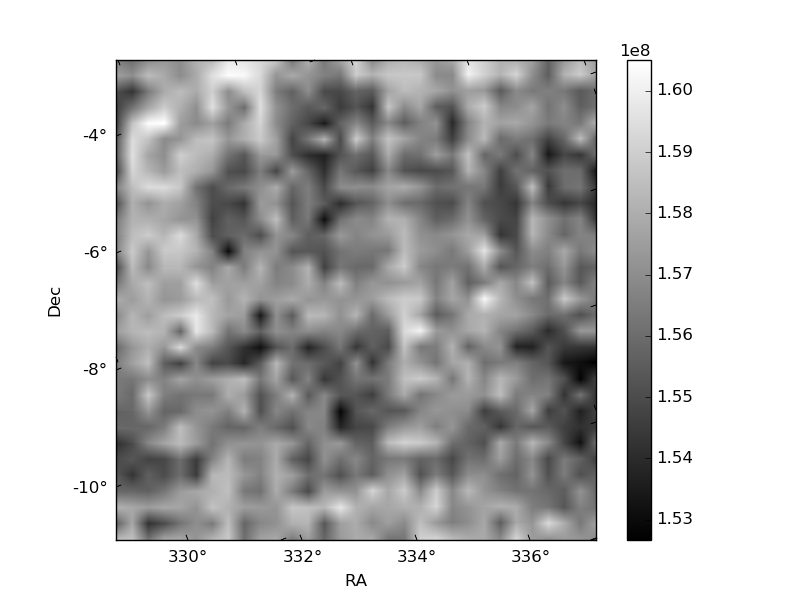
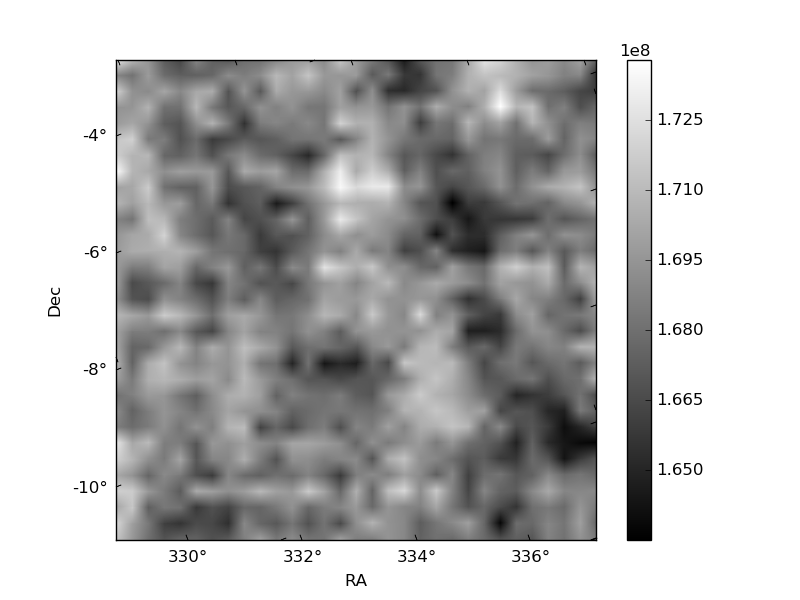
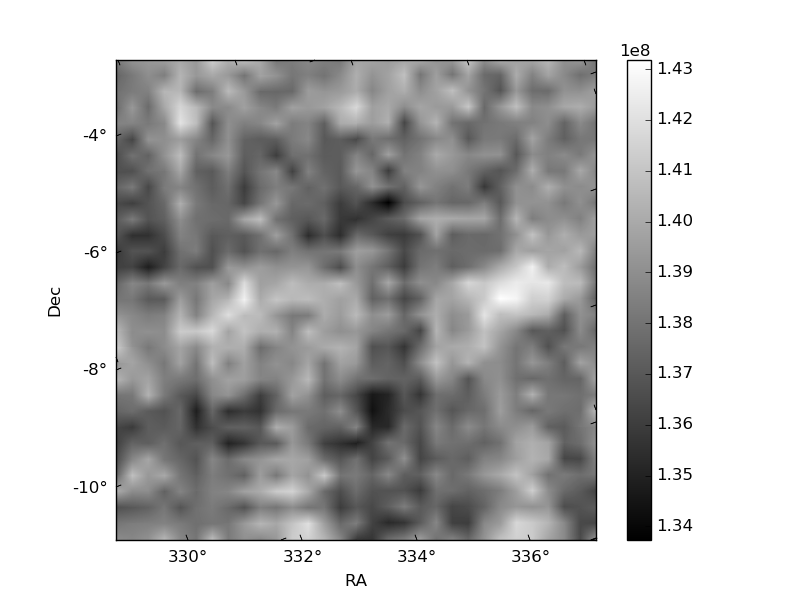
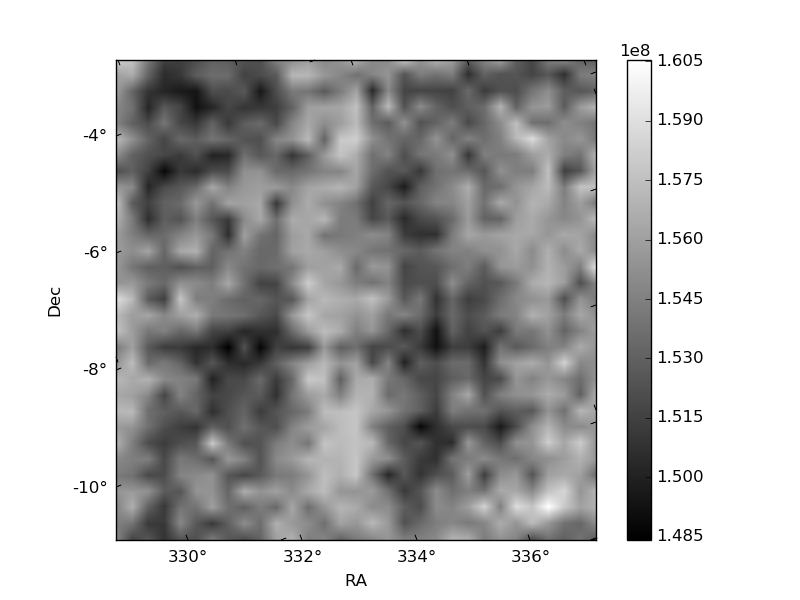
Histogram calculated using DETX and DETY for each event in the final _common_clean file
| Quadrant A | 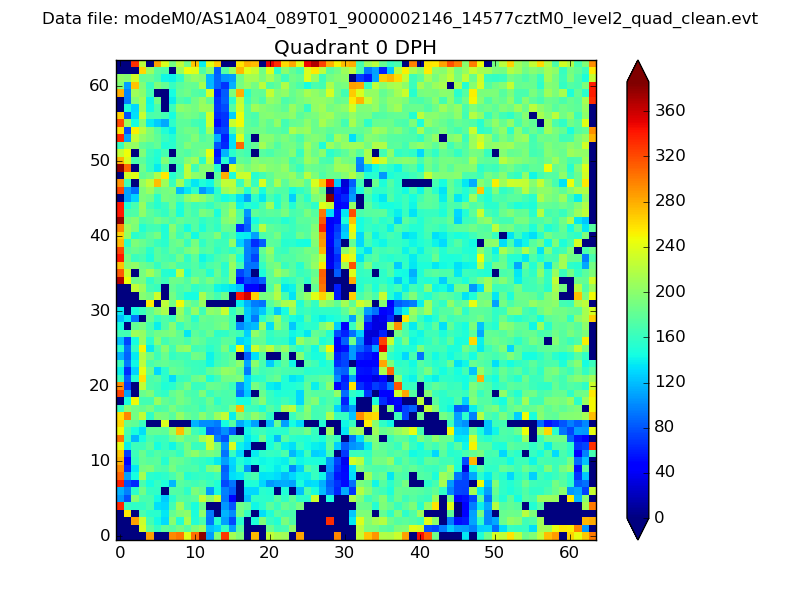 |
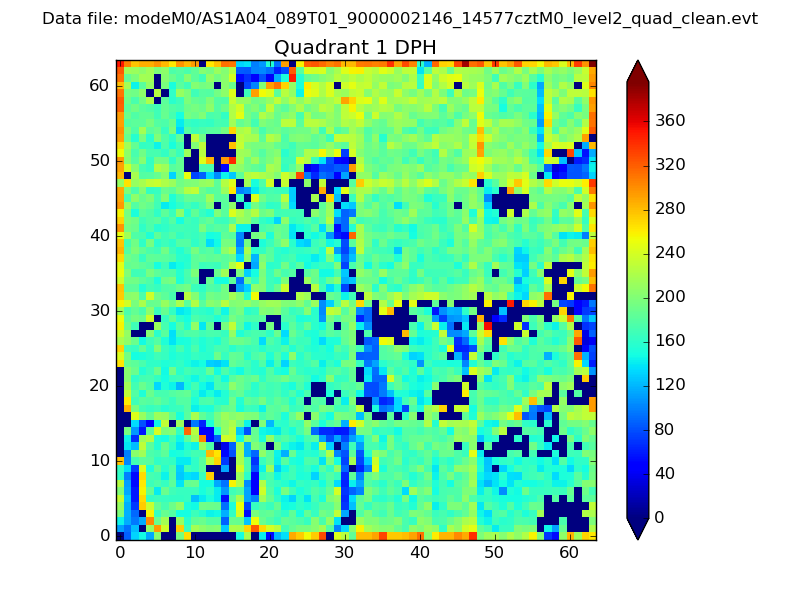 |
Quadrant B |
|---|---|---|---|
| Quadrant D | 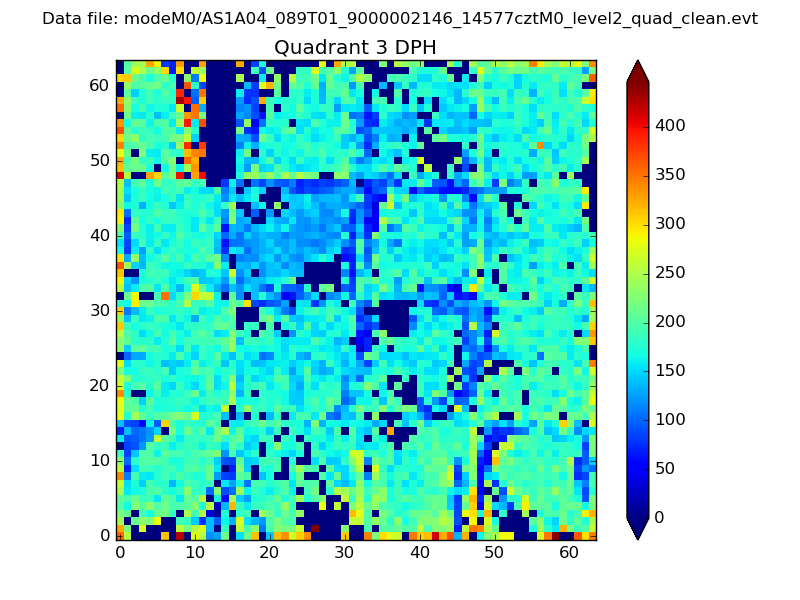 |
 |
Quadrant C |
| Plot type | Count rate plots | Images |
|---|---|---|
| Comparison with Poisson distribution Blue bars denote a histogram of data divided into 1 sec bins. Red curve is a Poisson curve with rate = median count rate of data. |
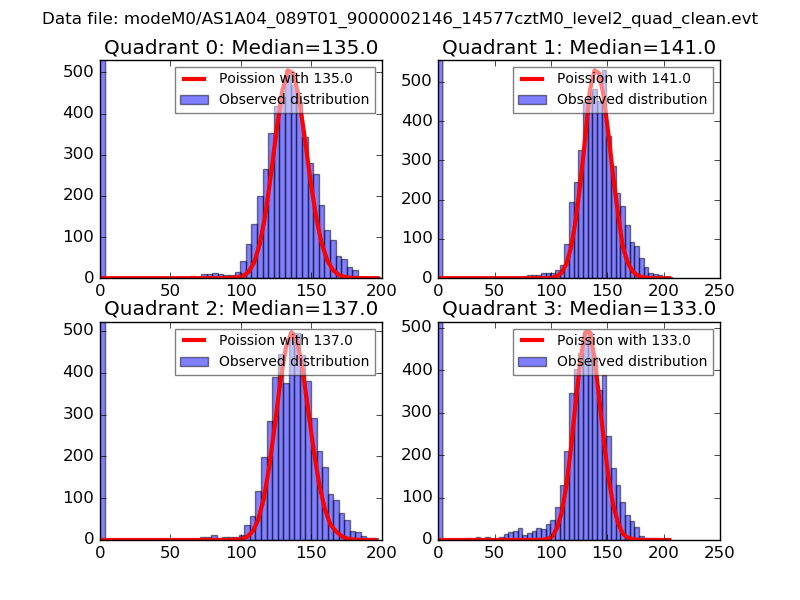 |
 |
| Quadrant-wise count rates Data is divided into 100 sec bins |
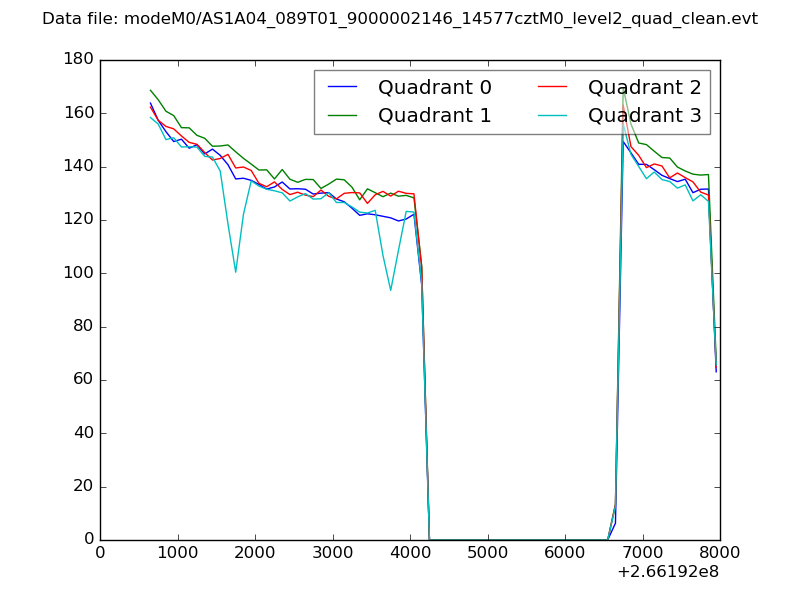 |
|
| Module-wise count rates for Quadrant A Data is divided into 100 sec bins |
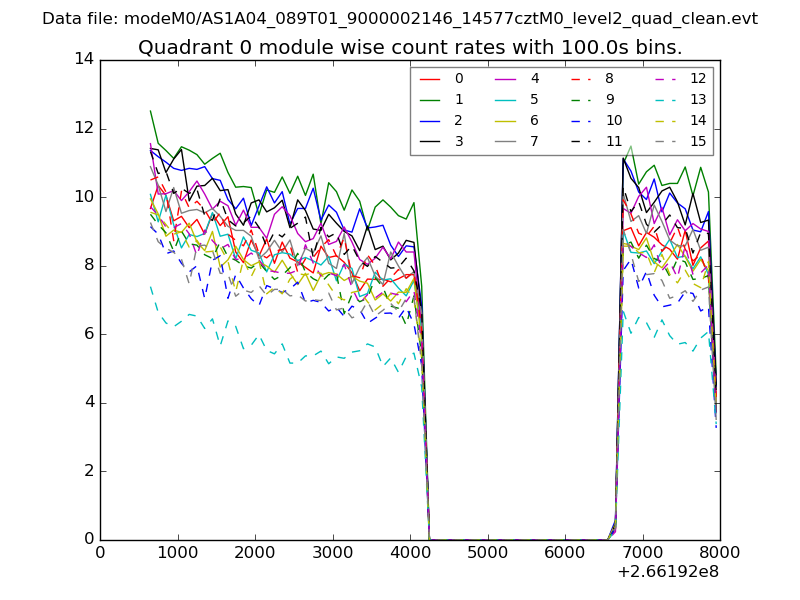 |
 |
| Module-wise count rates for Quadrant B Data is divided into 100 sec bins |
 |
 |
| Module-wise count rates for Quadrant C Data is divided into 100 sec bins |
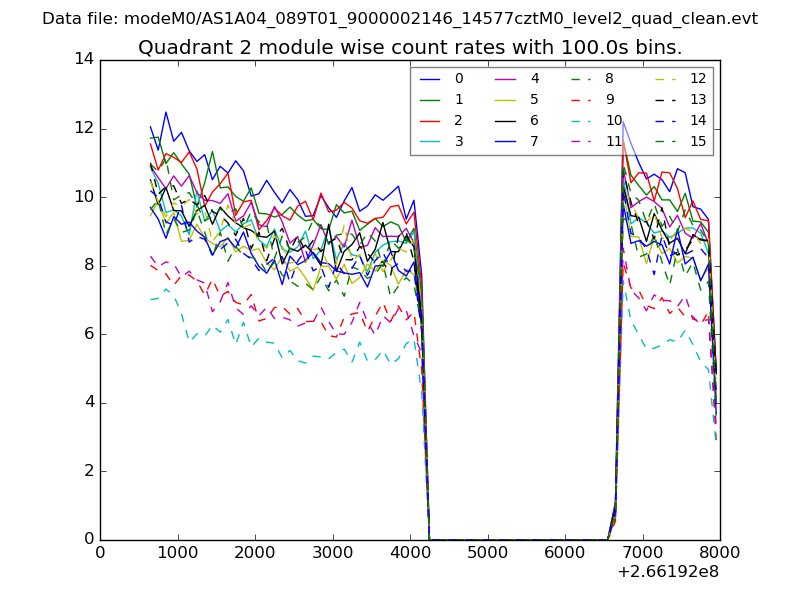 |
 |
| Module-wise count rates for Quadrant D Data is divided into 100 sec bins |
 |
 |
| Parameter | Plot |
|---|---|
| CZT HV Monitor | 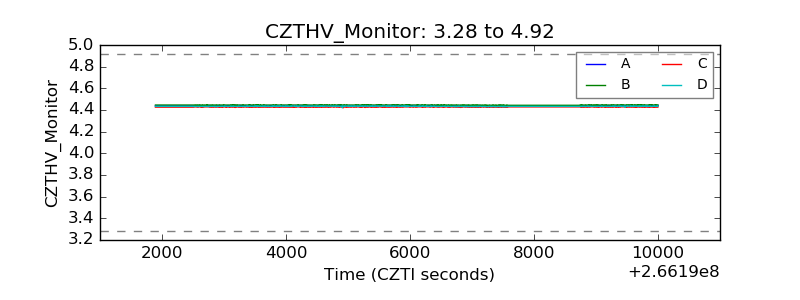 |
| D_VDD | 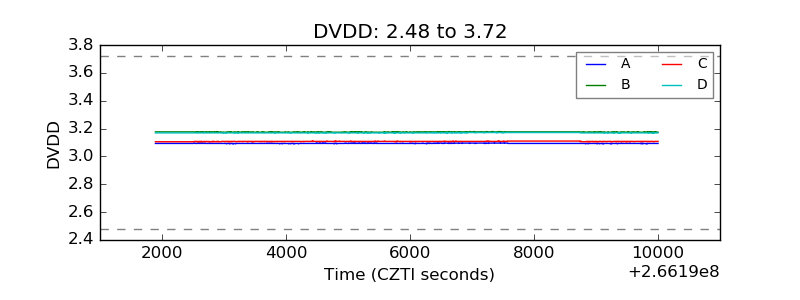 |
| Temperature 1 |  |
| Veto HV Monitor | 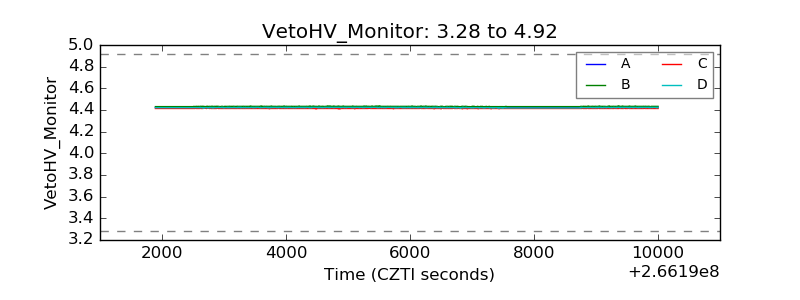 |
| Veto LLD | 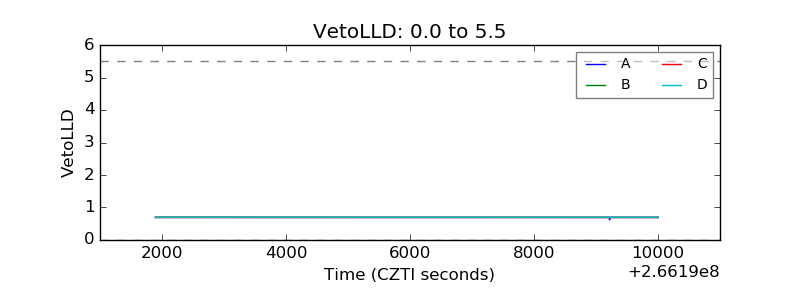 |
| Alpha Counter | 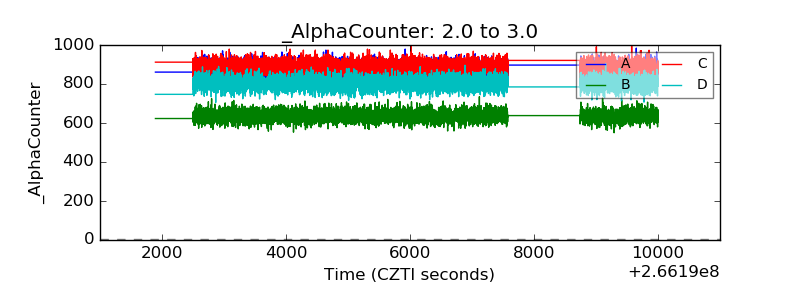 |
| _CPM_Rate | 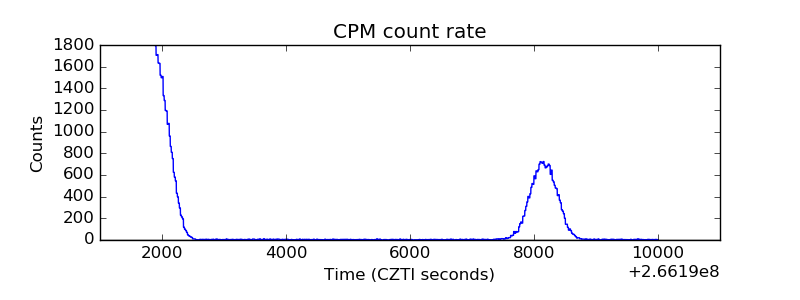 |
| CZT Counter | 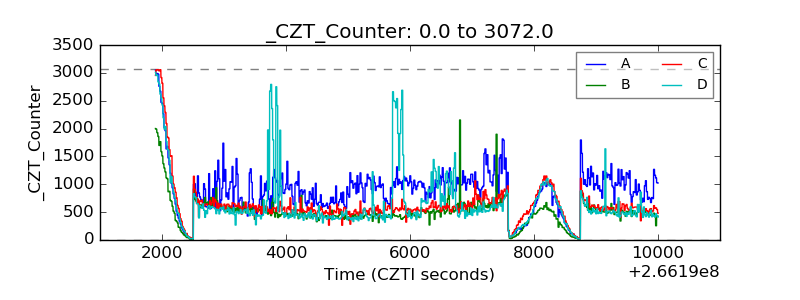 |
| +2.5 Volts monitor |  |
| +5 Volts monitor |  |
| _ROLL_ROT | 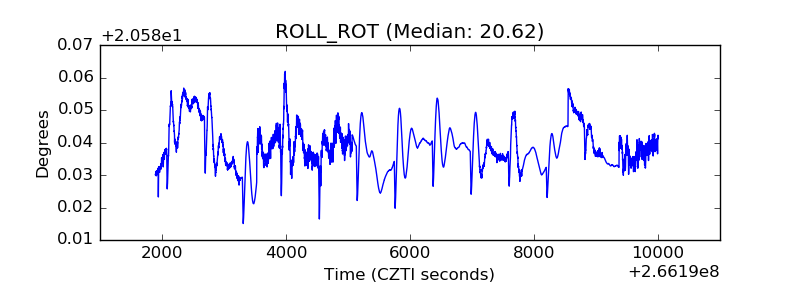 |
| _Roll_DEC | 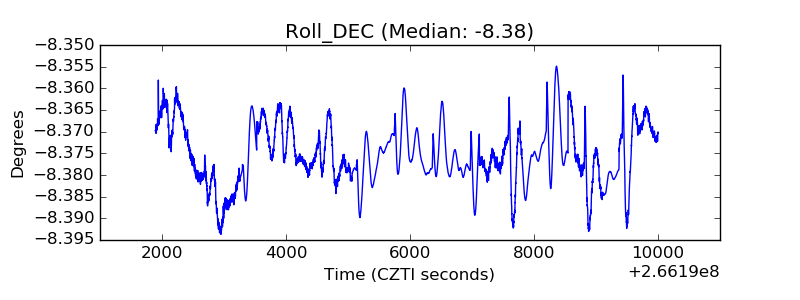 |
| _Roll_RA | 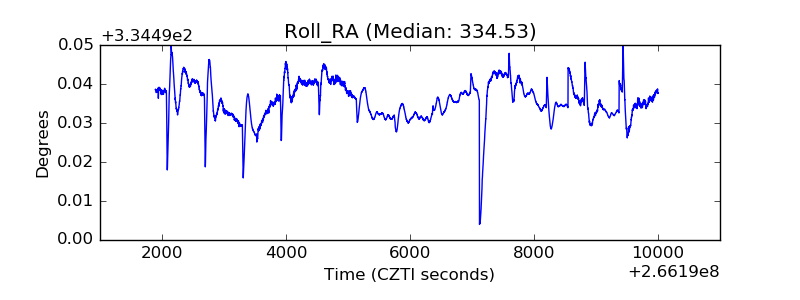 |
| Veto Counter | 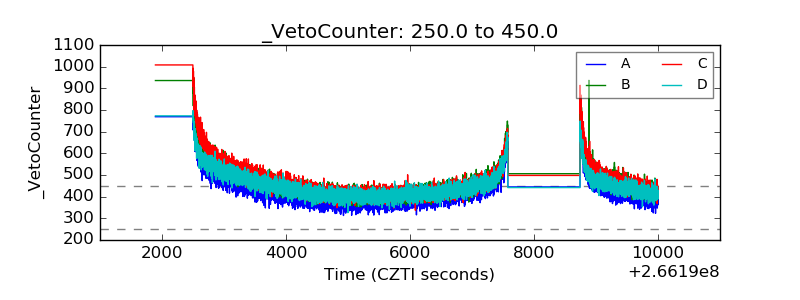 |