| Param | Original file | Final file |
|---|---|---|
| Filename | modeM0/AS1A04_089T01_9000002146_14578cztM0_level2.evt | modeM0/AS1A04_089T01_9000002146_14578cztM0_level2_quad_clean.evt |
| Size (bytes) | 582,811,200 | 93,856,320 |
| Size | 555.8 MB | 89.5 MB |
| Events in quadrant A | 5,681,193 | 589,203 |
| Events in quadrant B | 3,435,802 | 617,443 |
| Events in quadrant C | 4,452,226 | 595,269 |
| Events in quadrant D | 3,634,362 | 579,807 |
| Mode SS | |||
|---|---|---|---|
| Quadrant | BADHDUFLAG | Total packets | Discarded packets |
| A | 0 | 136 | 0 |
| B | 0 | 136 | 0 |
| C | 0 | 136 | 0 |
| D | 0 | 136 | 0 |
| Mode M9 | |||
|---|---|---|---|
| Quadrant | BADHDUFLAG | Total packets | Discarded packets |
| A | 0 | 21 | 0 |
| B | 0 | 21 | 0 |
| C | 0 | 21 | 0 |
| D | 0 | 21 | 0 |
| Mode M0 | |||
|---|---|---|---|
| Quadrant | BADHDUFLAG | Total packets | Discarded packets |
| A | 0 | 21666 | 3 |
| B | 0 | 14552 | 2 |
| C | 0 | 17832 | 2 |
| D | 0 | 15235 | 2 |
| Quadrant | Total seconds | Saturated seconds | Saturation percentage |
|---|---|---|---|
| A | 6607 | 116 | 1.755714% |
| B | 6607 | 76 | 1.150295% |
| C | 6607 | 70 | 1.059482% |
| D | 6607 | 121 | 1.831391% |
Noise dominated data is calculated using 1-second bins in cleaned event files. If a bin has >2000 counts, and if more than 50% of those come from <1% of pixels, then it is considered to be noise-dominated and hence unusable.
| Quadrant | # 1 sec bins | Bins with >0 counts | Bins with >2000 counts | High rate bins dominated by noise | Noise dominated (total time) | Noise dominated (detector-on time) | Marked lightcurve |
|---|---|---|---|---|---|---|---|
| A | 8683 | 6610 | 19 | 19 | 0.22% | 0.29% | 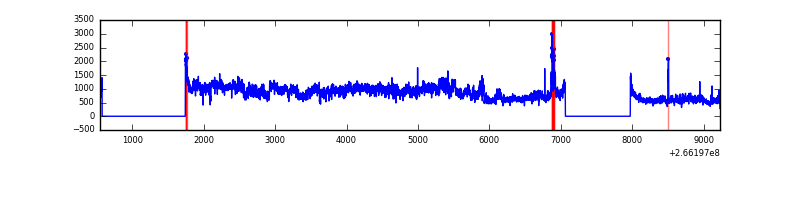 |
| B | 8683 | 6610 | 7 | 7 | 0.08% | 0.11% | 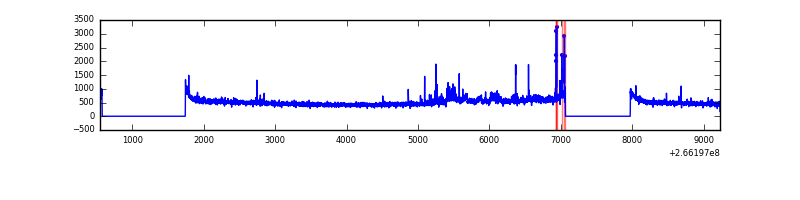 |
| C | 8683 | 6610 | 0 | 0 | 0.00% | 0.00% | 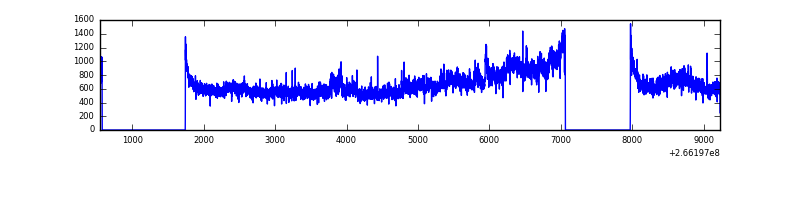 |
| D | 8683 | 6610 | 92 | 92 | 1.06% | 1.39% | 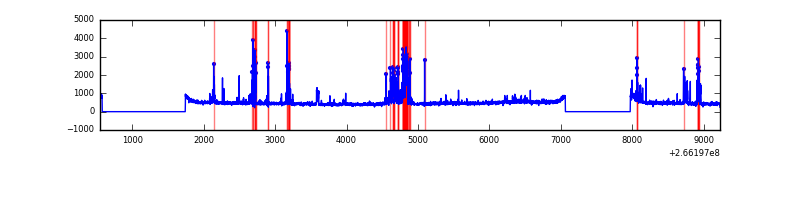 |
Top three noisy pixels from each quadrant. If the there are fewer than three noisy pixels in the level2.evt file, extra rows are filled as -1
| Pixel properties | Quadrant properties | ||||||
|---|---|---|---|---|---|---|---|
| Quadrant | DetID | PixID | Counts | Sigma | Mean | Median | Sigma |
| A | 0 | 23 | 1965640 | 11896.48 | 811 | 793 | 165.2 |
| A | 8 | 15 | 403400 | 2437.65 | 811 | 793 | 165.2 |
| A | 0 | 226 | 122883 | 739.21 | 811 | 793 | 165.2 |
| B | 0 | 189 | 47801 | 298.87 | 822 | 801 | 157.3 |
| B | 10 | 16 | 43591 | 272.1 | 822 | 801 | 157.3 |
| B | 0 | 219 | 35750 | 222.24 | 822 | 801 | 157.3 |
| C | 3 | 233 | 1320619 | 7089.99 | 799 | 807 | 186.2 |
| C | 3 | 232 | 7808 | 37.61 | 799 | 807 | 186.2 |
| C | 13 | 61 | 5747 | 26.54 | 799 | 807 | 186.2 |
| D | 10 | 199 | 495933 | 2532.82 | 800 | 778 | 195.5 |
| D | 13 | 122 | 33650 | 168.15 | 800 | 778 | 195.5 |
| D | 2 | 14 | 31110 | 155.15 | 800 | 778 | 195.5 |
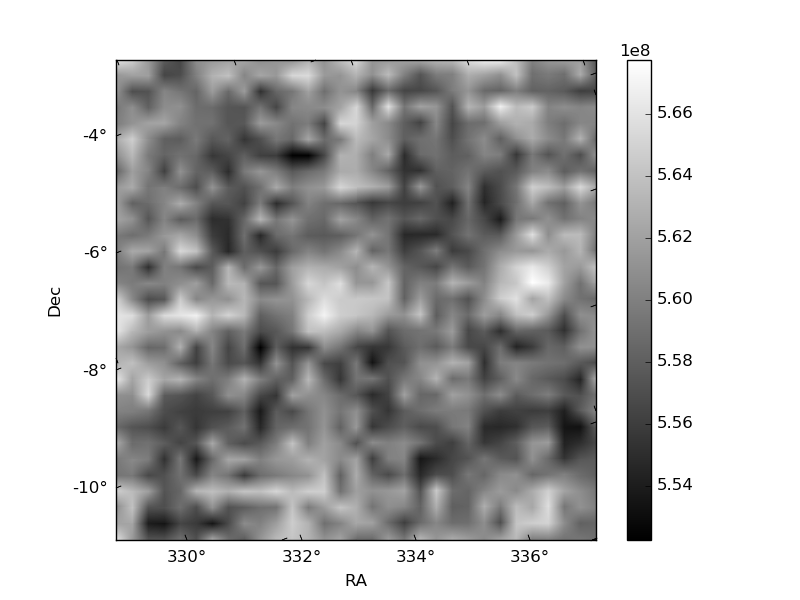
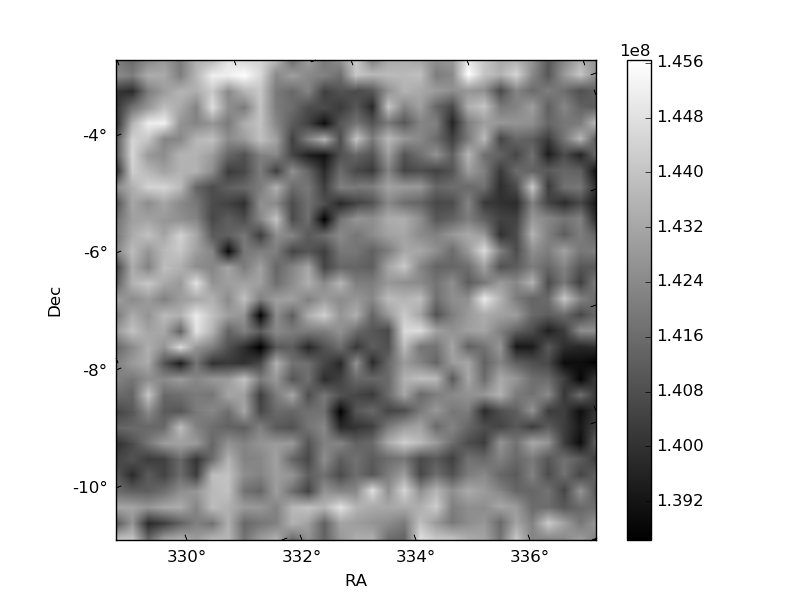
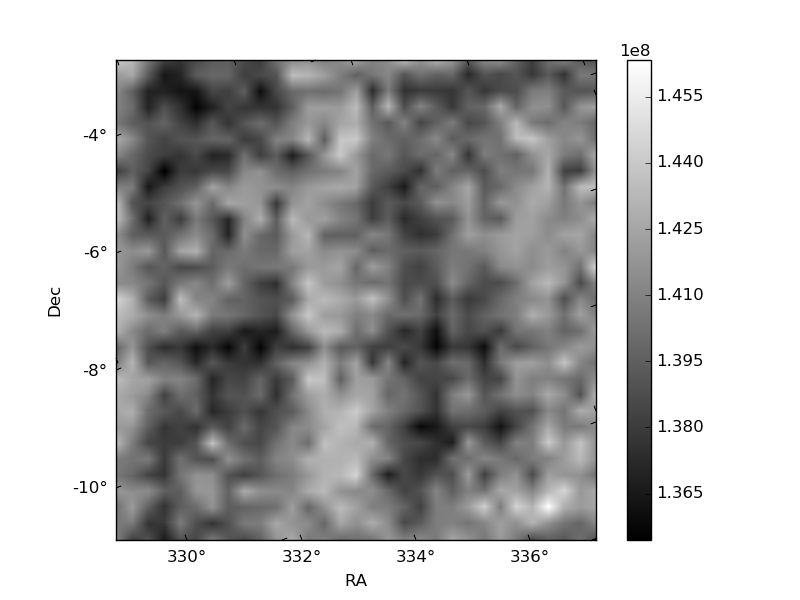
Histogram calculated using DETX and DETY for each event in the final _common_clean file
| Quadrant A | 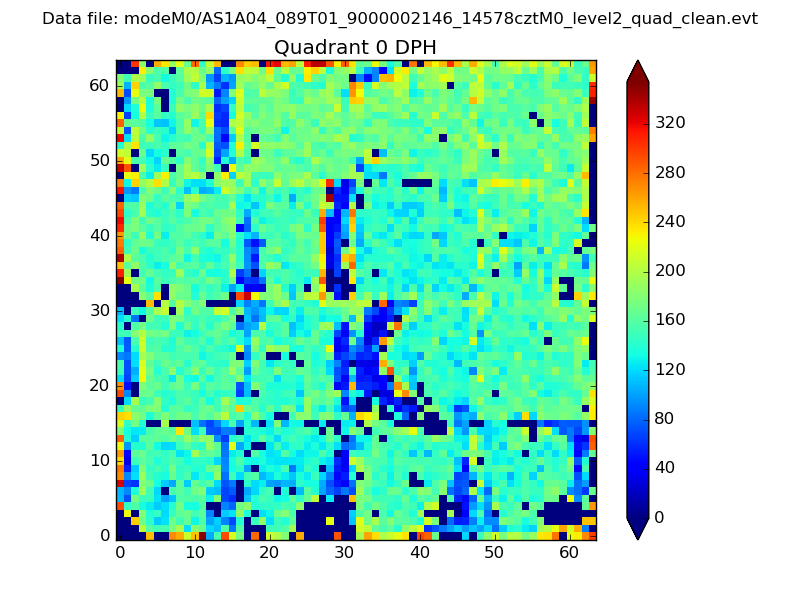 |
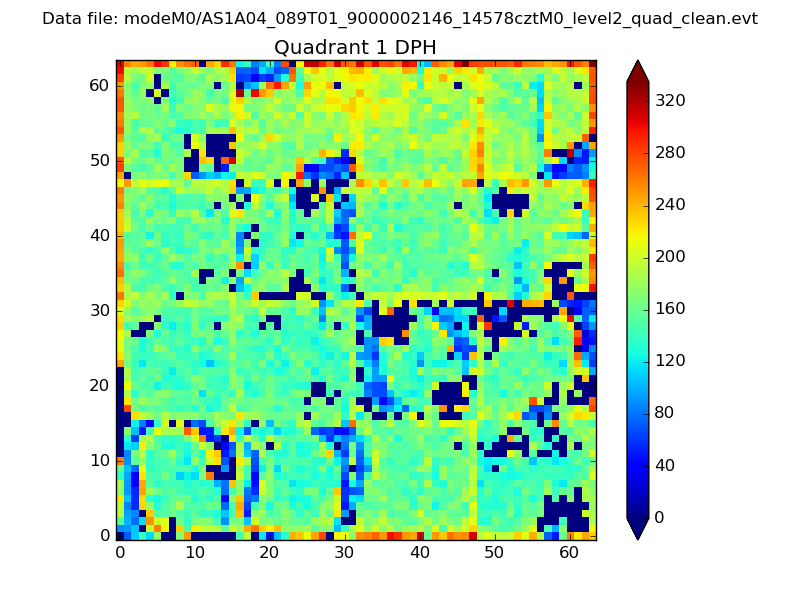 |
Quadrant B |
|---|---|---|---|
| Quadrant D | 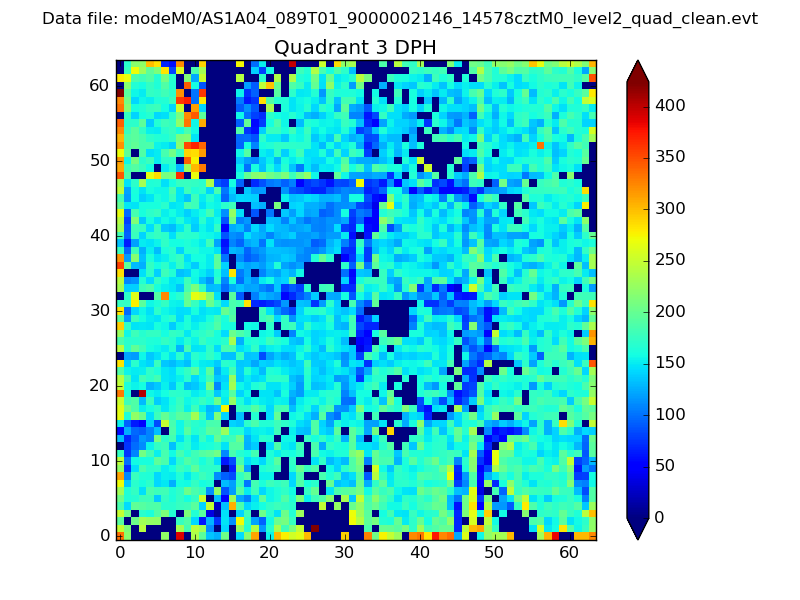 |
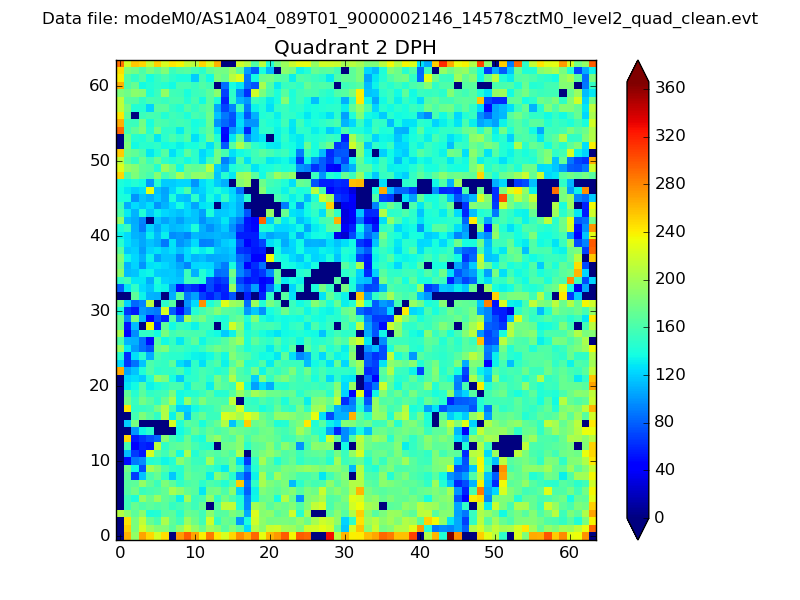 |
Quadrant C |
| Plot type | Count rate plots | Images |
|---|---|---|
| Comparison with Poisson distribution Blue bars denote a histogram of data divided into 1 sec bins. Red curve is a Poisson curve with rate = median count rate of data. |
 |
 |
| Quadrant-wise count rates Data is divided into 100 sec bins |
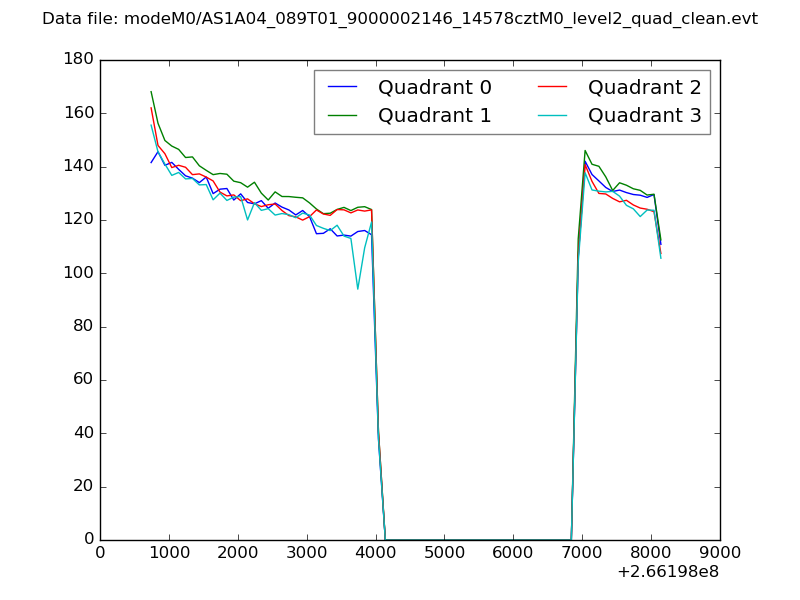 |
|
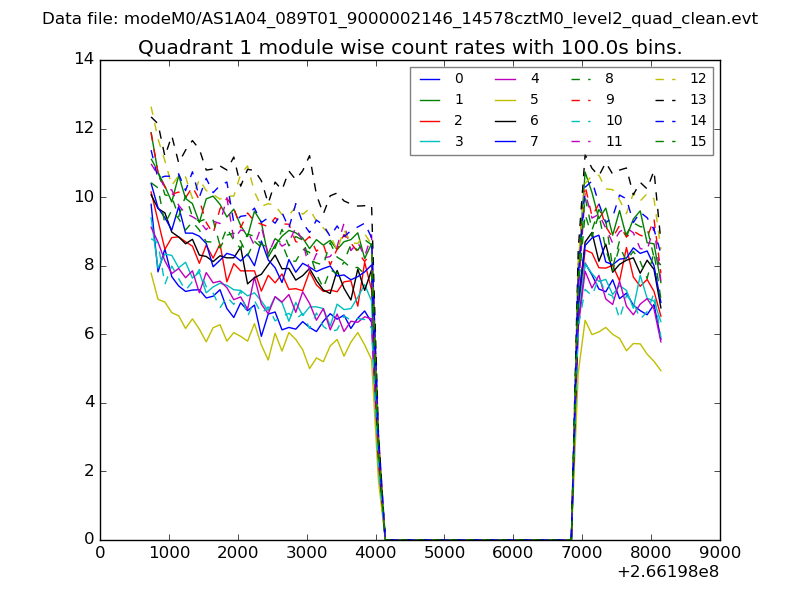
| Module-wise count rates for Quadrant A Data is divided into 100 sec bins |
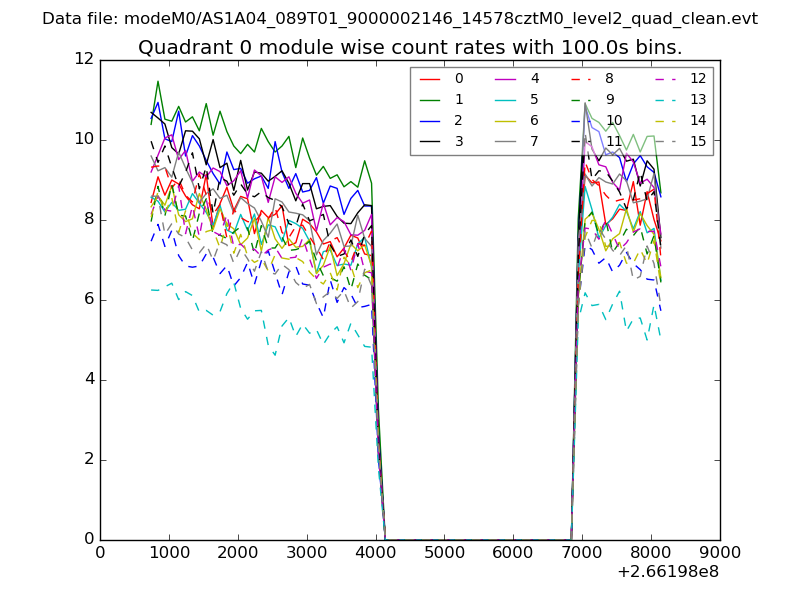 |
 |
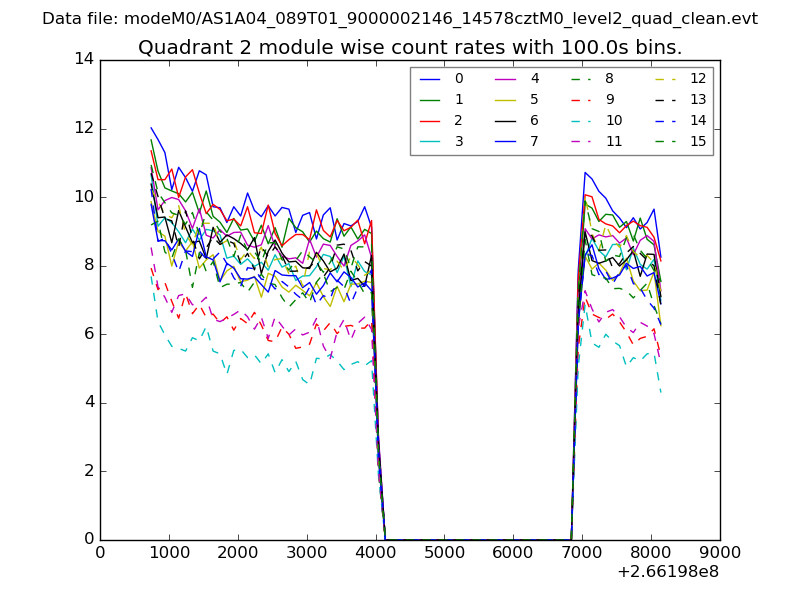
| Module-wise count rates for Quadrant B Data is divided into 100 sec bins |
 |
 |
| Module-wise count rates for Quadrant C Data is divided into 100 sec bins |
 |
 |
| Module-wise count rates for Quadrant D Data is divided into 100 sec bins |
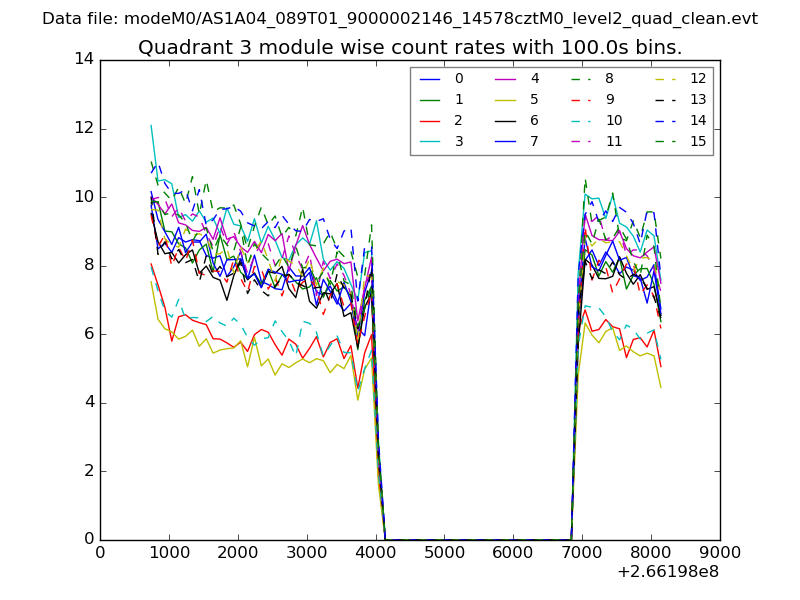 |
 |
| Parameter | Plot |
|---|---|
| CZT HV Monitor | 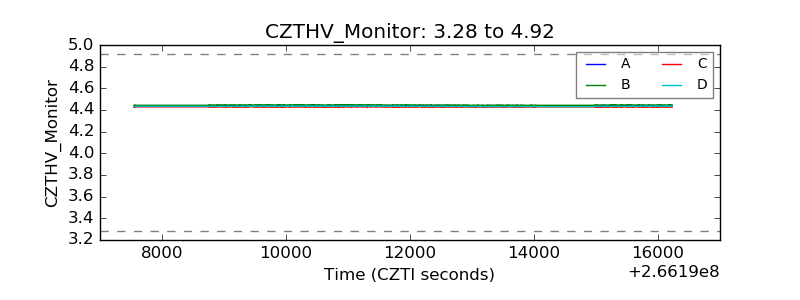 |
| D_VDD | 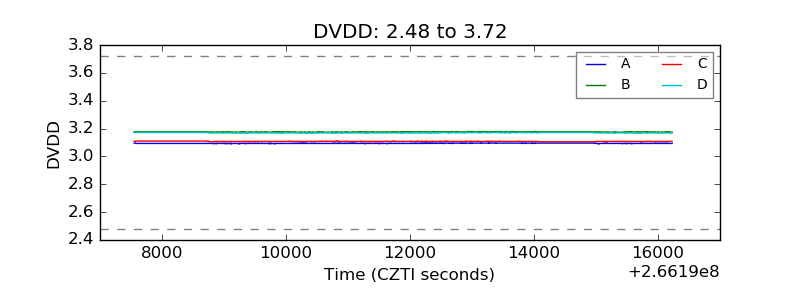 |
| Temperature 1 |  |
| Veto HV Monitor | 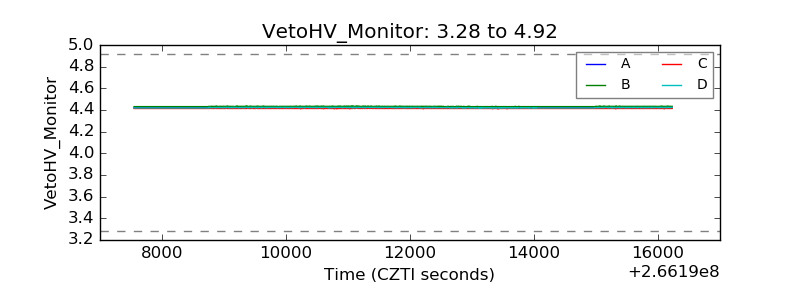 |
| Veto LLD |  |
| Alpha Counter | 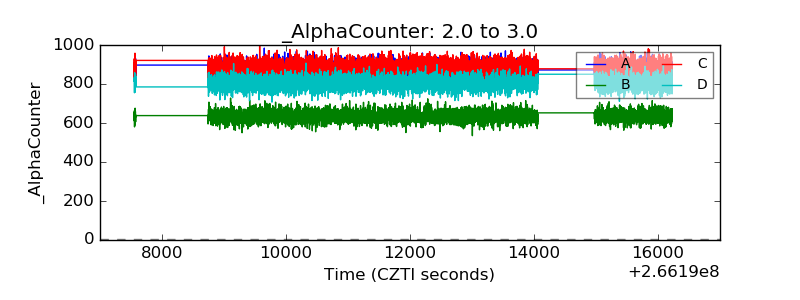 |
| _CPM_Rate | 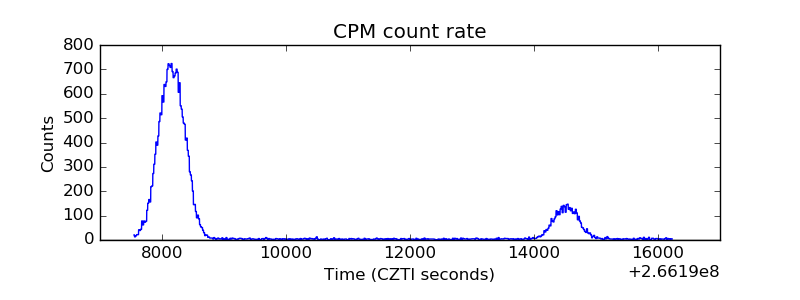 |
| CZT Counter | 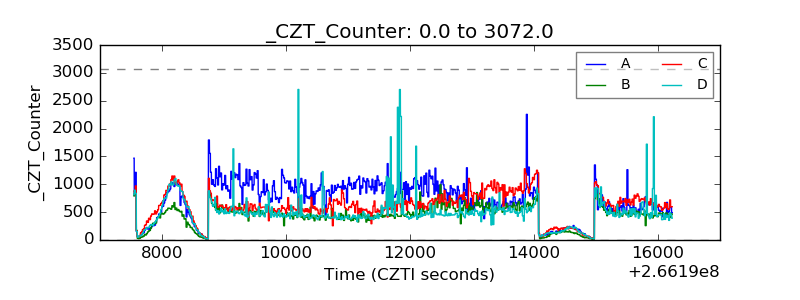 |
| +2.5 Volts monitor |  |
| +5 Volts monitor |  |
| _ROLL_ROT | 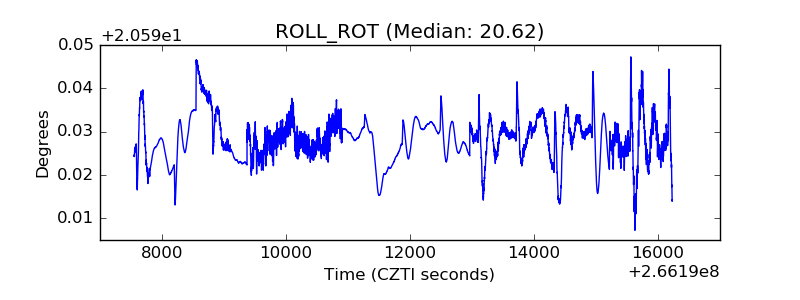 |
| _Roll_DEC |  |
| _Roll_RA | 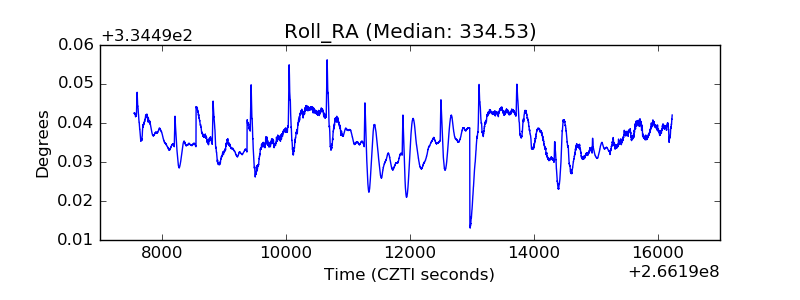 |
| Veto Counter | 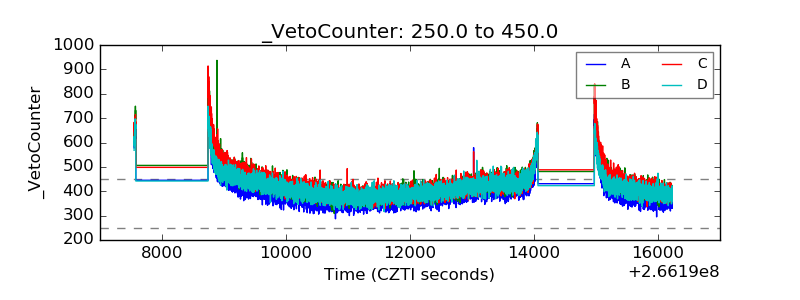 |