| Param | Original file | Final file |
|---|---|---|
| Filename | modeM0/AS1A04_089T01_9000002146_14579cztM0_level2.evt | modeM0/AS1A04_089T01_9000002146_14579cztM0_level2_quad_clean.evt |
| Size (bytes) | 736,680,960 | 101,004,480 |
| Size | 702.6 MB | 96.3 MB |
| Events in quadrant A | 7,467,724 | 616,154 |
| Events in quadrant B | 4,392,739 | 651,127 |
| Events in quadrant C | 5,482,781 | 627,450 |
| Events in quadrant D | 4,434,068 | 614,966 |
| Mode SS | |||
|---|---|---|---|
| Quadrant | BADHDUFLAG | Total packets | Discarded packets |
| A | 0 | 162 | 0 |
| B | 0 | 162 | 0 |
| C | 0 | 162 | 0 |
| D | 0 | 162 | 0 |
| Mode M9 | |||
|---|---|---|---|
| Quadrant | BADHDUFLAG | Total packets | Discarded packets |
| A | 0 | 13 | 0 |
| B | 0 | 13 | 0 |
| C | 0 | 13 | 0 |
| D | 0 | 13 | 0 |
| Mode M0 | |||
|---|---|---|---|
| Quadrant | BADHDUFLAG | Total packets | Discarded packets |
| A | 0 | 27514 | 3 |
| B | 0 | 18254 | 2 |
| C | 0 | 22053 | 2 |
| D | 0 | 18449 | 2 |
| Quadrant | Total seconds | Saturated seconds | Saturation percentage |
|---|---|---|---|
| A | 7894 | 710 | 8.994173% |
| B | 7894 | 239 | 3.027616% |
| C | 7894 | 120 | 1.520142% |
| D | 7894 | 170 | 2.153534% |
Noise dominated data is calculated using 1-second bins in cleaned event files. If a bin has >2000 counts, and if more than 50% of those come from <1% of pixels, then it is considered to be noise-dominated and hence unusable.
| Quadrant | # 1 sec bins | Bins with >0 counts | Bins with >2000 counts | High rate bins dominated by noise | Noise dominated (total time) | Noise dominated (detector-on time) | Marked lightcurve |
|---|---|---|---|---|---|---|---|
| A | 9240 | 7897 | 155 | 155 | 1.68% | 1.96% | 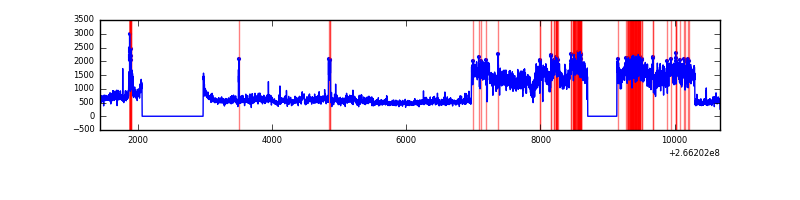 |
| B | 9240 | 7897 | 64 | 64 | 0.69% | 0.81% | 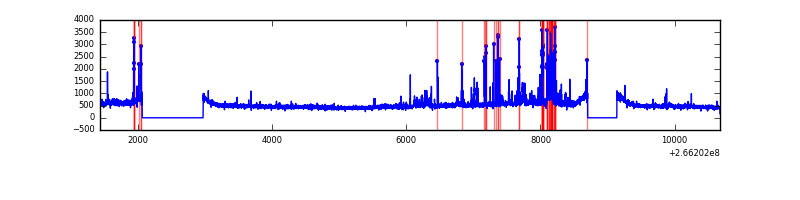 |
| C | 9240 | 7897 | 1 | 1 | 0.01% | 0.01% | 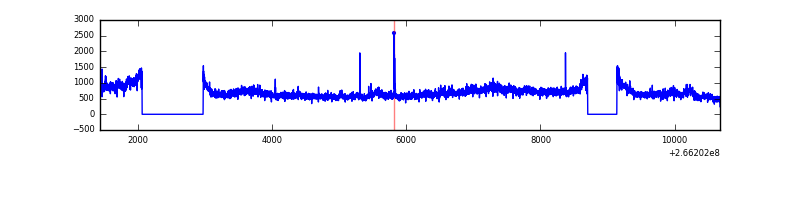 |
| D | 9240 | 7897 | 121 | 121 | 1.31% | 1.53% | 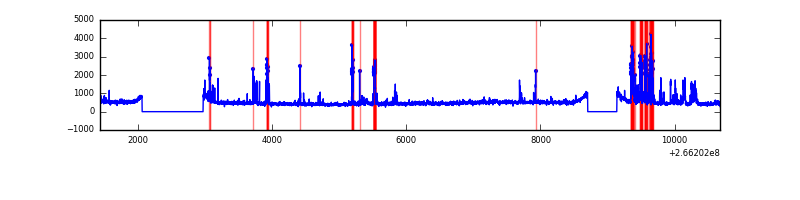 |
Top three noisy pixels from each quadrant. If the there are fewer than three noisy pixels in the level2.evt file, extra rows are filled as -1
| Pixel properties | Quadrant properties | ||||||
|---|---|---|---|---|---|---|---|
| Quadrant | DetID | PixID | Counts | Sigma | Mean | Median | Sigma |
| A | 0 | 23 | 3092934 | 15631.67 | 966 | 944 | 197.8 |
| A | 8 | 15 | 338007 | 1704.03 | 966 | 944 | 197.8 |
| A | 0 | 226 | 196058 | 986.41 | 966 | 944 | 197.8 |
| B | 10 | 16 | 382973 | 2019.77 | 986 | 960 | 189.1 |
| B | 3 | 209 | 40087 | 206.87 | 986 | 960 | 189.1 |
| B | 0 | 189 | 29713 | 152.02 | 986 | 960 | 189.1 |
| C | 3 | 233 | 1708585 | 7612.22 | 959 | 965 | 224.3 |
| C | 14 | 225 | 18137 | 76.55 | 959 | 965 | 224.3 |
| C | 3 | 232 | 9289 | 37.11 | 959 | 965 | 224.3 |
| D | 10 | 199 | 417293 | 1753.97 | 965 | 937 | 237.4 |
| D | 12 | 110 | 188460 | 789.97 | 965 | 937 | 237.4 |
| D | 13 | 122 | 80307 | 334.36 | 965 | 937 | 237.4 |
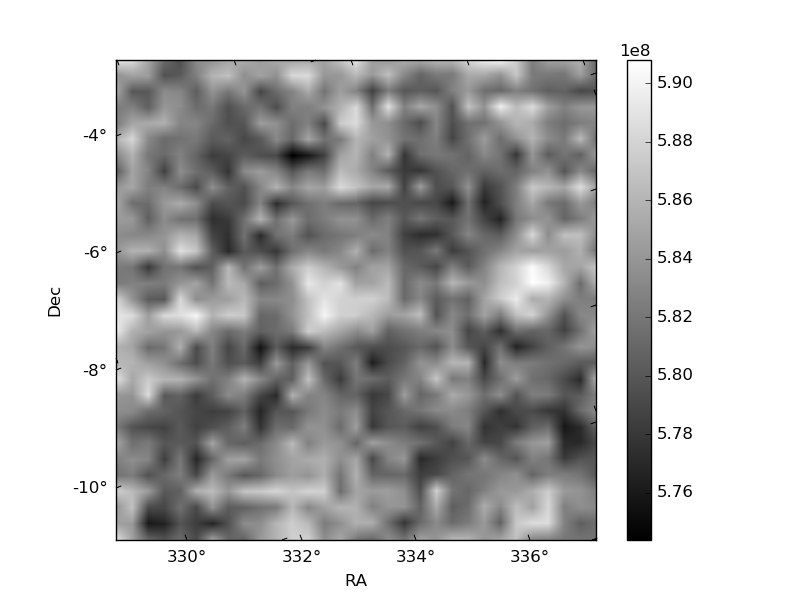
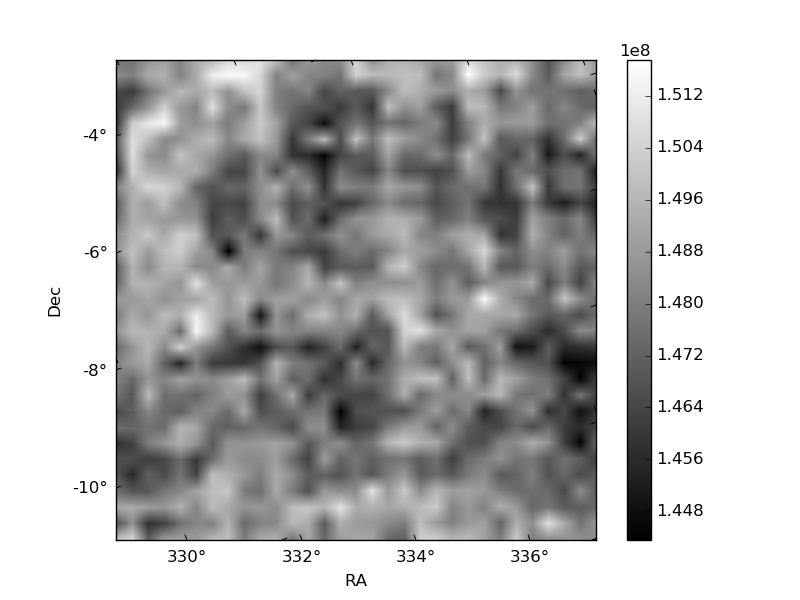
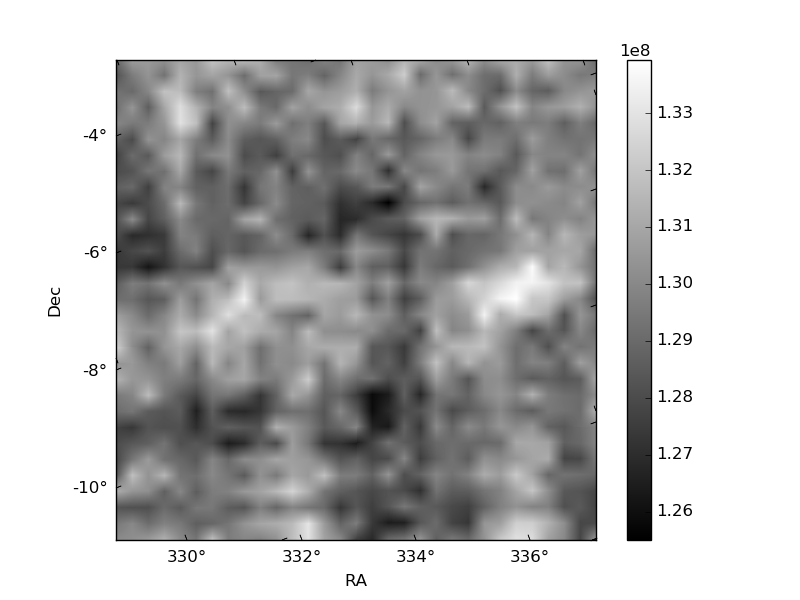
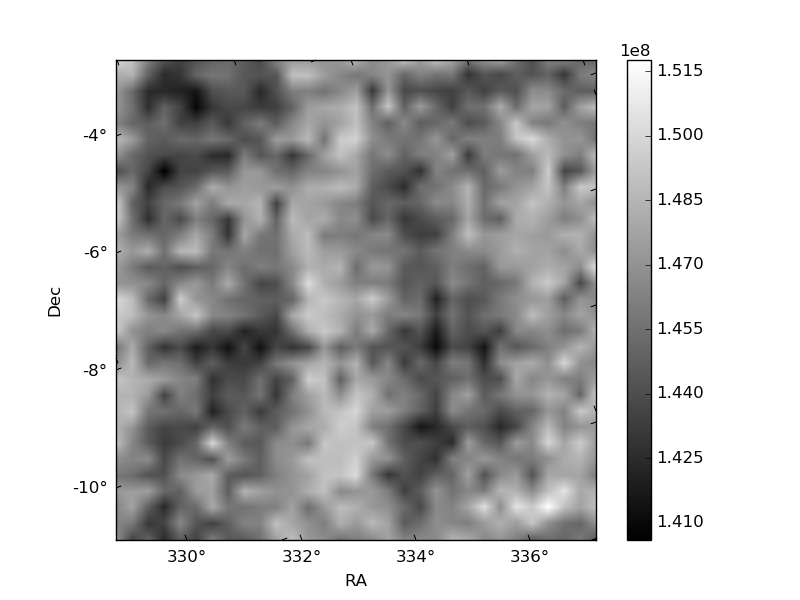
Histogram calculated using DETX and DETY for each event in the final _common_clean file
| Quadrant A | 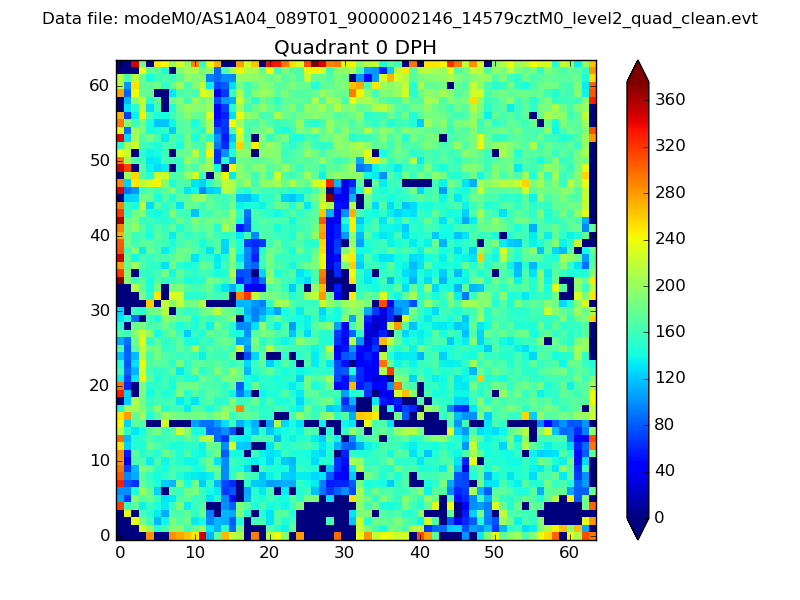 |
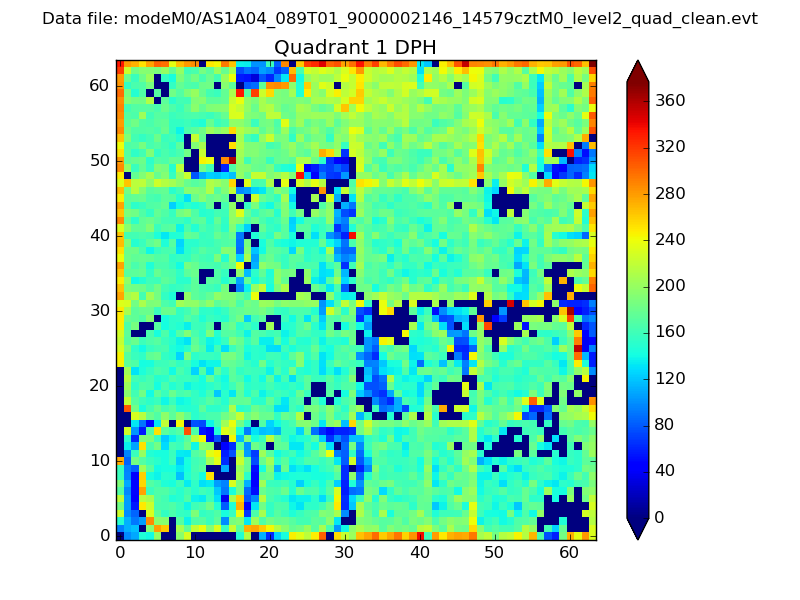 |
Quadrant B |
|---|---|---|---|
| Quadrant D | 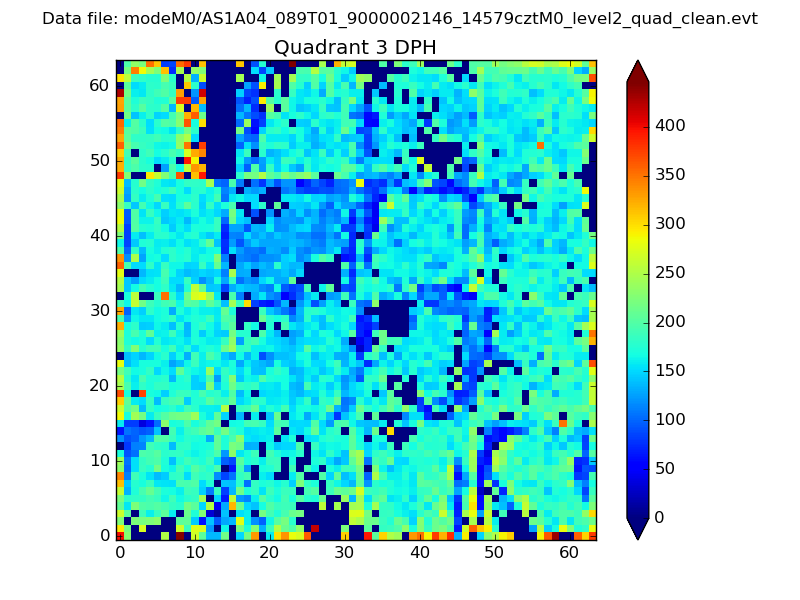 |
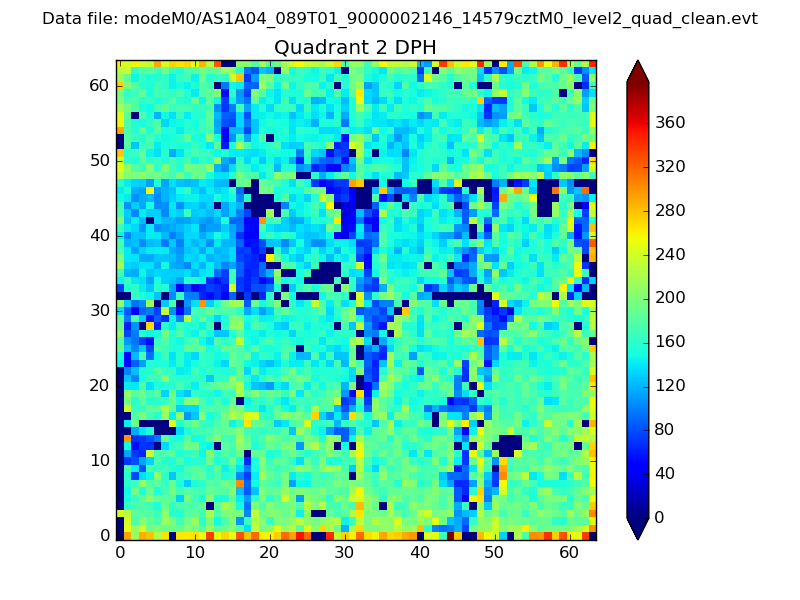 |
Quadrant C |
| Plot type | Count rate plots | Images |
|---|---|---|
| Comparison with Poisson distribution Blue bars denote a histogram of data divided into 1 sec bins. Red curve is a Poisson curve with rate = median count rate of data. |
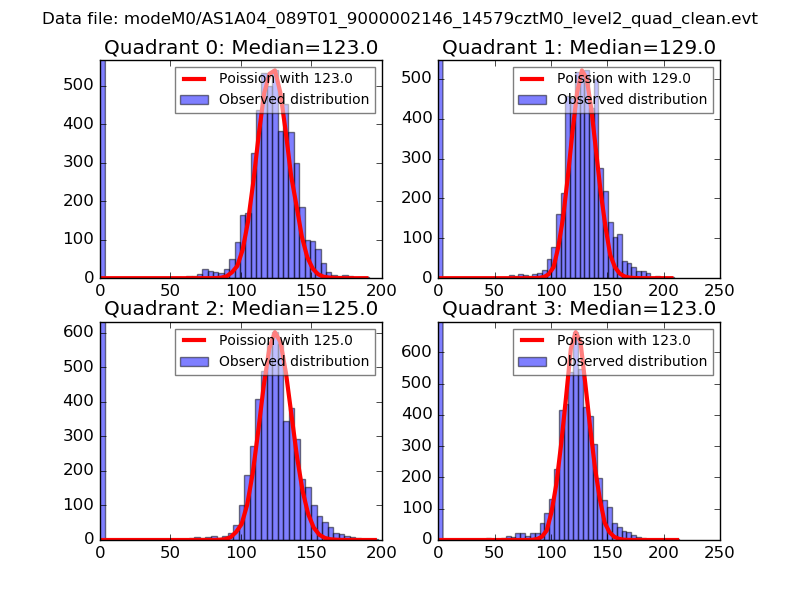 |
 |
| Quadrant-wise count rates Data is divided into 100 sec bins |
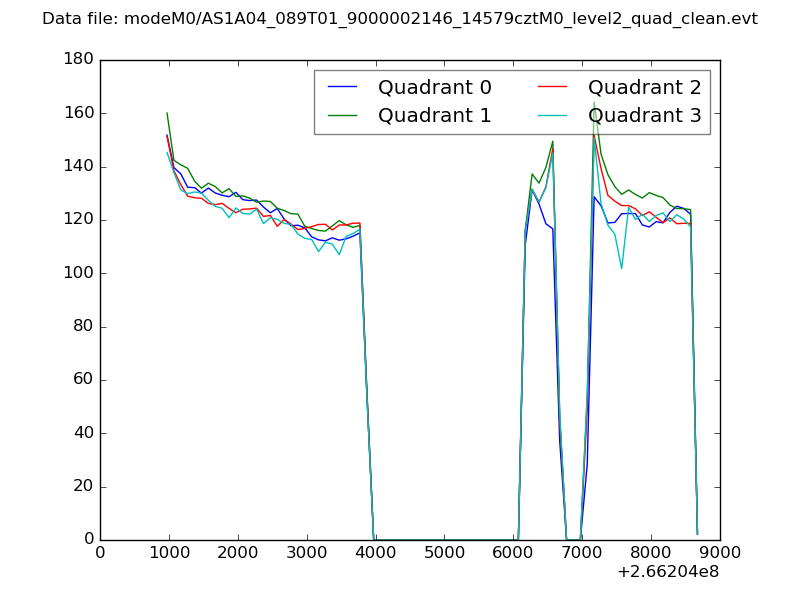 |
|
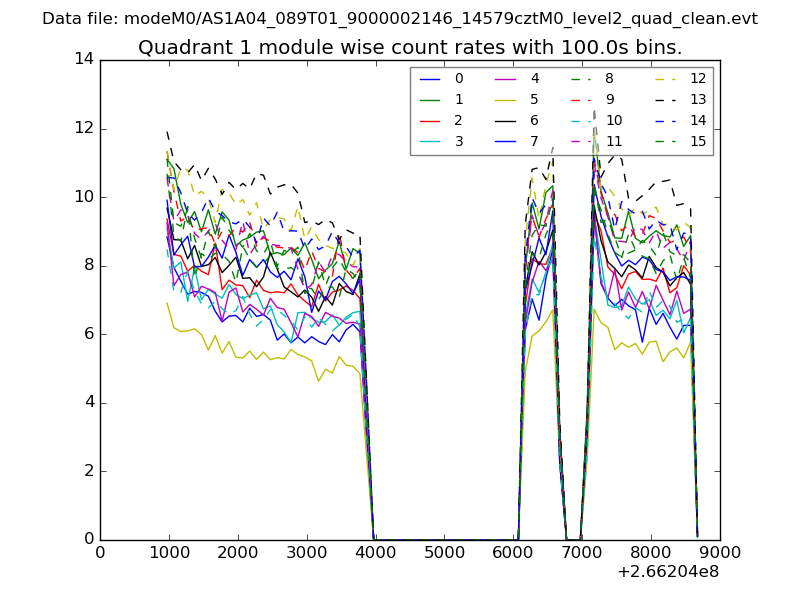
| Module-wise count rates for Quadrant A Data is divided into 100 sec bins |
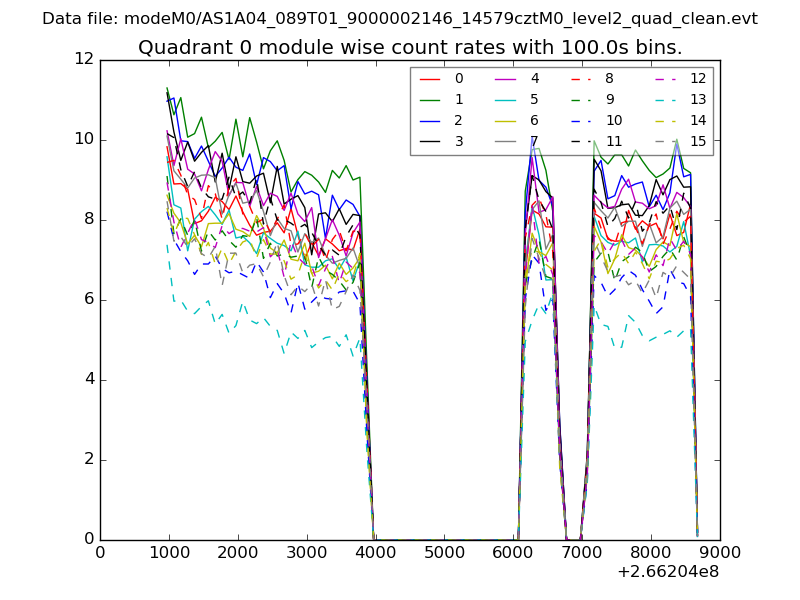 |
 |
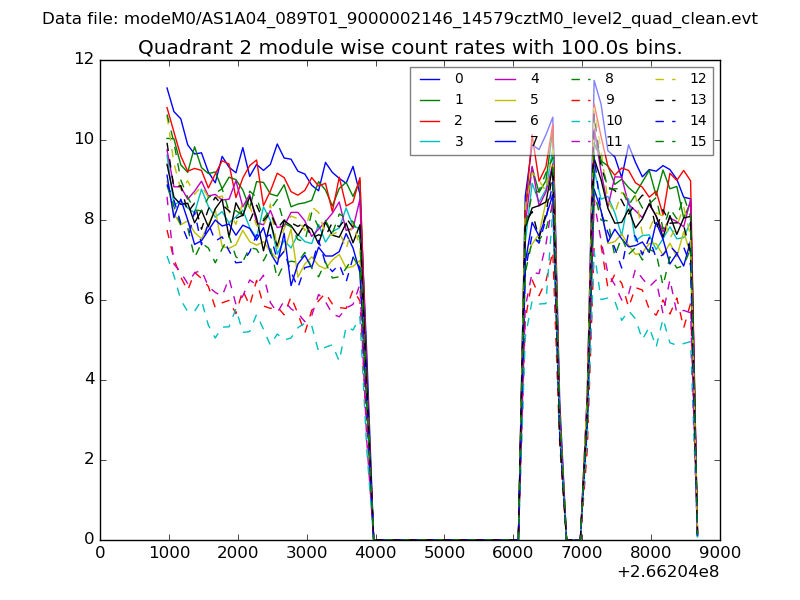
| Module-wise count rates for Quadrant B Data is divided into 100 sec bins |
 |
 |
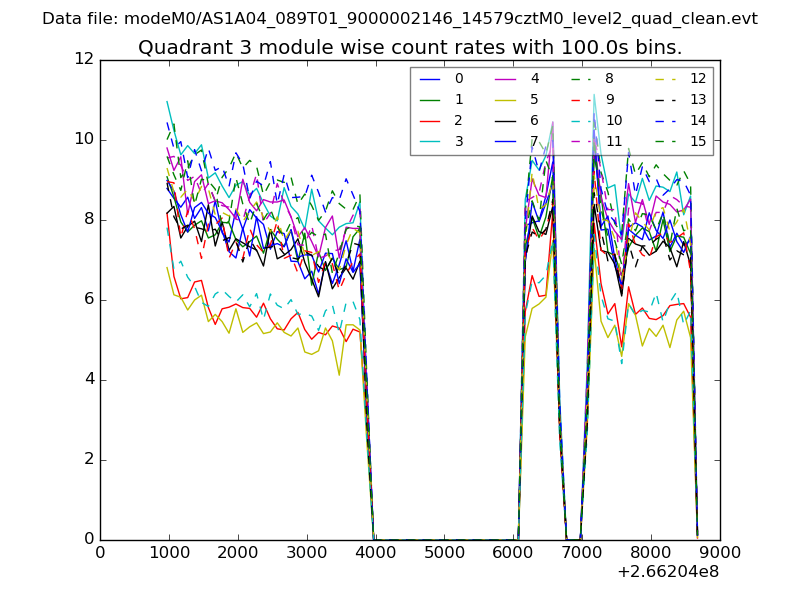
| Module-wise count rates for Quadrant C Data is divided into 100 sec bins |
 |
 |
| Module-wise count rates for Quadrant D Data is divided into 100 sec bins |
 |
 |
| Parameter | Plot |
|---|---|
| CZT HV Monitor | 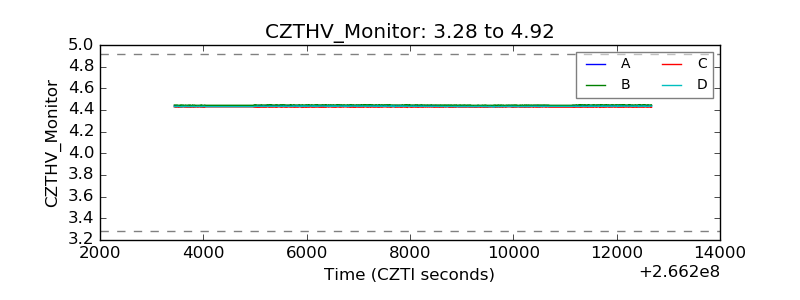 |
| D_VDD | 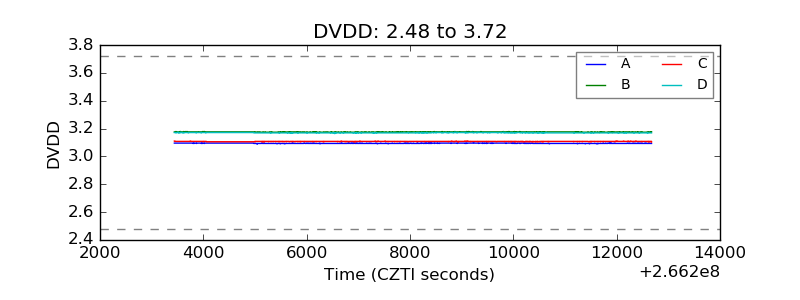 |
| Temperature 1 | 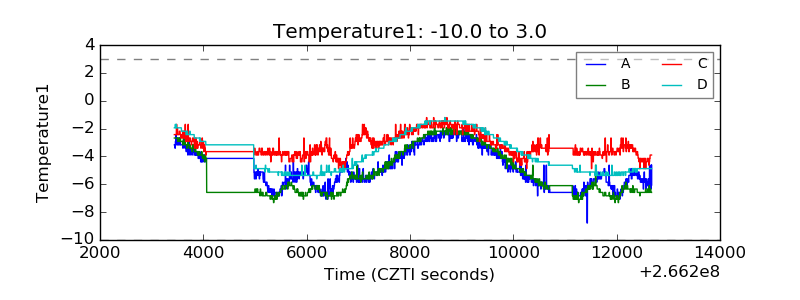 |
| Veto HV Monitor |  |
| Veto LLD | 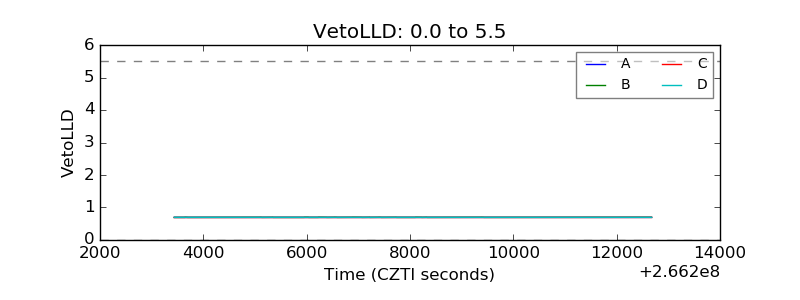 |
| Alpha Counter |  |
| _CPM_Rate | 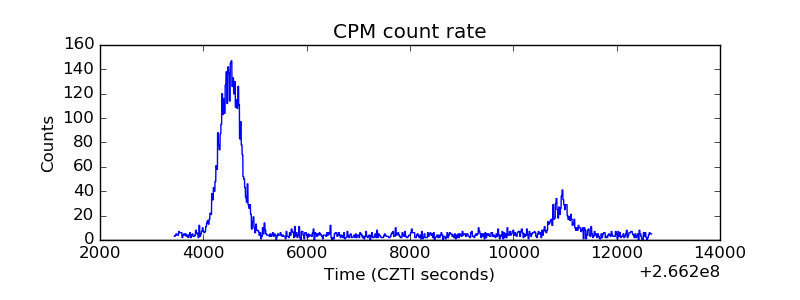 |
| CZT Counter | 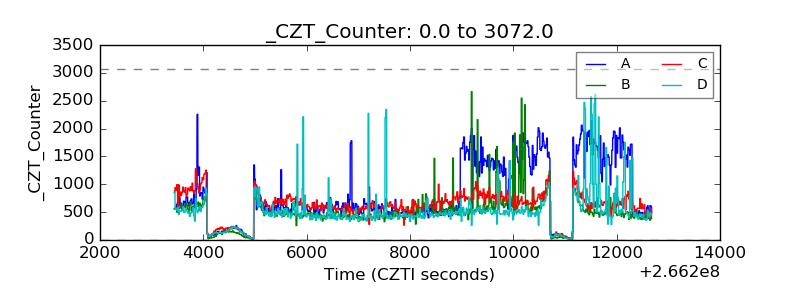 |
| +2.5 Volts monitor | 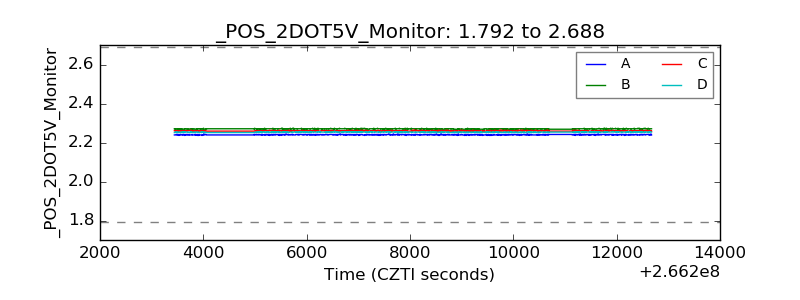 |
| +5 Volts monitor |  |
| _ROLL_ROT | 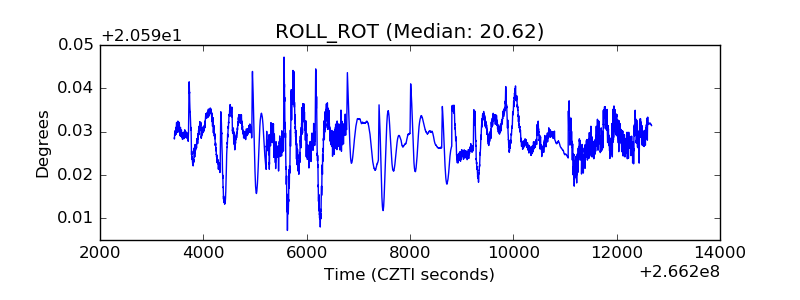 |
| _Roll_DEC | 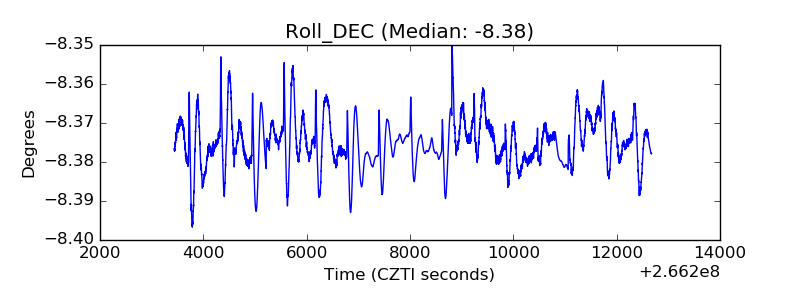 |
| _Roll_RA | 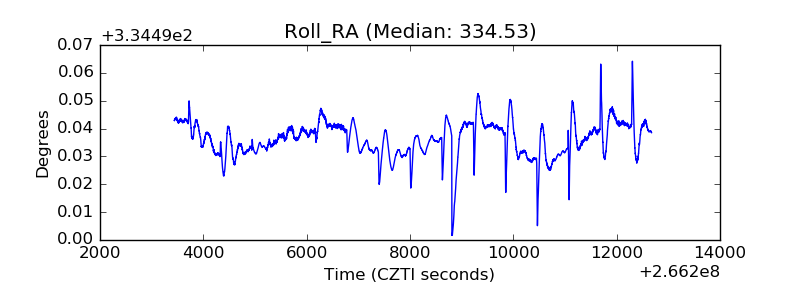 |
| Veto Counter | 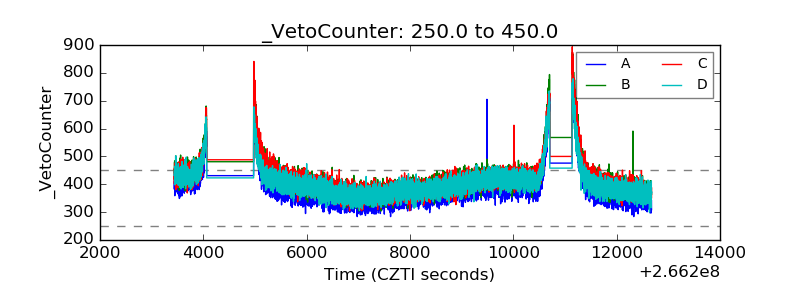 |