| Param | Original file | Final file |
|---|---|---|
| Filename | modeM0/AS1A04_089T01_9000002146_14580cztM0_level2.evt | modeM0/AS1A04_089T01_9000002146_14580cztM0_level2_quad_clean.evt |
| Size (bytes) | 84,755,520 | 14,048,640 |
| Size | 80.8 MB | 13.4 MB |
| Events in quadrant A | 624,565 | 55,475 |
| Events in quadrant B | 600,221 | 96,641 |
| Events in quadrant C | 672,643 | 92,542 |
| Events in quadrant D | 589,766 | 94,824 |
| Mode SS | |||
|---|---|---|---|
| Quadrant | BADHDUFLAG | Total packets | Discarded packets |
| A | 0 | 106 | 80 |
| B | 0 | 104 | 80 |
| C | 0 | 106 | 82 |
| D | 0 | 106 | 84 |
| Mode M9 | |||
|---|---|---|---|
| Quadrant | BADHDUFLAG | Total packets | Discarded packets |
| A | 0 | 3 | 2 |
| B | 0 | 3 | 3 |
| C | 0 | 2 | 0 |
| D | 0 | 2 | 1 |
| Mode M0 | |||
|---|---|---|---|
| Quadrant | BADHDUFLAG | Total packets | Discarded packets |
| A | 0 | 17628 | 15233 |
| B | 0 | 11667 | 9146 |
| C | 0 | 12657 | 9921 |
| D | 0 | 11639 | 9049 |
| Quadrant | Total seconds | Saturated seconds | Saturation percentage |
|---|---|---|---|
| A | 837 | 23 | 2.747909% |
| B | 1203 | 20 | 1.662510% |
| C | 1156 | 12 | 1.038062% |
| D | 1228 | 12 | 0.977199% |
Noise dominated data is calculated using 1-second bins in cleaned event files. If a bin has >2000 counts, and if more than 50% of those come from <1% of pixels, then it is considered to be noise-dominated and hence unusable.
| Quadrant | # 1 sec bins | Bins with >0 counts | Bins with >2000 counts | High rate bins dominated by noise | Noise dominated (total time) | Noise dominated (detector-on time) | Marked lightcurve |
|---|---|---|---|---|---|---|---|
| A | 5445 | 1305 | 6 | 6 | 0.11% | 0.46% | 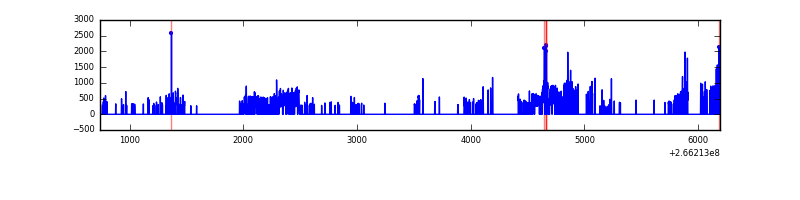 |
| B | 5452 | 1857 | 0 | 0 | 0.00% | 0.00% | 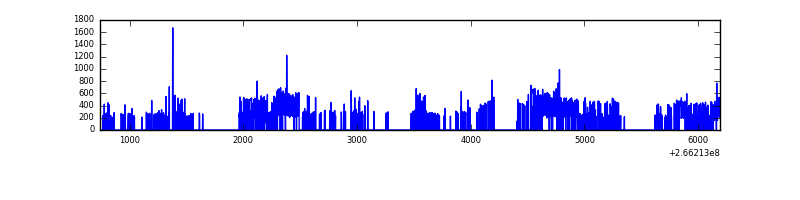 |
| C | 5452 | 1805 | 0 | 0 | 0.00% | 0.00% | 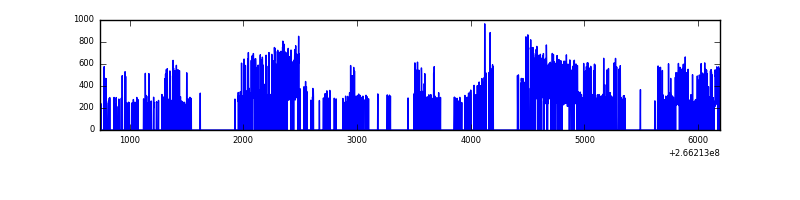 |
| D | 5424 | 1848 | 0 | 0 | 0.00% | 0.00% | 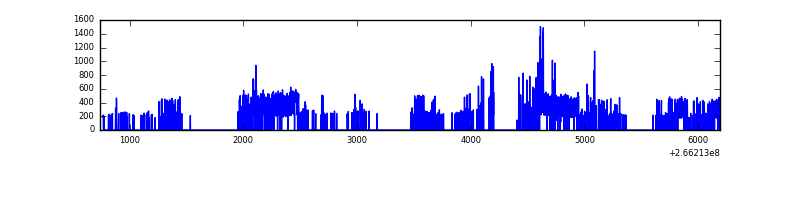 |
Top three noisy pixels from each quadrant. If the there are fewer than three noisy pixels in the level2.evt file, extra rows are filled as -1
| Pixel properties | Quadrant properties | ||||||
|---|---|---|---|---|---|---|---|
| Quadrant | DetID | PixID | Counts | Sigma | Mean | Median | Sigma |
| A | 0 | 23 | 196136 | 8466.13 | 103 | 101 | 23.2 |
| A | 0 | 226 | 12620 | 540.66 | 103 | 101 | 23.2 |
| A | 12 | 189 | 8797 | 375.55 | 103 | 101 | 23.2 |
| B | 10 | 16 | 13511 | 433.64 | 147 | 143 | 30.8 |
| B | 12 | 111 | 3330 | 103.38 | 147 | 143 | 30.8 |
| B | 11 | 111 | 2934 | 90.54 | 147 | 143 | 30.8 |
| C | 3 | 233 | 133170 | 3965.67 | 138 | 138 | 33.5 |
| C | 13 | 61 | 939 | 23.88 | 138 | 138 | 33.5 |
| C | 3 | 232 | 477 | 10.11 | 138 | 138 | 33.5 |
| D | 10 | 199 | 24363 | 647.31 | 146 | 142 | 37.4 |
| D | 12 | 110 | 8358 | 219.58 | 146 | 142 | 37.4 |
| D | 2 | 234 | 4736 | 122.78 | 146 | 142 | 37.4 |
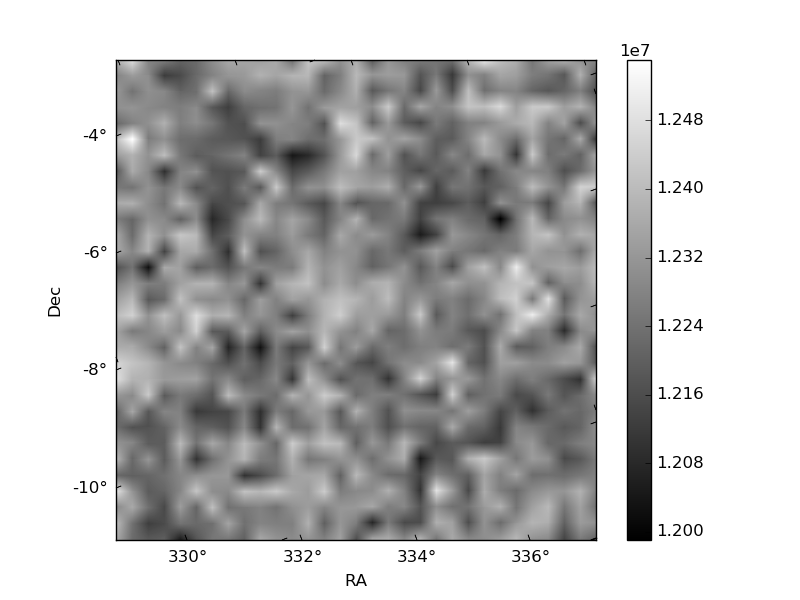
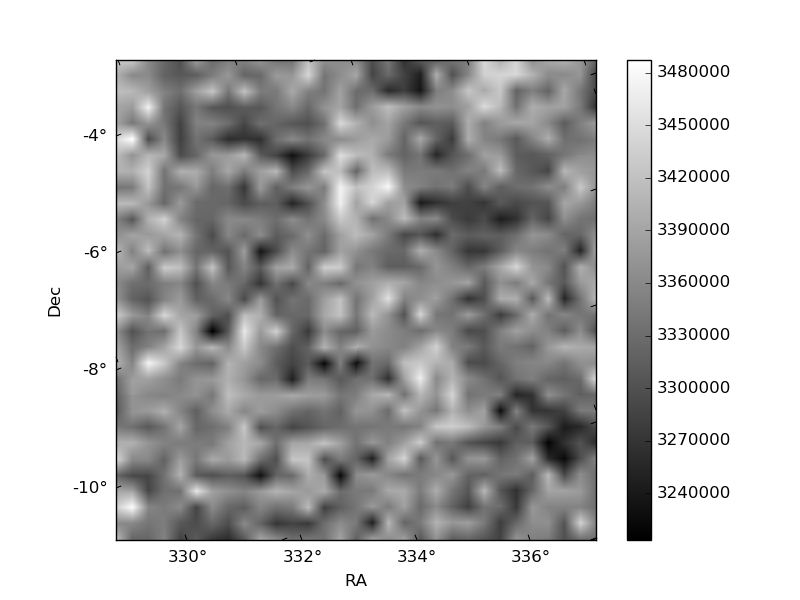
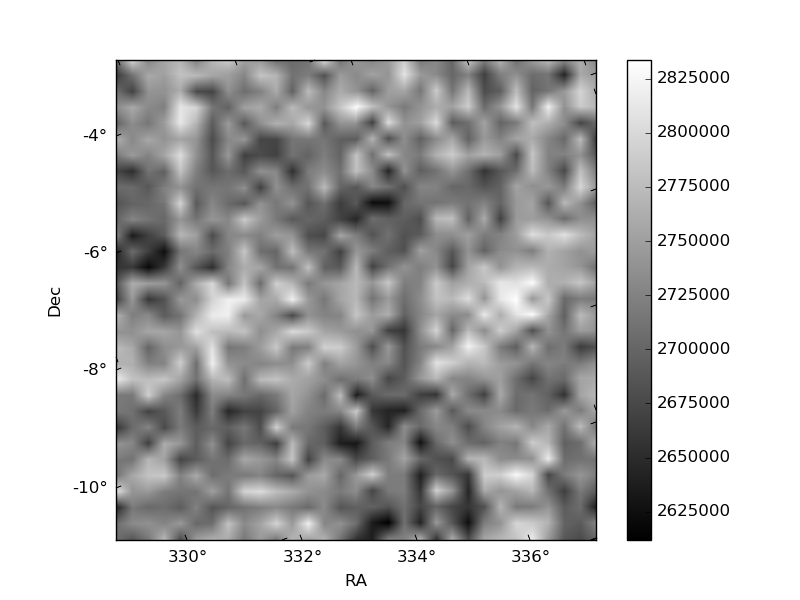
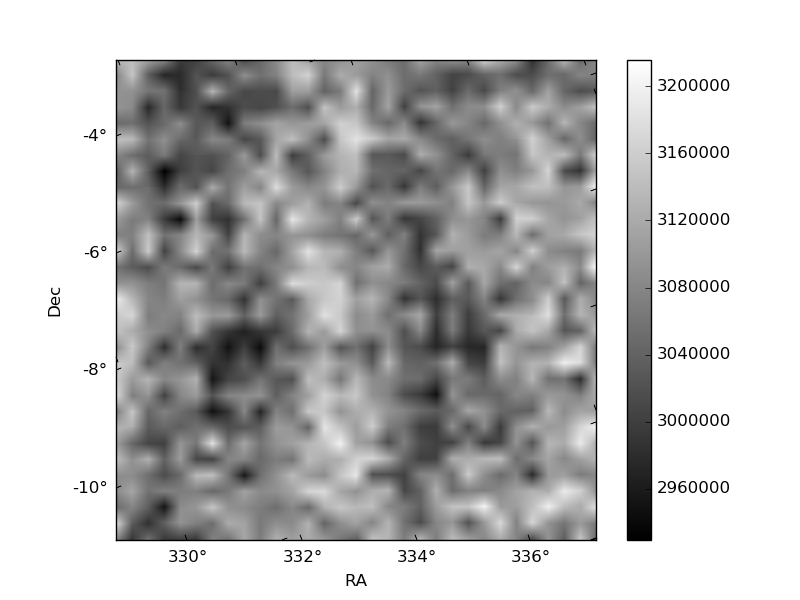
Histogram calculated using DETX and DETY for each event in the final _common_clean file
| Quadrant A | 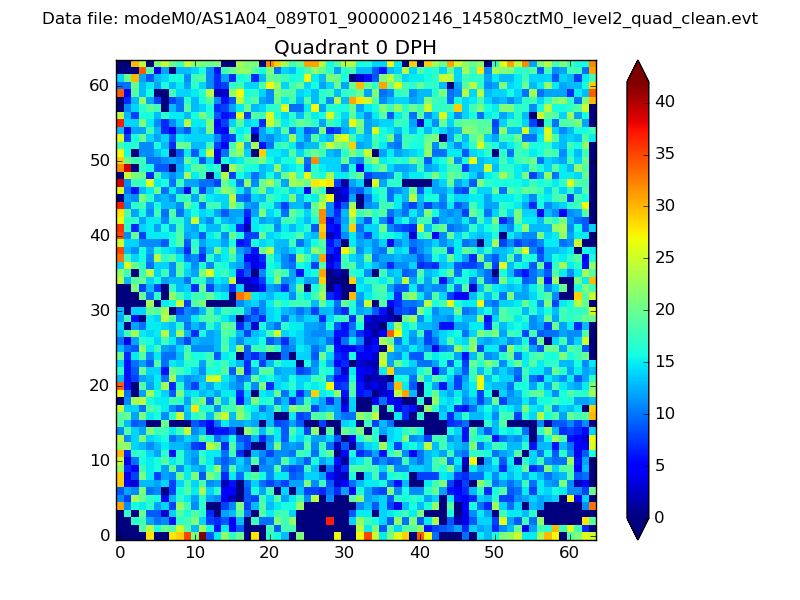 |
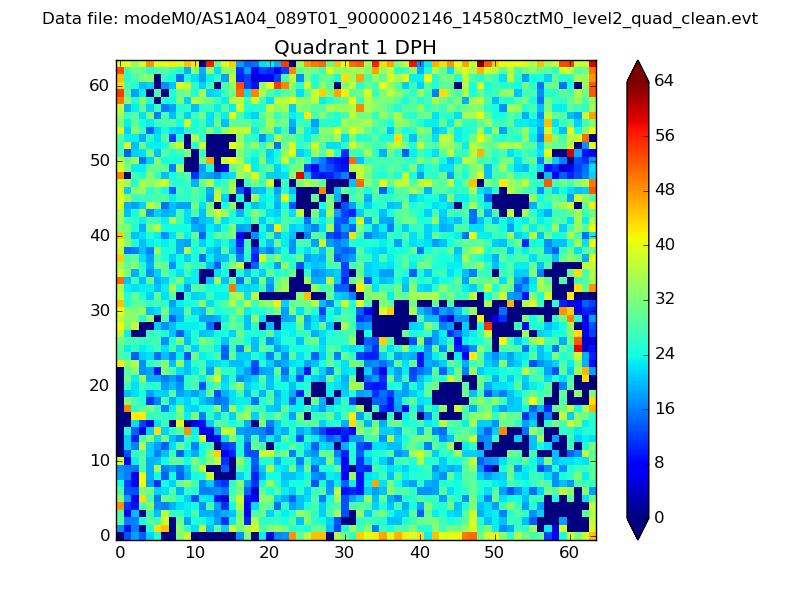 |
Quadrant B |
|---|---|---|---|
| Quadrant D | 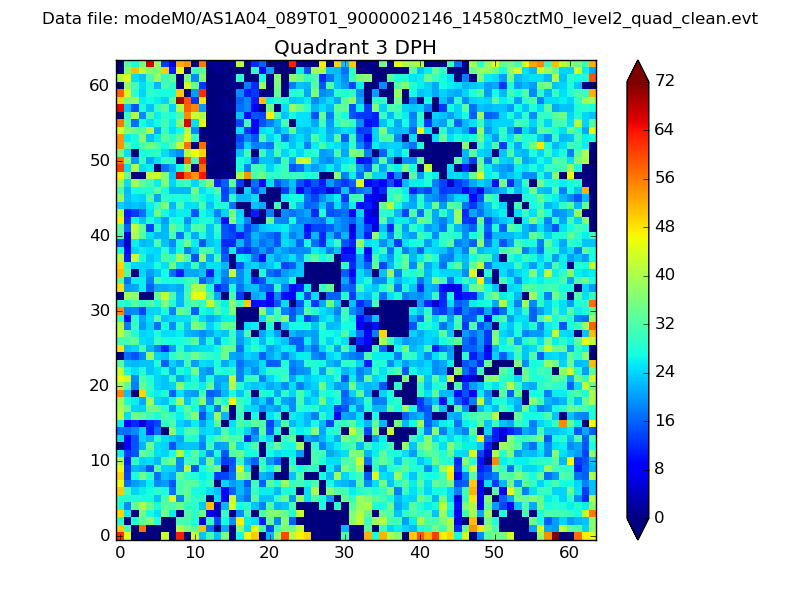 |
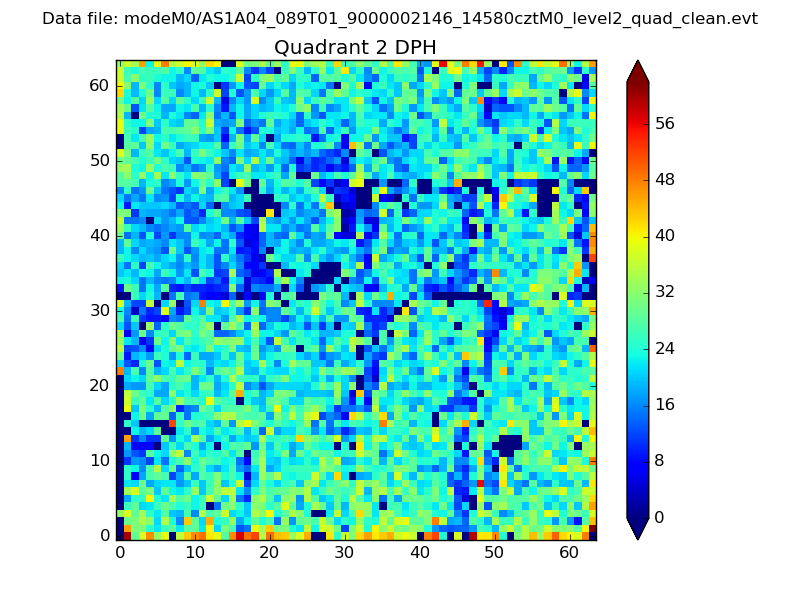 |
Quadrant C |
| Plot type | Count rate plots | Images |
|---|---|---|
| Comparison with Poisson distribution Blue bars denote a histogram of data divided into 1 sec bins. Red curve is a Poisson curve with rate = median count rate of data. |
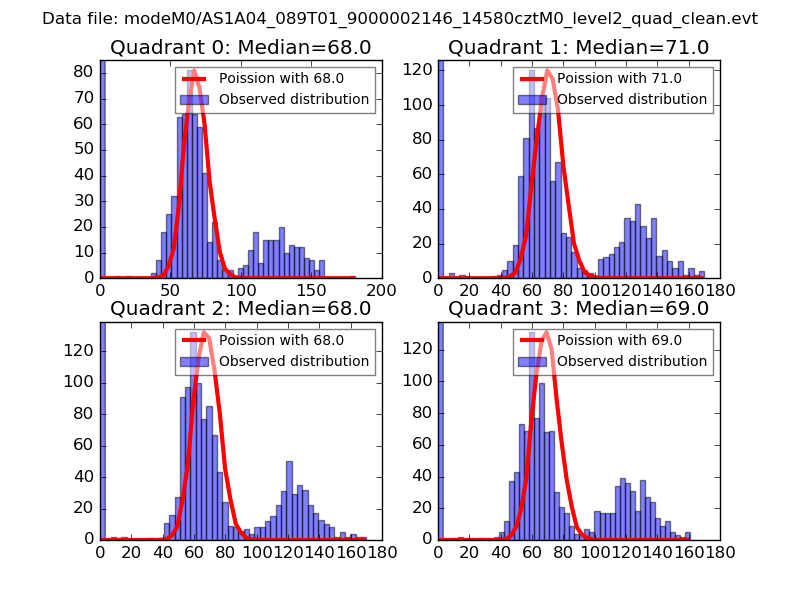 |
 |
| Quadrant-wise count rates Data is divided into 100 sec bins |
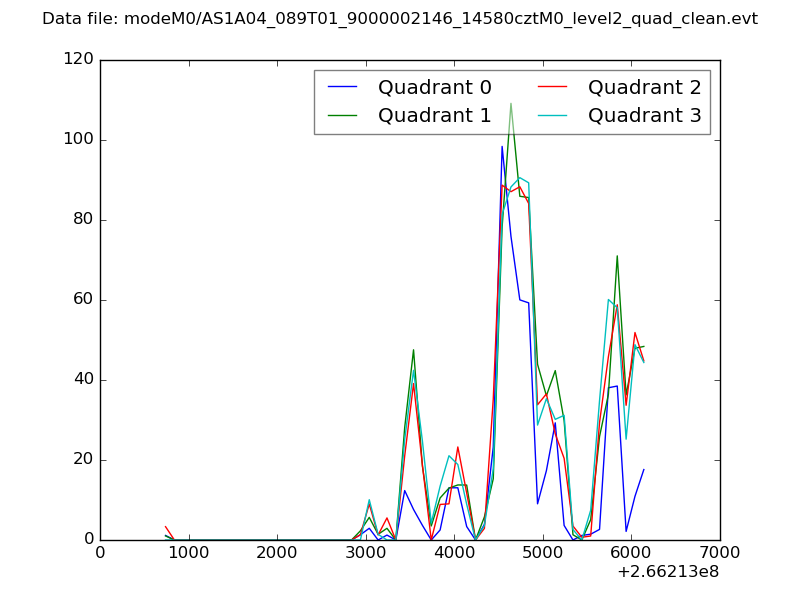 |
|
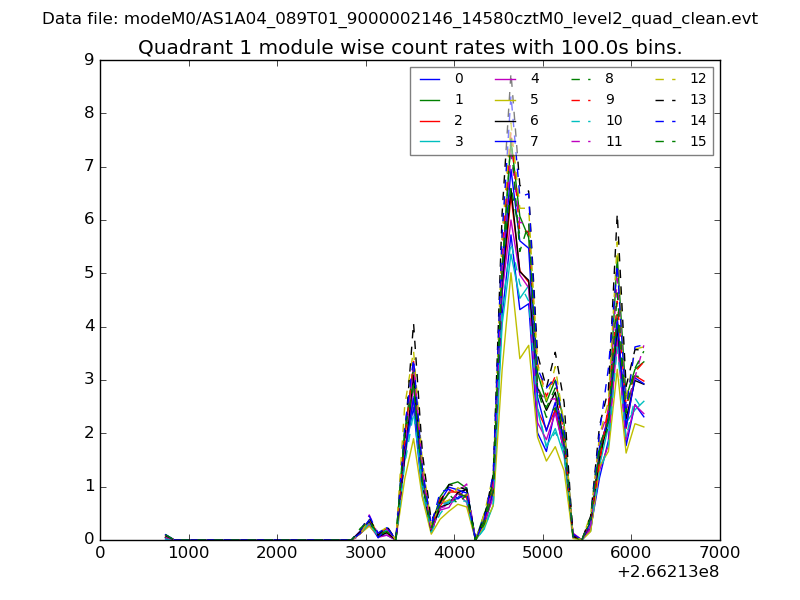
| Module-wise count rates for Quadrant A Data is divided into 100 sec bins |
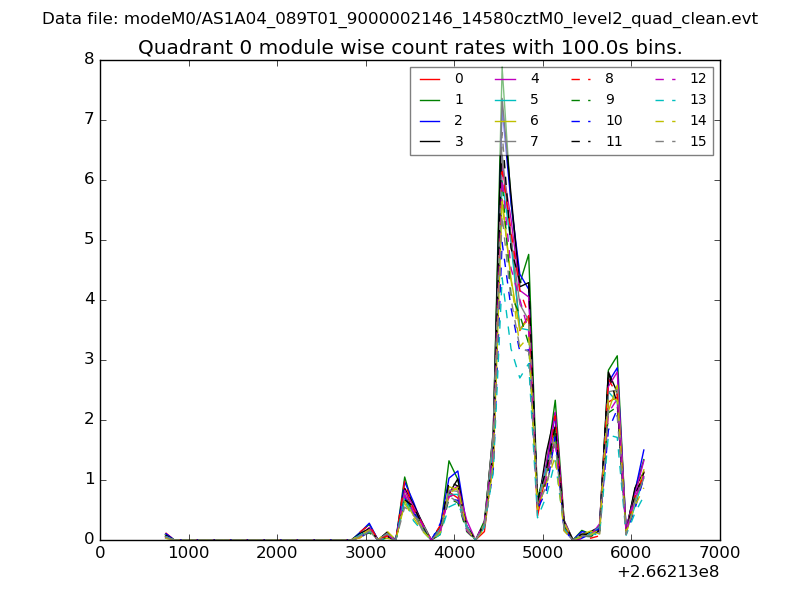 |
 |
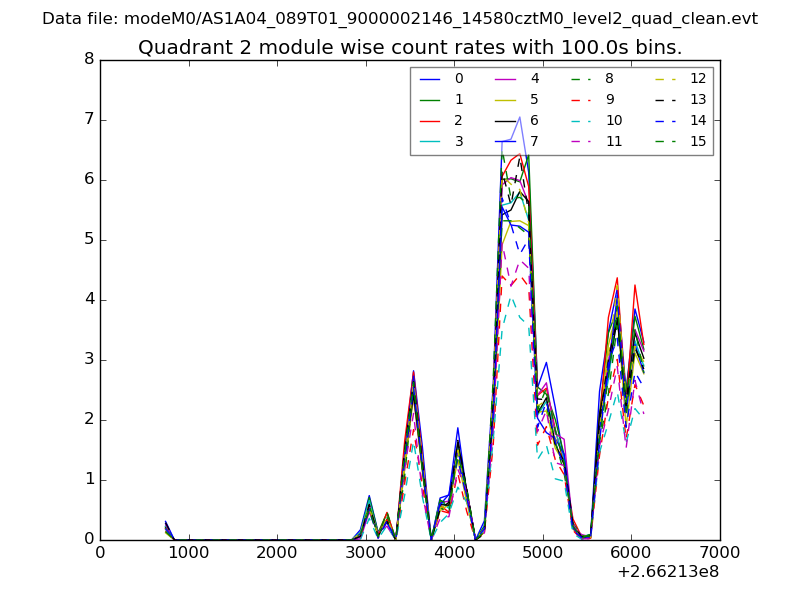
| Module-wise count rates for Quadrant B Data is divided into 100 sec bins |
 |
 |
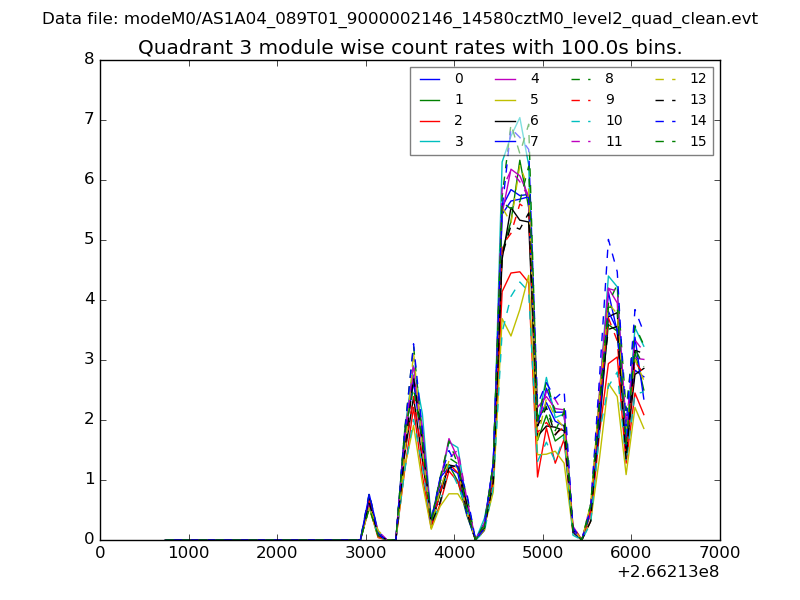
| Module-wise count rates for Quadrant C Data is divided into 100 sec bins |
 |
 |
| Module-wise count rates for Quadrant D Data is divided into 100 sec bins |
 |
 |
| Parameter | Plot |
|---|---|
| CZT HV Monitor | 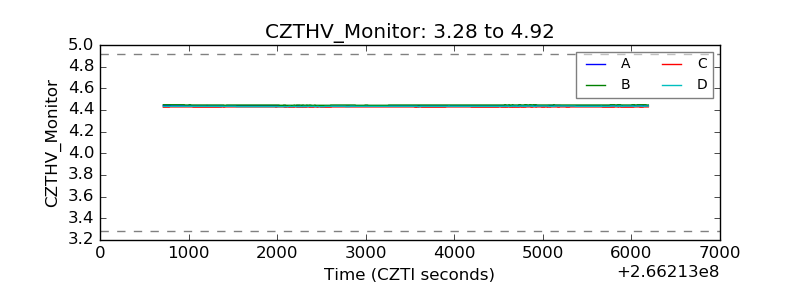 |
| D_VDD | 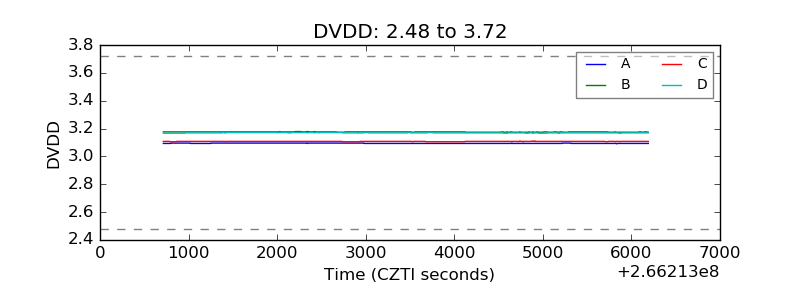 |
| Temperature 1 | 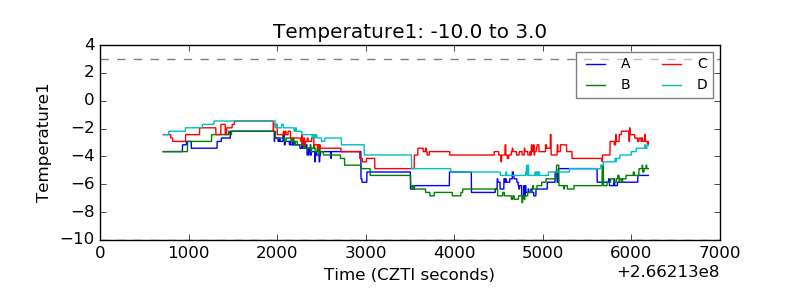 |
| Veto HV Monitor | 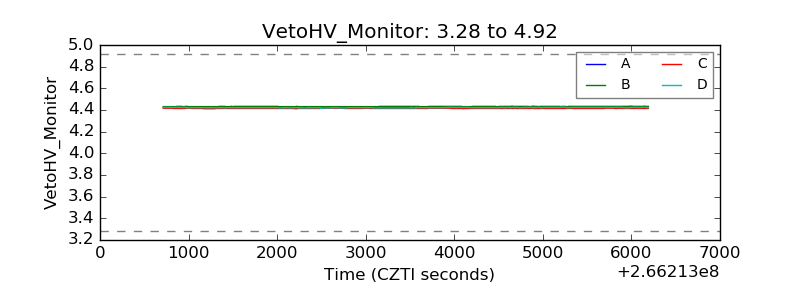 |
| Veto LLD | 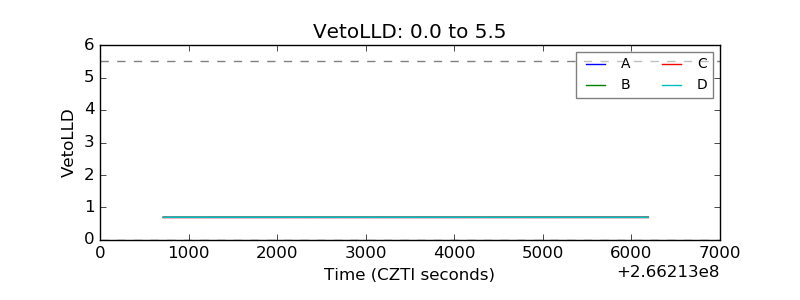 |
| Alpha Counter | 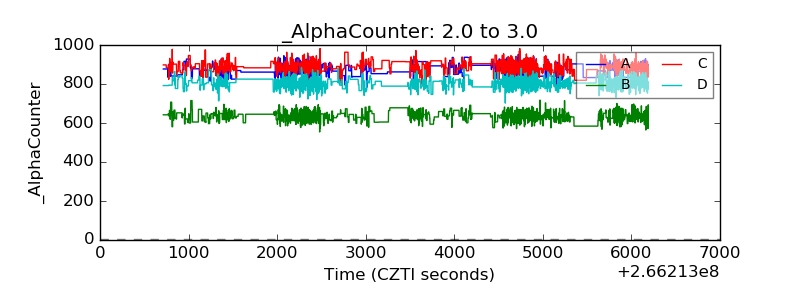 |
| _CPM_Rate | 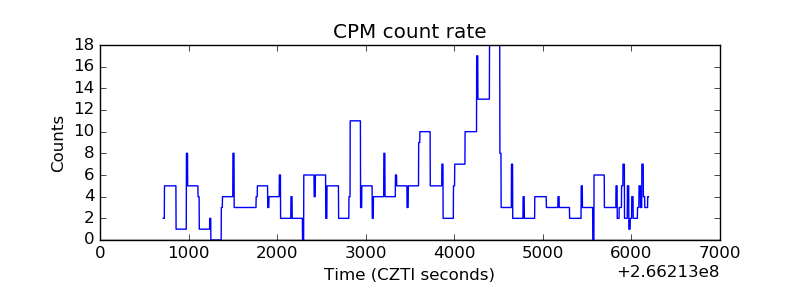 |
| CZT Counter | 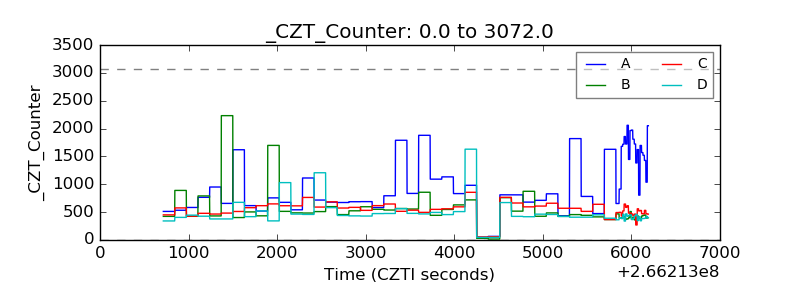 |
| +2.5 Volts monitor |  |
| +5 Volts monitor |  |
| _ROLL_ROT | 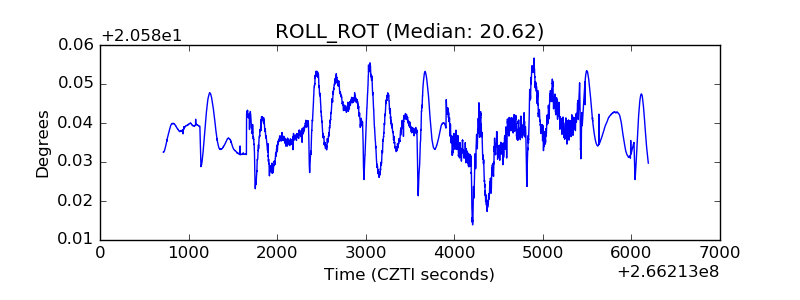 |
| _Roll_DEC | 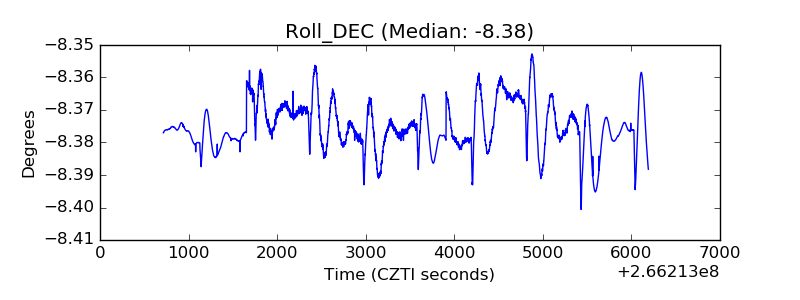 |
| _Roll_RA | 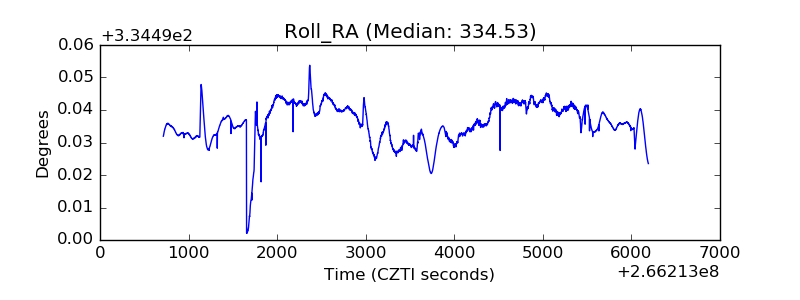 |
| Veto Counter | 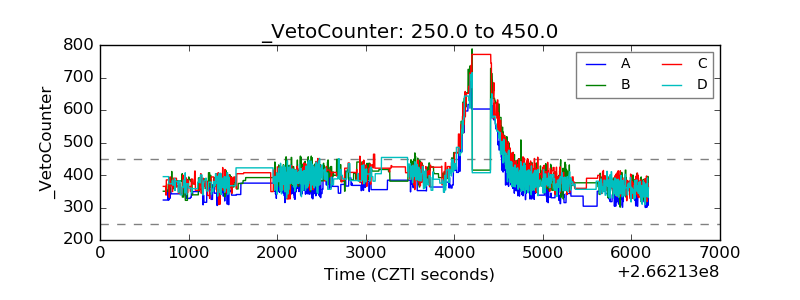 |