| Param | Original file | Final file |
|---|---|---|
| Filename | modeM0/AS1A04_089T01_9000002146_14584cztM0_level2.evt | modeM0/AS1A04_089T01_9000002146_14584cztM0_level2_quad_clean.evt |
| Size (bytes) | 2,402,101,440 | 297,463,680 |
| Size | 2.2 GB | 283.7 MB |
| Events in quadrant A | 27,639,749 | 1,764,381 |
| Events in quadrant B | 14,914,468 | 1,855,842 |
| Events in quadrant C | 15,411,525 | 1,814,803 |
| Events in quadrant D | 13,035,719 | 1,786,917 |
| Mode SS | |||
|---|---|---|---|
| Quadrant | BADHDUFLAG | Total packets | Discarded packets |
| A | 0 | 526 | 0 |
| B | 0 | 526 | 0 |
| C | 0 | 526 | 0 |
| D | 0 | 526 | 0 |
| Mode M9 | |||
|---|---|---|---|
| Quadrant | BADHDUFLAG | Total packets | Discarded packets |
| A | 0 | 18 | 0 |
| B | 0 | 18 | 0 |
| C | 0 | 18 | 0 |
| D | 0 | 18 | 0 |
| Mode M0 | |||
|---|---|---|---|
| Quadrant | BADHDUFLAG | Total packets | Discarded packets |
| A | 0 | 100198 | 4 |
| B | 0 | 60626 | 4 |
| C | 0 | 63174 | 4 |
| D | 0 | 56343 | 4 |
| Quadrant | Total seconds | Saturated seconds | Saturation percentage |
|---|---|---|---|
| A | 25978 | 2661 | 10.243283% |
| B | 25978 | 1116 | 4.295943% |
| C | 25978 | 262 | 1.008546% |
| D | 25978 | 404 | 1.555162% |
Noise dominated data is calculated using 1-second bins in cleaned event files. If a bin has >2000 counts, and if more than 50% of those come from <1% of pixels, then it is considered to be noise-dominated and hence unusable.
| Quadrant | # 1 sec bins | Bins with >0 counts | Bins with >2000 counts | High rate bins dominated by noise | Noise dominated (total time) | Noise dominated (detector-on time) | Marked lightcurve |
|---|---|---|---|---|---|---|---|
| A | 27704 | 25982 | 1686 | 1686 | 6.09% | 6.49% | 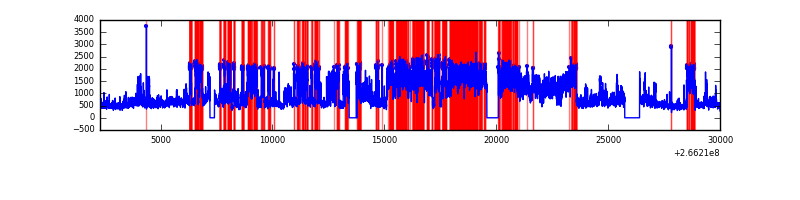 |
| B | 27704 | 25983 | 593 | 593 | 2.14% | 2.28% |  |
| C | 27704 | 25983 | 0 | 0 | 0.00% | 0.00% | 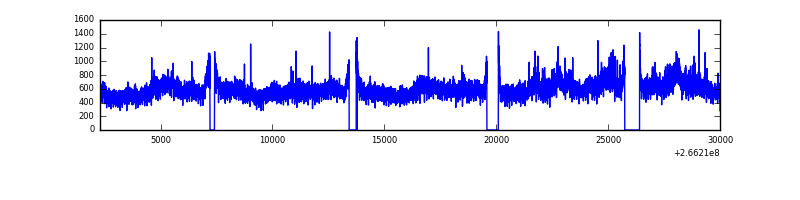 |
| D | 27704 | 25983 | 135 | 135 | 0.49% | 0.52% | 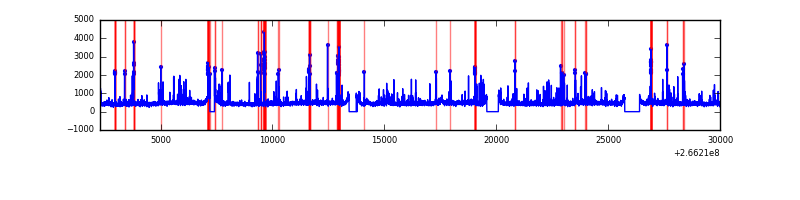 |
Top three noisy pixels from each quadrant. If the there are fewer than three noisy pixels in the level2.evt file, extra rows are filled as -1
| Pixel properties | Quadrant properties | ||||||
|---|---|---|---|---|---|---|---|
| Quadrant | DetID | PixID | Counts | Sigma | Mean | Median | Sigma |
| A | 0 | 23 | 14344307 | 23212.66 | 3061 | 2992 | 617.8 |
| A | 0 | 226 | 897690 | 1448.15 | 3061 | 2992 | 617.8 |
| A | 8 | 15 | 368664 | 591.87 | 3061 | 2992 | 617.8 |
| B | 10 | 16 | 2245013 | 3816.92 | 3082 | 3003 | 587.4 |
| B | 0 | 189 | 118745 | 197.05 | 3082 | 3003 | 587.4 |
| B | 0 | 205 | 92074 | 151.64 | 3082 | 3003 | 587.4 |
| C | 3 | 233 | 3588802 | 5135.38 | 3019 | 3035 | 698.2 |
| C | 13 | 61 | 21309 | 26.17 | 3019 | 3035 | 698.2 |
| C | 8 | 128 | 18611 | 22.31 | 3019 | 3035 | 698.2 |
| D | 10 | 199 | 550037 | 676.41 | 3018 | 2962 | 808.8 |
| D | 12 | 110 | 491970 | 604.61 | 3018 | 2962 | 808.8 |
| D | 1 | 52 | 210153 | 256.17 | 3018 | 2962 | 808.8 |
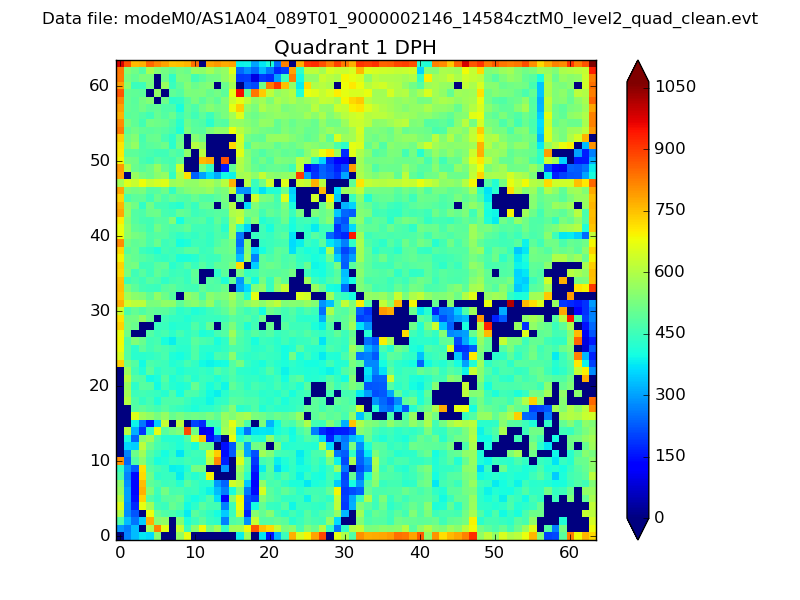
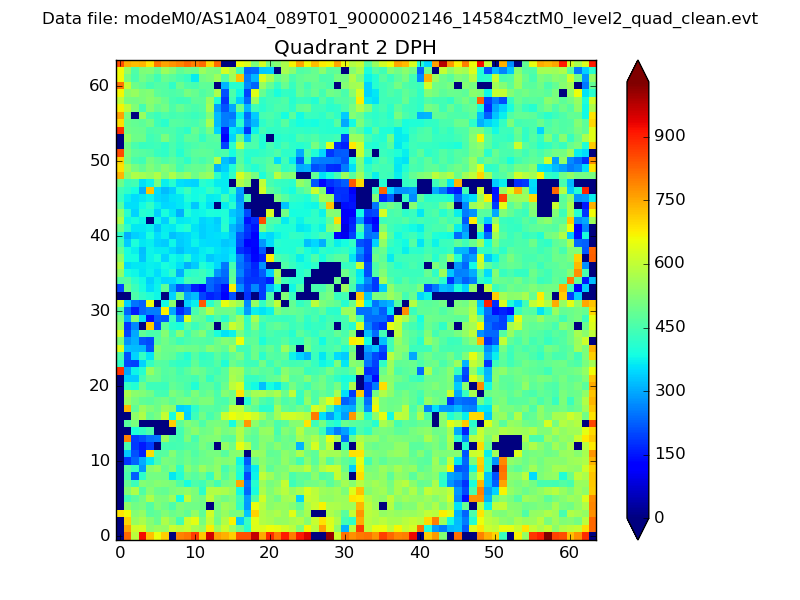
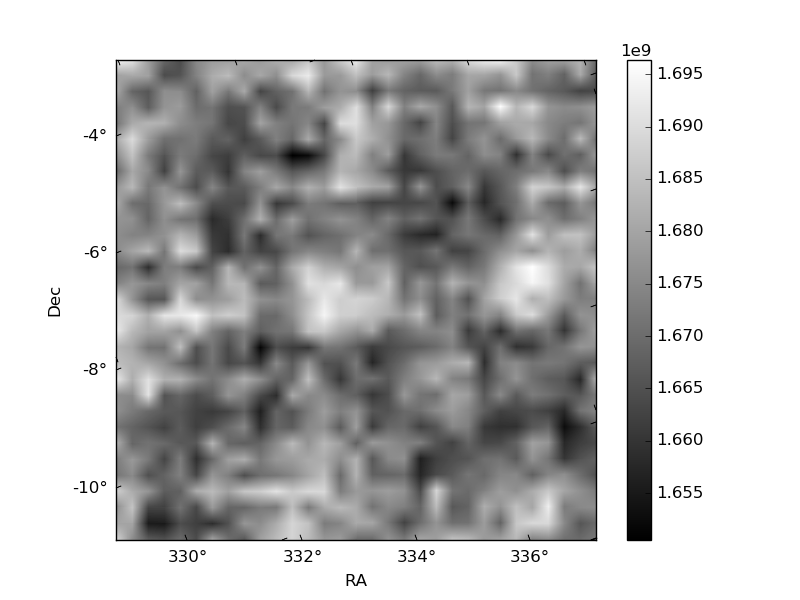
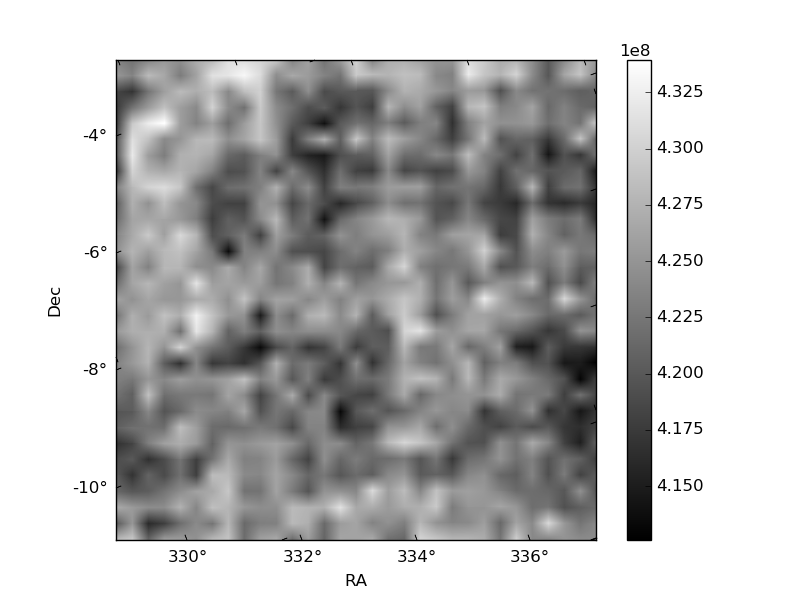
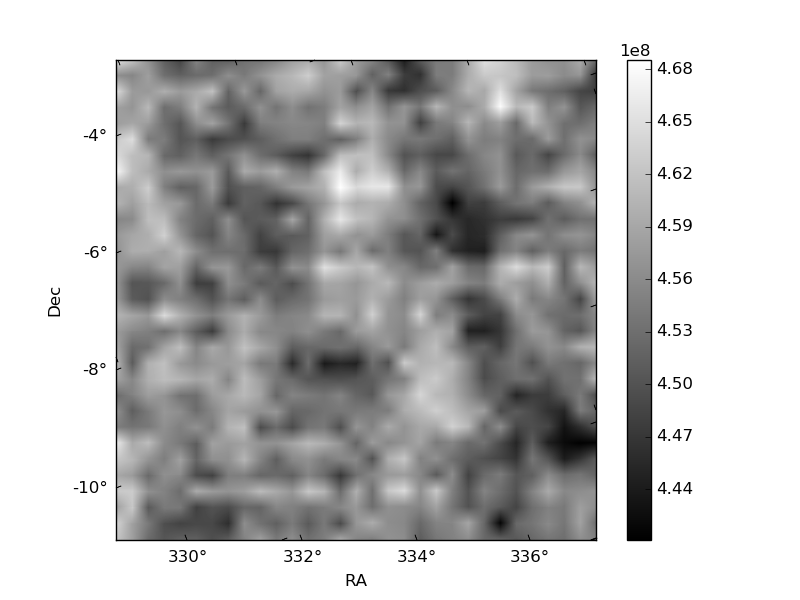
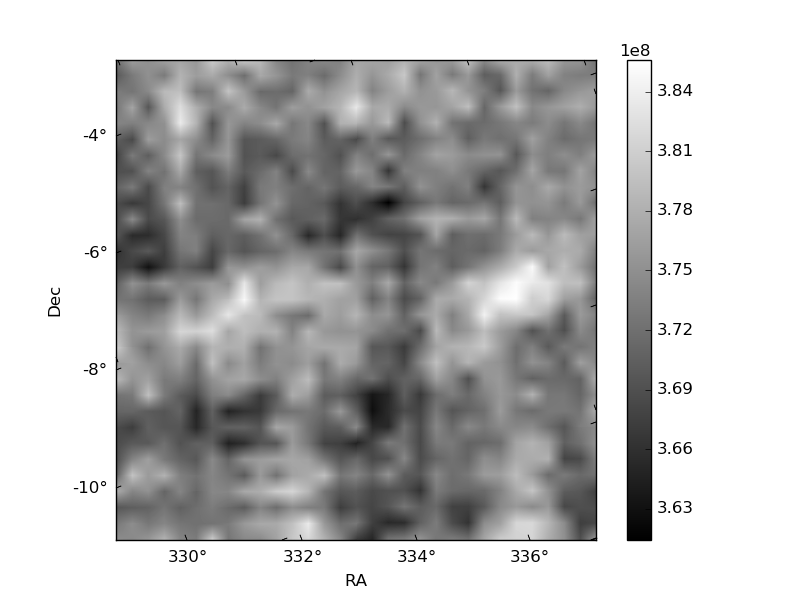
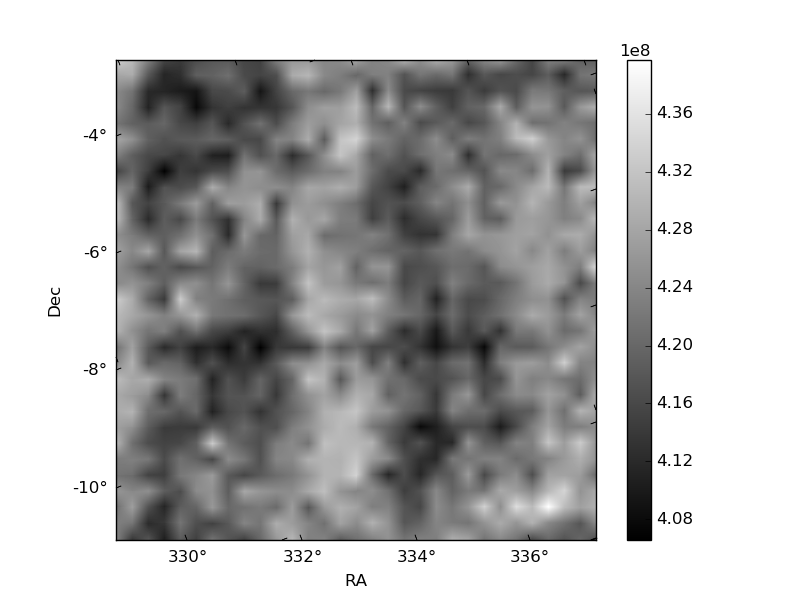
Histogram calculated using DETX and DETY for each event in the final _common_clean file
| Quadrant A | 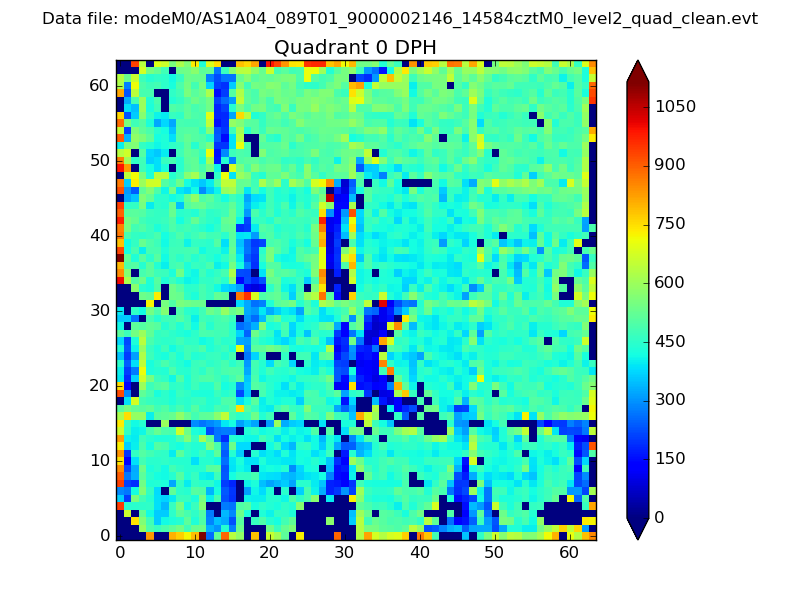 |
 |
Quadrant B |
|---|---|---|---|
| Quadrant D | 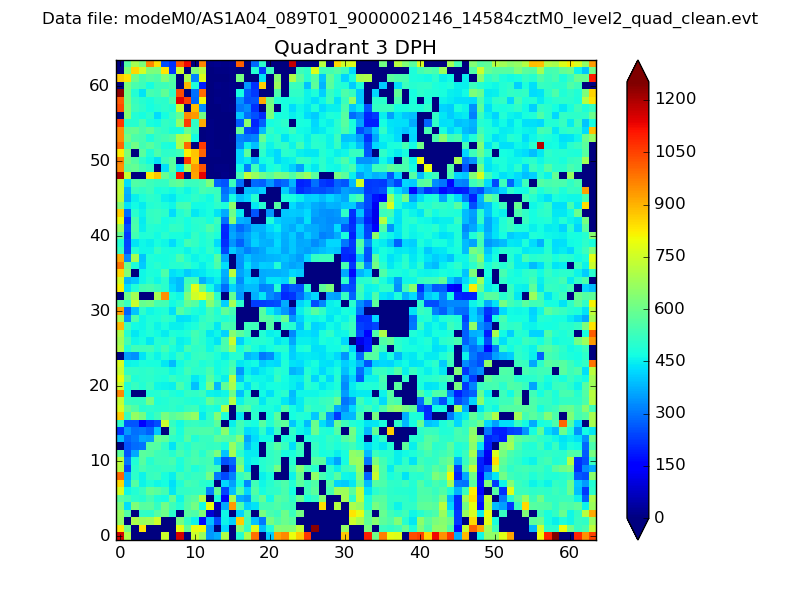 |
 |
Quadrant C |
| Plot type | Count rate plots | Images |
|---|---|---|
| Comparison with Poisson distribution Blue bars denote a histogram of data divided into 1 sec bins. Red curve is a Poisson curve with rate = median count rate of data. |
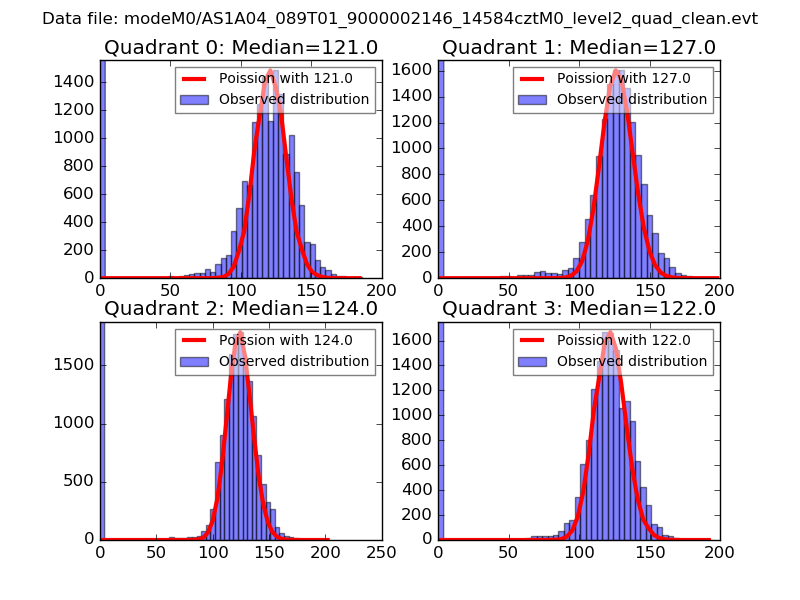 |
 |
| Quadrant-wise count rates Data is divided into 100 sec bins |
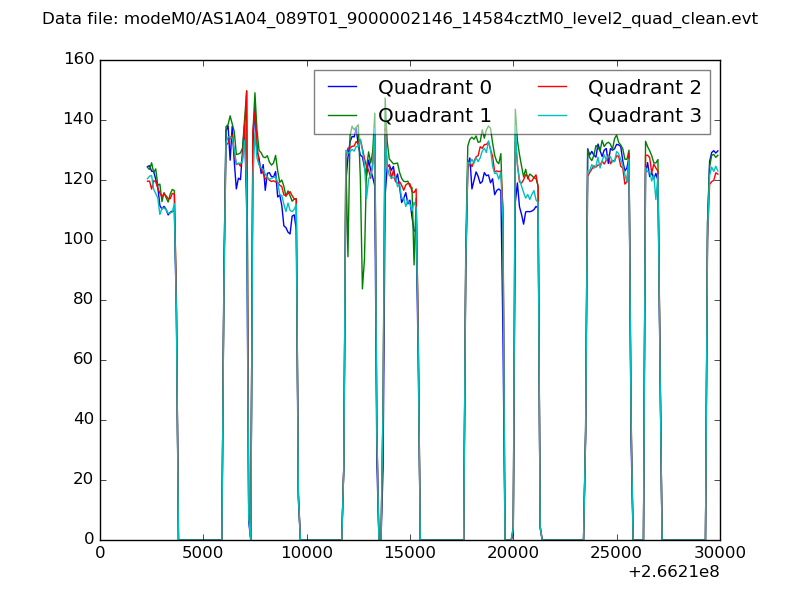 |
|
| Module-wise count rates for Quadrant A Data is divided into 100 sec bins |
 |
 |
| Module-wise count rates for Quadrant B Data is divided into 100 sec bins |
 |
 |
| Module-wise count rates for Quadrant C Data is divided into 100 sec bins |
 |
 |
| Module-wise count rates for Quadrant D Data is divided into 100 sec bins |
 |
 |
| Parameter | Plot |
|---|---|
| CZT HV Monitor |  |
| D_VDD | 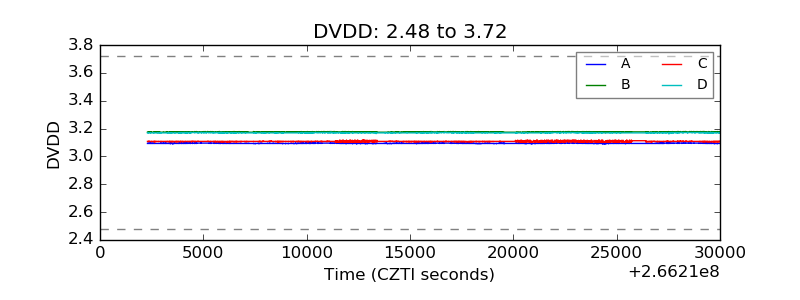 |
| Temperature 1 | 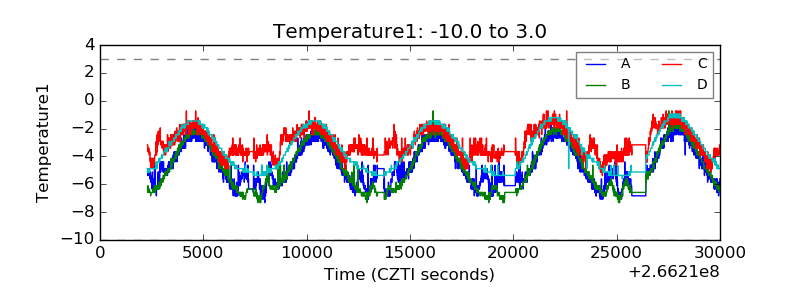 |
| Veto HV Monitor | 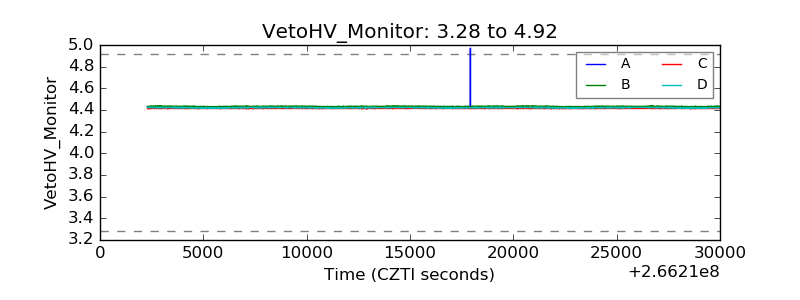 |
| Veto LLD |  |
| Alpha Counter | 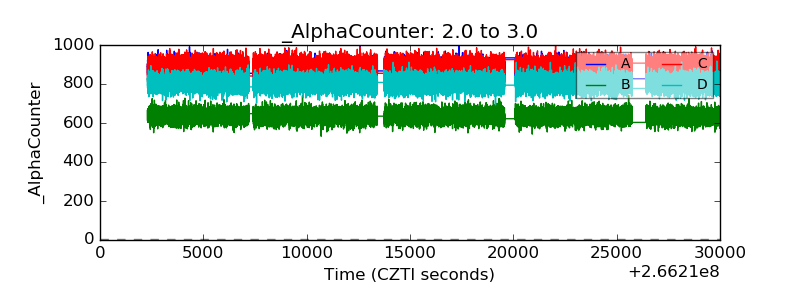 |
| _CPM_Rate | 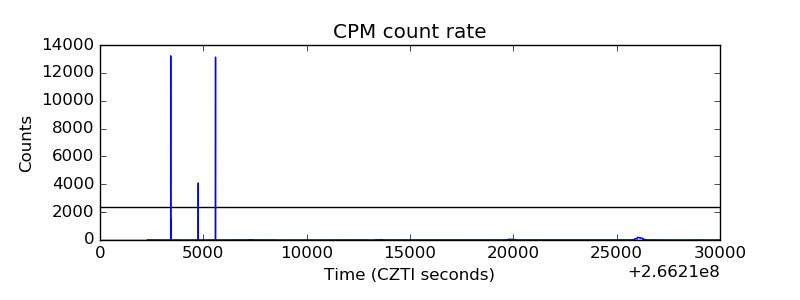 |
| CZT Counter | 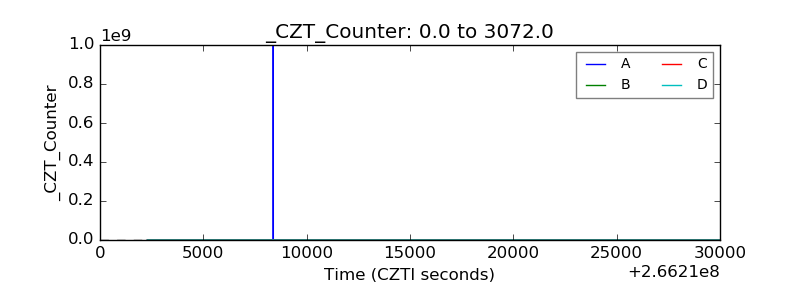 |
| +2.5 Volts monitor |  |
| +5 Volts monitor | 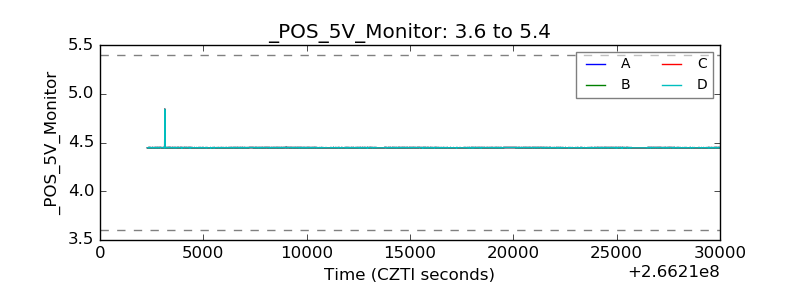 |
| _ROLL_ROT |  |
| _Roll_DEC | 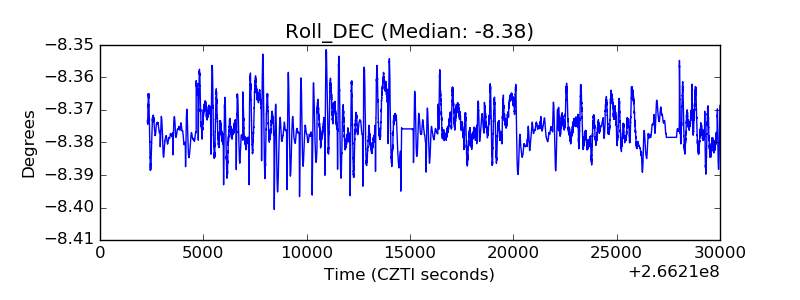 |
| _Roll_RA | 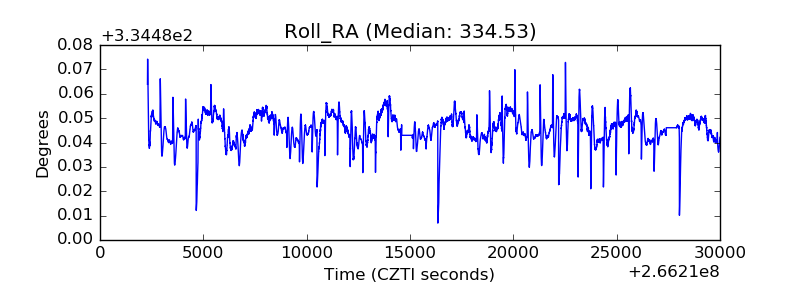 |
| Veto Counter |  |