| Param | Original file | Final file |
|---|---|---|
| Filename | modeM0/AS1A04_089T01_9000002146_14743cztM0_level2.evt | modeM0/AS1A04_089T01_9000002146_14743cztM0_level2_quad_clean.evt |
| Size (bytes) | 1,740,015,360 | 188,919,360 |
| Size | 1.6 GB | 180.2 MB |
| Events in quadrant A | 25,485,890 | 1,027,525 |
| Events in quadrant B | 9,899,497 | 1,225,847 |
| Events in quadrant C | 9,345,723 | 1,220,211 |
| Events in quadrant D | 6,946,823 | 1,201,389 |
| Mode SS | |||
|---|---|---|---|
| Quadrant | BADHDUFLAG | Total packets | Discarded packets |
| A | 0 | 318 | 6 |
| B | 0 | 318 | 10 |
| C | 0 | 318 | 12 |
| D | 0 | 319 | 11 |
| Mode M9 | |||
|---|---|---|---|
| Quadrant | BADHDUFLAG | Total packets | Discarded packets |
| A | 0 | 20 | 0 |
| B | 0 | 20 | 0 |
| C | 0 | 20 | 0 |
| D | 0 | 20 | 0 |
| Mode M0 | |||
|---|---|---|---|
| Quadrant | BADHDUFLAG | Total packets | Discarded packets |
| A | 0 | 88600 | 2512 |
| B | 0 | 40581 | 1183 |
| C | 0 | 38761 | 1117 |
| D | 0 | 32649 | 1131 |
| Quadrant | Total seconds | Saturated seconds | Saturation percentage |
|---|---|---|---|
| A | 15009 | 6605 | 44.006929% |
| B | 15159 | 1065 | 7.025529% |
| C | 15189 | 367 | 2.416222% |
| D | 15162 | 78 | 0.514444% |
Noise dominated data is calculated using 1-second bins in cleaned event files. If a bin has >2000 counts, and if more than 50% of those come from <1% of pixels, then it is considered to be noise-dominated and hence unusable.
| Quadrant | # 1 sec bins | Bins with >0 counts | Bins with >2000 counts | High rate bins dominated by noise | Noise dominated (total time) | Noise dominated (detector-on time) | Marked lightcurve |
|---|---|---|---|---|---|---|---|
| A | 17574 | 15319 | 5539 | 5539 | 31.52% | 36.16% | 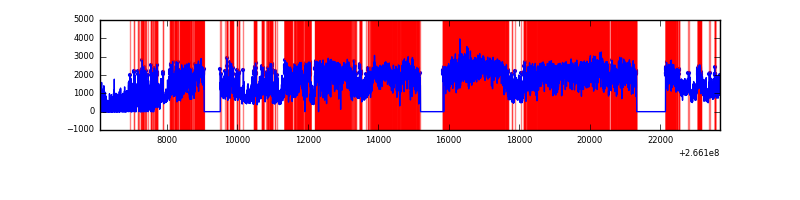 |
| B | 17597 | 15425 | 609 | 609 | 3.46% | 3.95% | 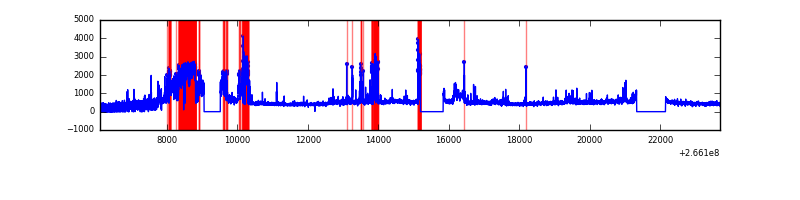 |
| C | 17594 | 15451 | 190 | 190 | 1.08% | 1.23% | 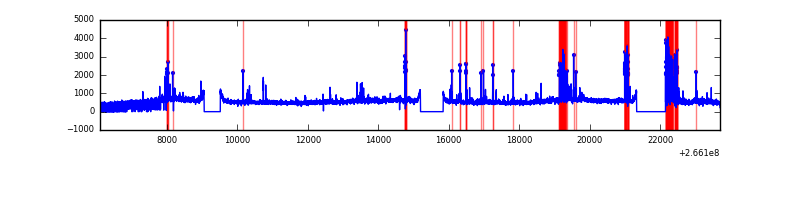 |
| D | 17576 | 15420 | 13 | 13 | 0.07% | 0.08% | 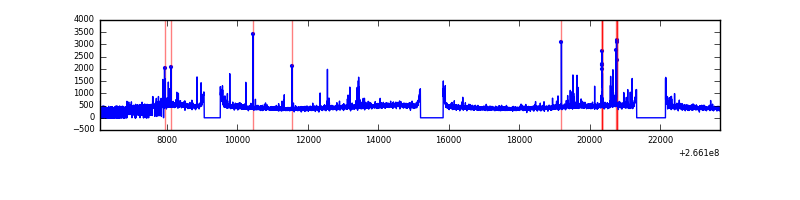 |
Top three noisy pixels from each quadrant. If the there are fewer than three noisy pixels in the level2.evt file, extra rows are filled as -1
| Pixel properties | Quadrant properties | ||||||
|---|---|---|---|---|---|---|---|
| Quadrant | DetID | PixID | Counts | Sigma | Mean | Median | Sigma |
| A | 8 | 15 | 19072405 | 59226.49 | 1596 | 1561 | 322.0 |
| A | 12 | 189 | 144140 | 442.79 | 1596 | 1561 | 322.0 |
| A | 13 | 248 | 43315 | 129.67 | 1596 | 1561 | 322.0 |
| B | 10 | 16 | 2624474 | 7707.56 | 1778 | 1734 | 340.3 |
| B | 0 | 229 | 89376 | 257.56 | 1778 | 1734 | 340.3 |
| B | 0 | 214 | 46181 | 130.62 | 1778 | 1734 | 340.3 |
| C | 3 | 233 | 1554481 | 3846.13 | 1748 | 1762 | 403.7 |
| C | 4 | 254 | 876166 | 2165.93 | 1748 | 1762 | 403.7 |
| C | 6 | 96 | 61316 | 147.52 | 1748 | 1762 | 403.7 |
| D | 10 | 70 | 101330 | 222.68 | 1764 | 1718 | 447.3 |
| D | 2 | 234 | 66484 | 144.78 | 1764 | 1718 | 447.3 |
| D | 2 | 120 | 52366 | 113.22 | 1764 | 1718 | 447.3 |
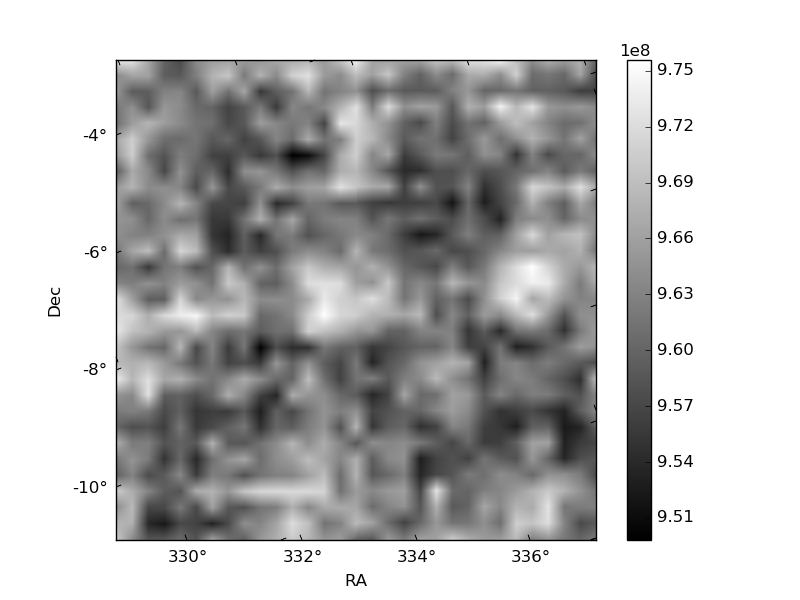
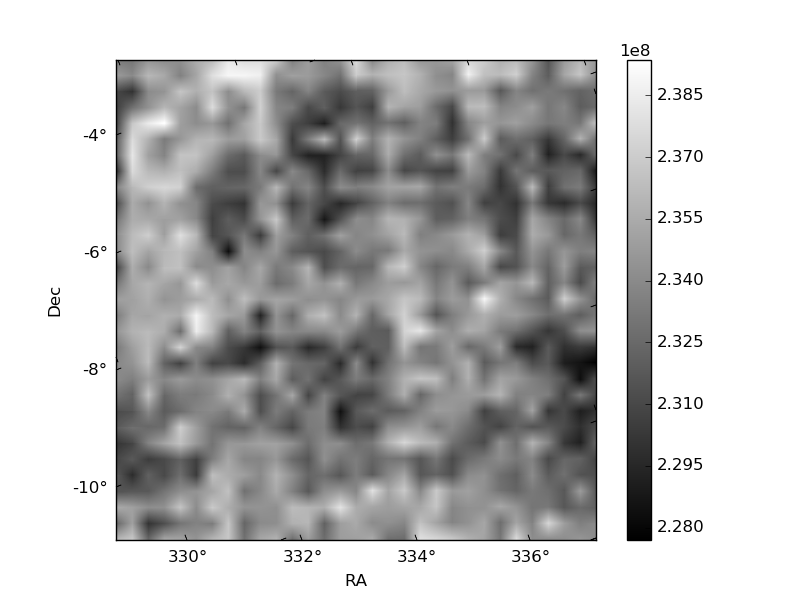
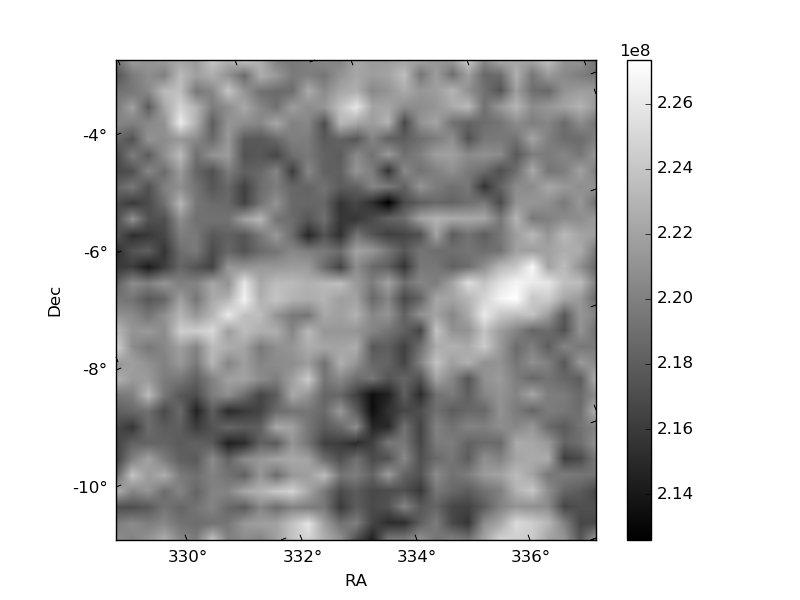
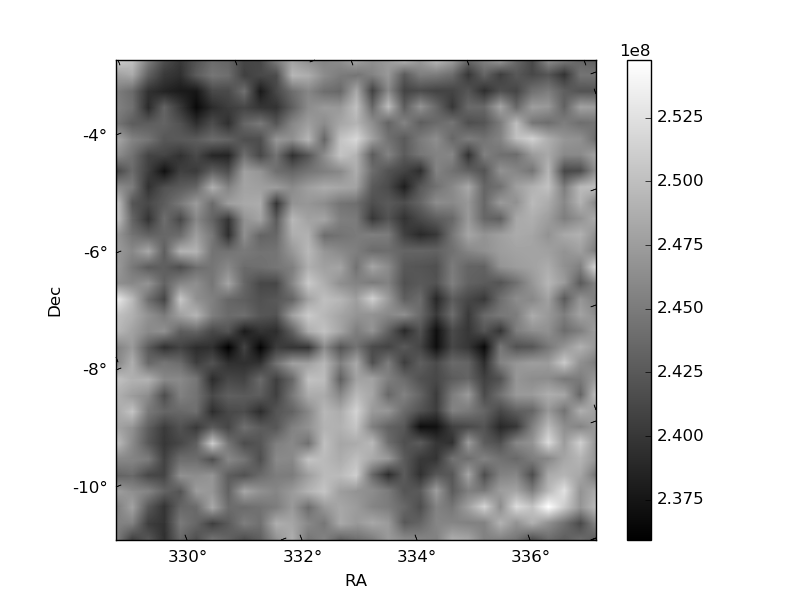
Histogram calculated using DETX and DETY for each event in the final _common_clean file
| Quadrant A | 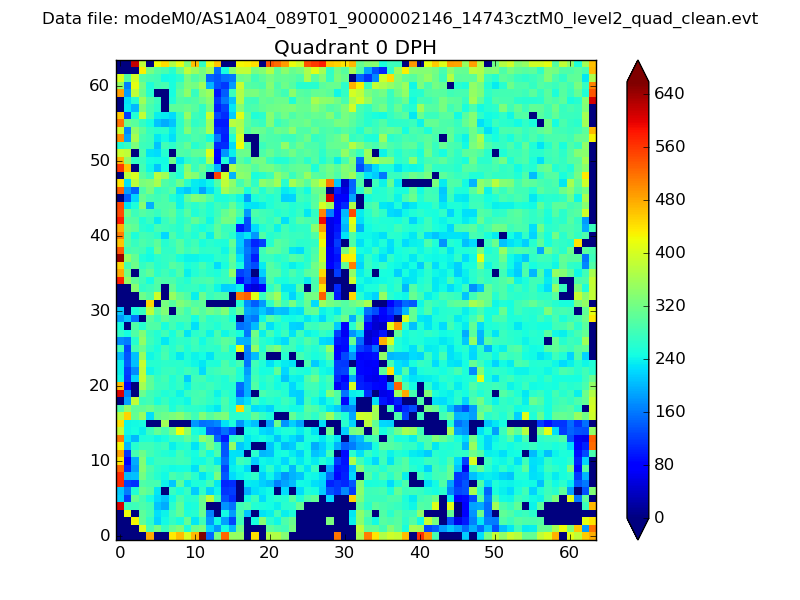 |
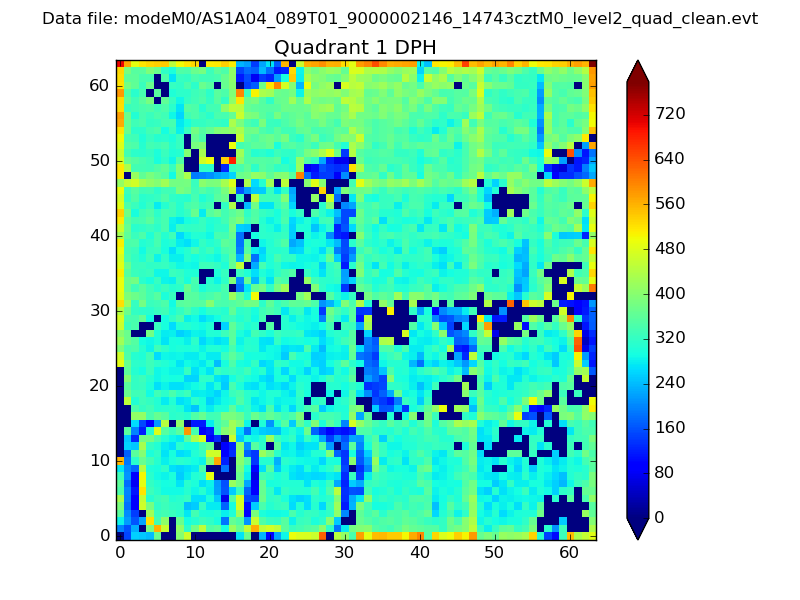 |
Quadrant B |
|---|---|---|---|
| Quadrant D | 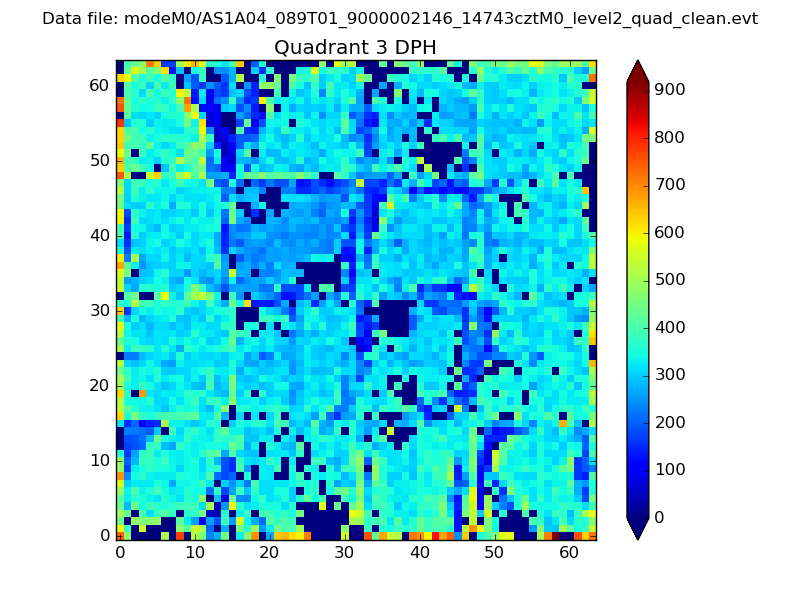 |
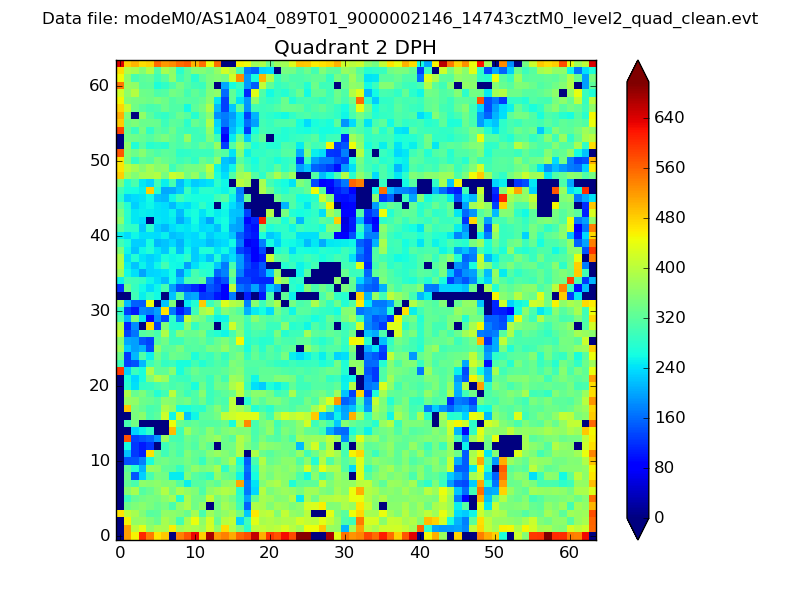 |
Quadrant C |
| Plot type | Count rate plots | Images |
|---|---|---|
| Comparison with Poisson distribution Blue bars denote a histogram of data divided into 1 sec bins. Red curve is a Poisson curve with rate = median count rate of data. |
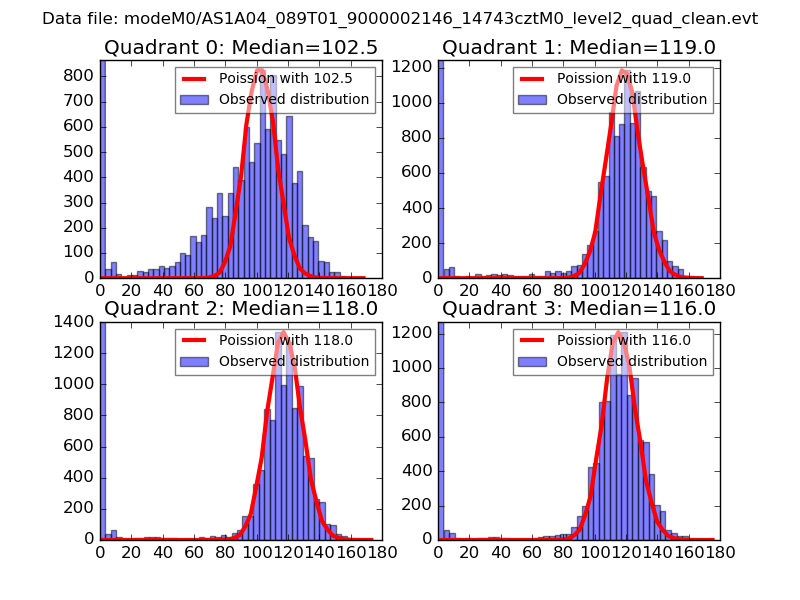 |
 |
| Quadrant-wise count rates Data is divided into 100 sec bins |
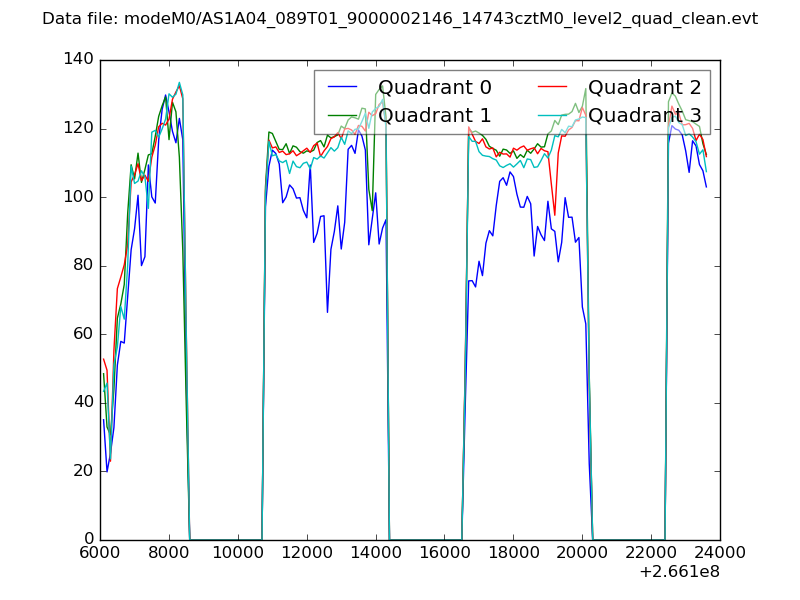 |
|
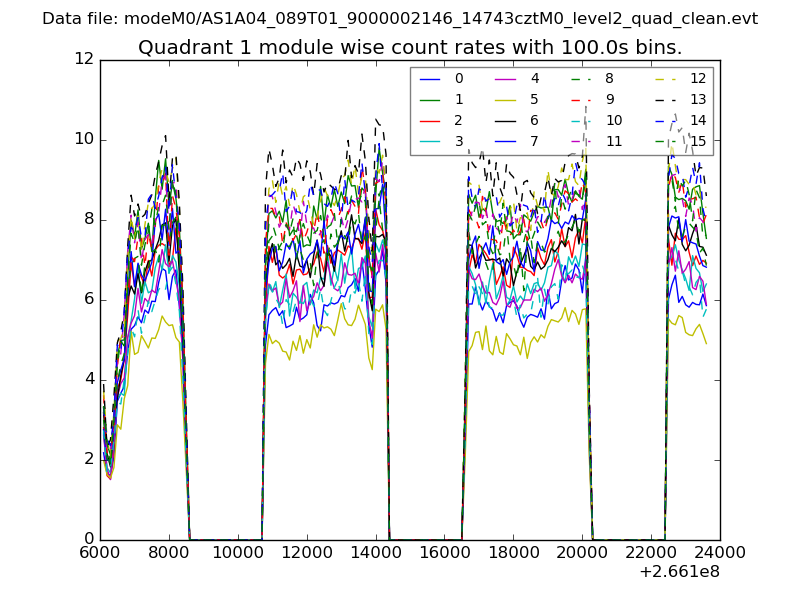
| Module-wise count rates for Quadrant A Data is divided into 100 sec bins |
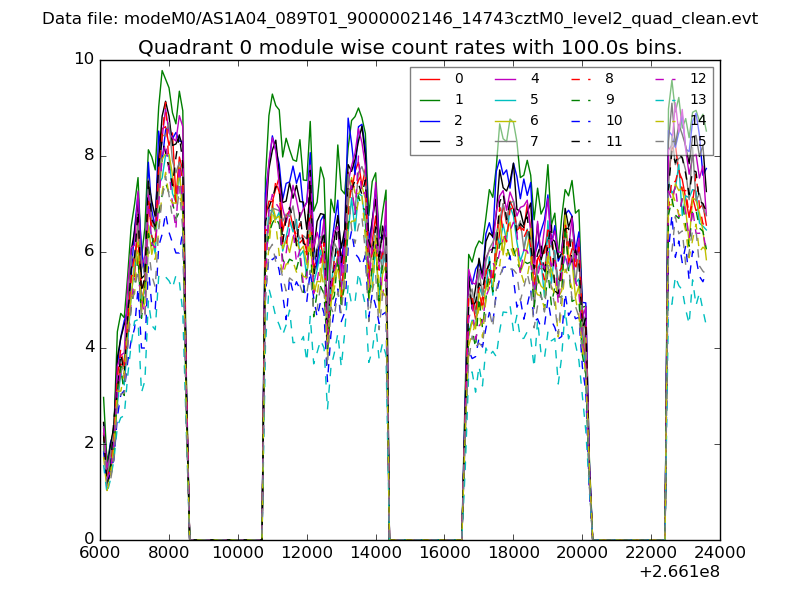 |
 |
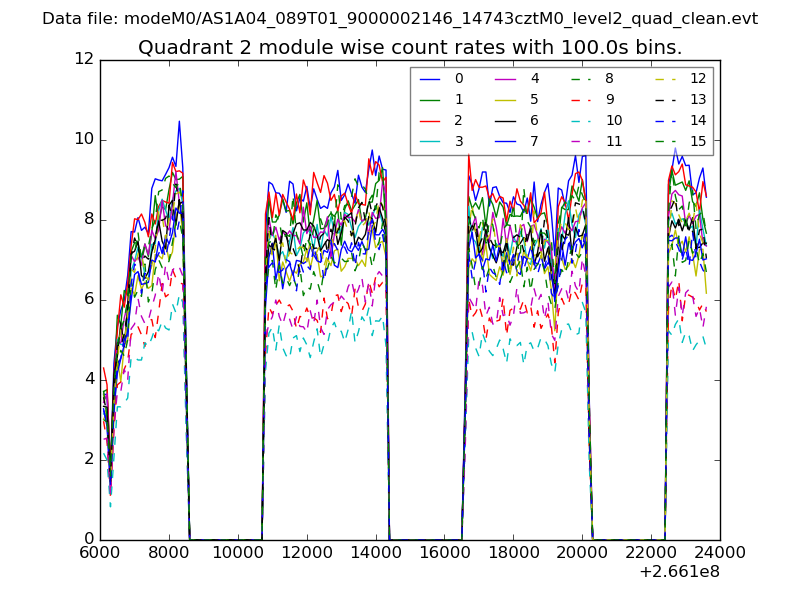
| Module-wise count rates for Quadrant B Data is divided into 100 sec bins |
 |
 |
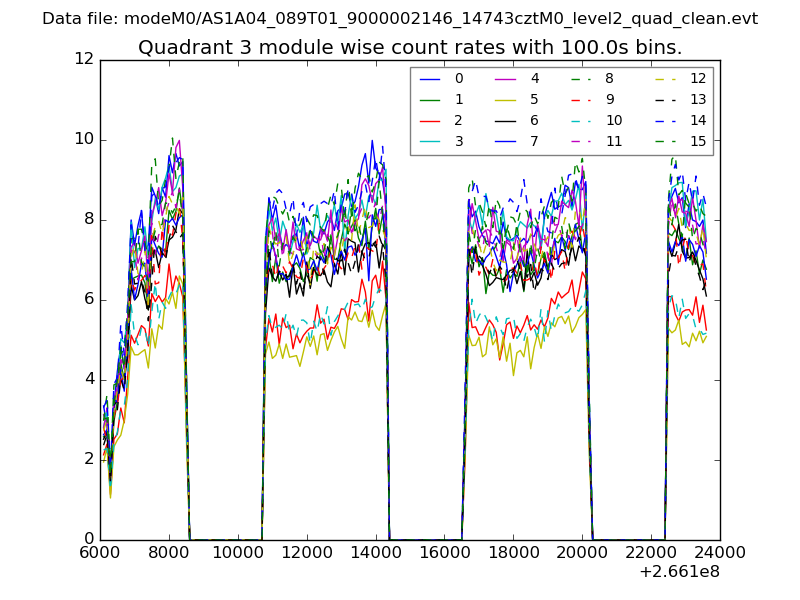
| Module-wise count rates for Quadrant C Data is divided into 100 sec bins |
 |
 |
| Module-wise count rates for Quadrant D Data is divided into 100 sec bins |
 |
 |
| Parameter | Plot |
|---|---|
| CZT HV Monitor | 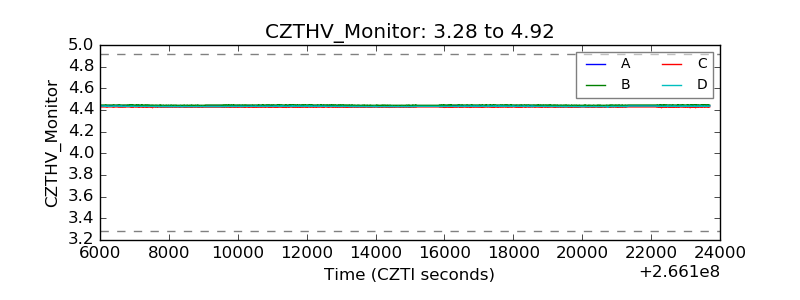 |
| D_VDD | 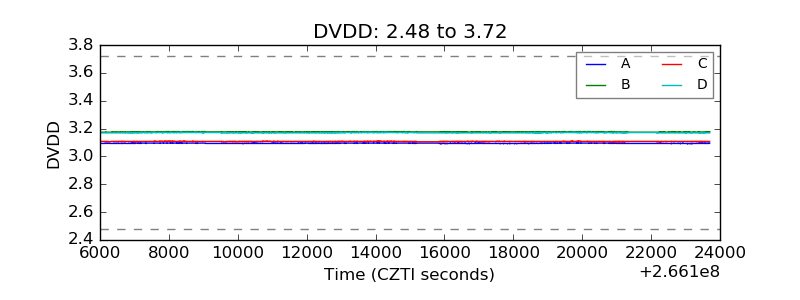 |
| Temperature 1 | 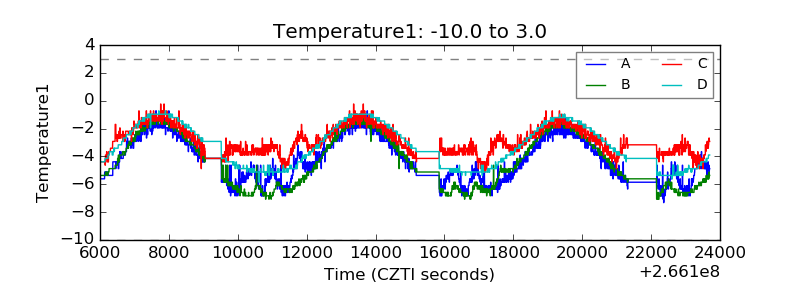 |
| Veto HV Monitor | 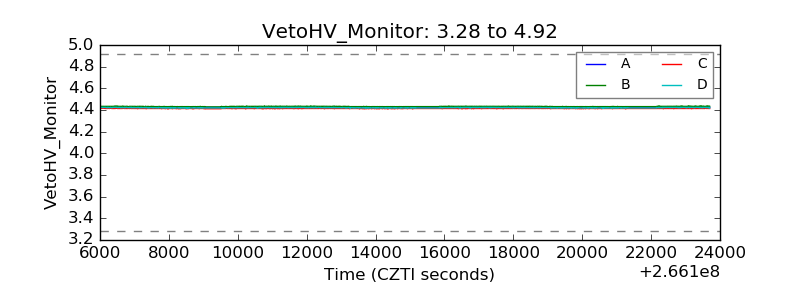 |
| Veto LLD | 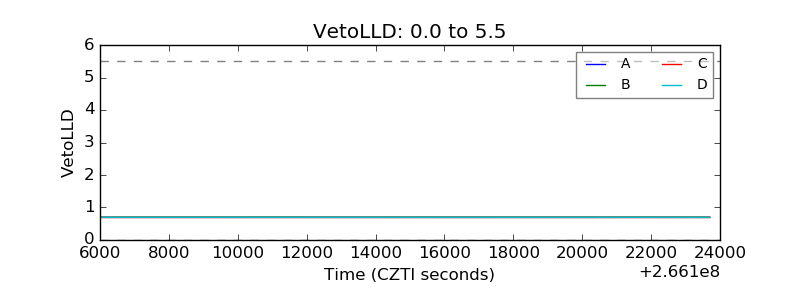 |
| Alpha Counter | 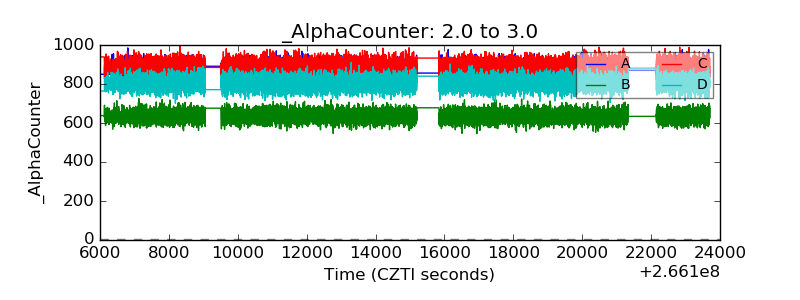 |
| _CPM_Rate | 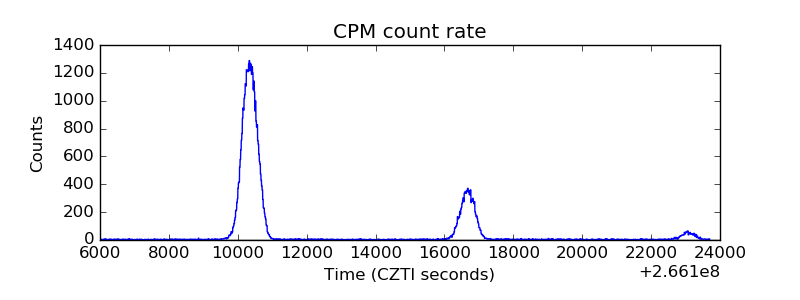 |
| CZT Counter | 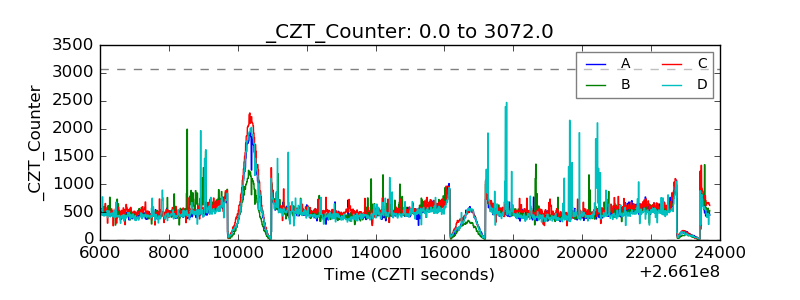 |
| +2.5 Volts monitor |  |
| +5 Volts monitor | 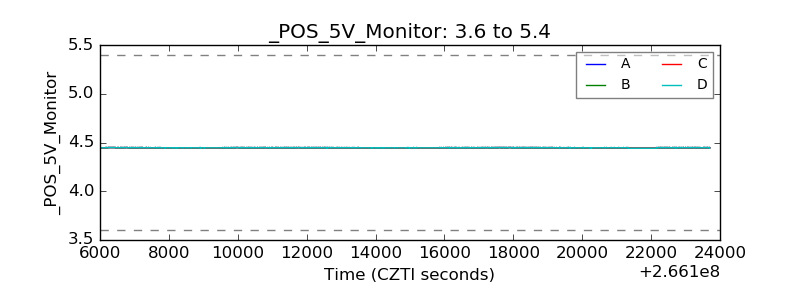 |
| _ROLL_ROT | 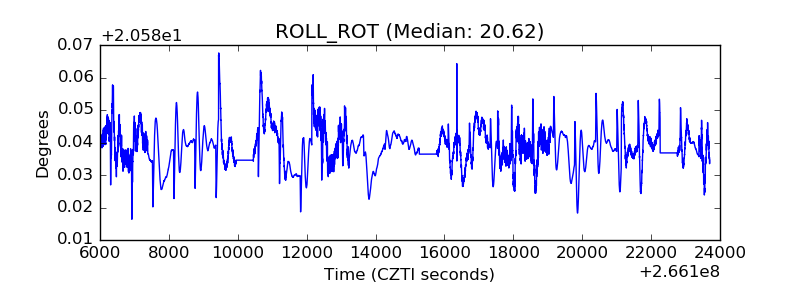 |
| _Roll_DEC |  |
| _Roll_RA | 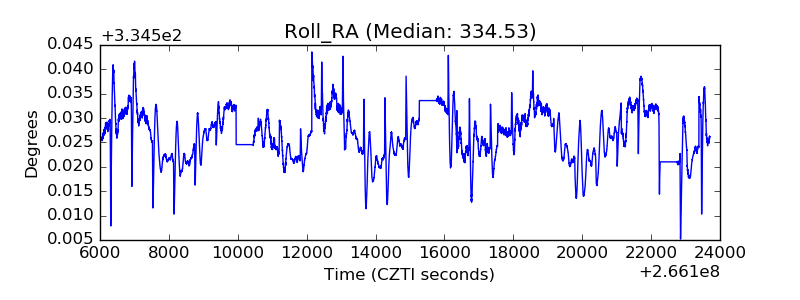 |
| Veto Counter | 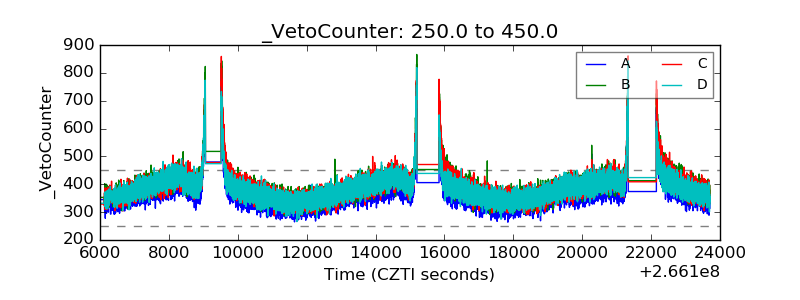 |