| Param | Original file | Final file |
|---|---|---|
| Filename | modeM0/AS1G08_055T02_9000002148_14585cztM0_level2.evt | modeM0/AS1G08_055T02_9000002148_14585cztM0_level2_quad_clean.evt |
| Size (bytes) | 522,339,840 | 71,026,560 |
| Size | 498.1 MB | 67.7 MB |
| Events in quadrant A | 4,275,265 | 429,381 |
| Events in quadrant B | 3,397,531 | 426,755 |
| Events in quadrant C | 3,950,048 | 416,656 |
| Events in quadrant D | 3,749,217 | 417,846 |
| Mode SS | |||
|---|---|---|---|
| Quadrant | BADHDUFLAG | Total packets | Discarded packets |
| A | 0 | 134 | 0 |
| B | 0 | 134 | 0 |
| C | 0 | 134 | 0 |
| D | 0 | 134 | 0 |
| Mode M9 | |||
|---|---|---|---|
| Quadrant | BADHDUFLAG | Total packets | Discarded packets |
| A | 0 | 15 | 0 |
| B | 0 | 15 | 0 |
| C | 0 | 15 | 0 |
| D | 0 | 16 | 0 |
| Mode M0 | |||
|---|---|---|---|
| Quadrant | BADHDUFLAG | Total packets | Discarded packets |
| A | 0 | 17297 | 3 |
| B | 0 | 14267 | 2 |
| C | 0 | 16396 | 2 |
| D | 0 | 15612 | 2 |
| Quadrant | Total seconds | Saturated seconds | Saturation percentage |
|---|---|---|---|
| A | 6596 | 79 | 1.197696% |
| B | 6596 | 75 | 1.137053% |
| C | 6596 | 59 | 0.894482% |
| D | 6596 | 53 | 0.803517% |
Noise dominated data is calculated using 1-second bins in cleaned event files. If a bin has >2000 counts, and if more than 50% of those come from <1% of pixels, then it is considered to be noise-dominated and hence unusable.
| Quadrant | # 1 sec bins | Bins with >0 counts | Bins with >2000 counts | High rate bins dominated by noise | Noise dominated (total time) | Noise dominated (detector-on time) | Marked lightcurve |
|---|---|---|---|---|---|---|---|
| A | 7617 | 6597 | 2 | 2 | 0.03% | 0.03% | 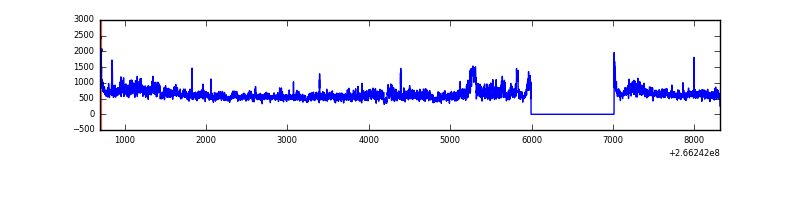 |
| B | 7617 | 6597 | 8 | 8 | 0.11% | 0.12% | 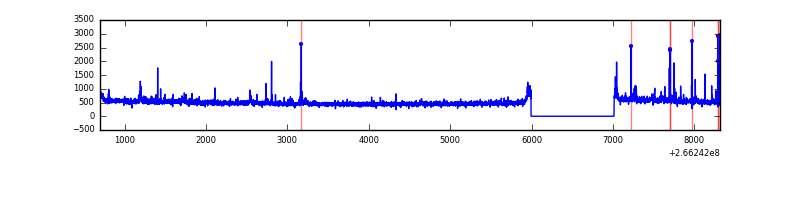 |
| C | 7617 | 6597 | 0 | 0 | 0.00% | 0.00% | 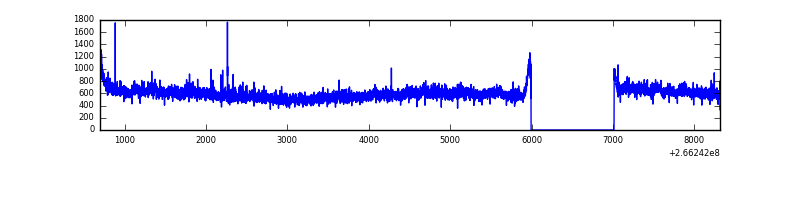 |
| D | 7617 | 6597 | 8 | 8 | 0.11% | 0.12% | 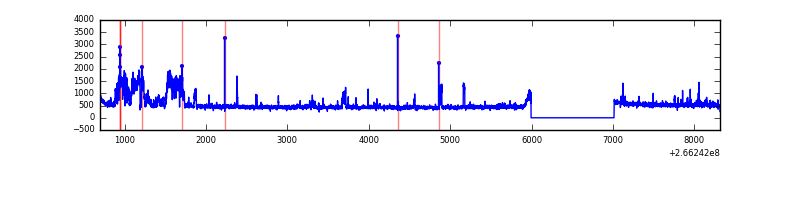 |
Top three noisy pixels from each quadrant. If the there are fewer than three noisy pixels in the level2.evt file, extra rows are filled as -1
| Pixel properties | Quadrant properties | ||||||
|---|---|---|---|---|---|---|---|
| Quadrant | DetID | PixID | Counts | Sigma | Mean | Median | Sigma |
| A | 0 | 23 | 953940 | 5706.62 | 825 | 809 | 167.0 |
| A | 0 | 226 | 63541 | 375.59 | 825 | 809 | 167.0 |
| A | 8 | 15 | 48652 | 286.45 | 825 | 809 | 167.0 |
| B | 10 | 16 | 57041 | 356.09 | 821 | 802 | 157.9 |
| B | 0 | 229 | 41204 | 255.81 | 821 | 802 | 157.9 |
| B | 0 | 189 | 37408 | 231.78 | 821 | 802 | 157.9 |
| C | 3 | 233 | 837241 | 4504.09 | 797 | 801 | 185.7 |
| C | 13 | 61 | 5696 | 26.36 | 797 | 801 | 185.7 |
| C | 3 | 232 | 4286 | 18.77 | 797 | 801 | 185.7 |
| D | 12 | 110 | 619291 | 2977.62 | 797 | 781 | 207.7 |
| D | 2 | 152 | 38892 | 183.47 | 797 | 781 | 207.7 |
| D | 2 | 234 | 24496 | 114.17 | 797 | 781 | 207.7 |
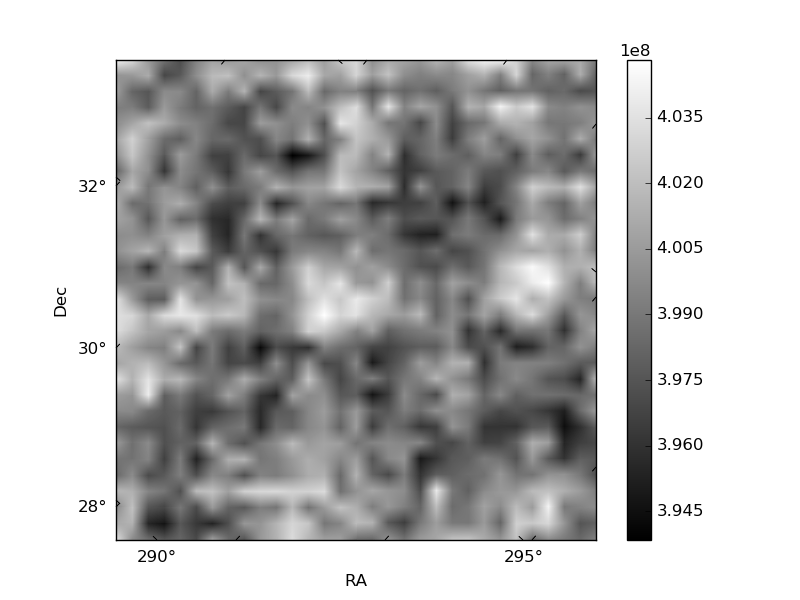
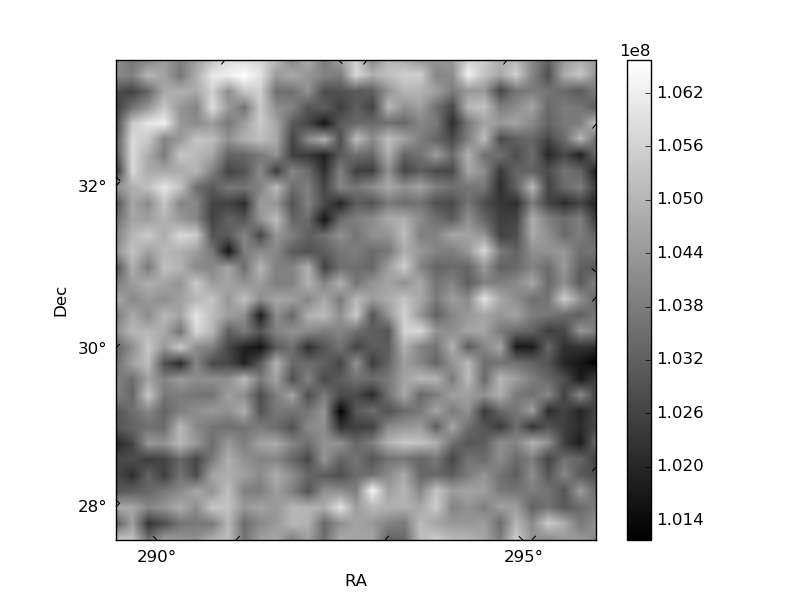
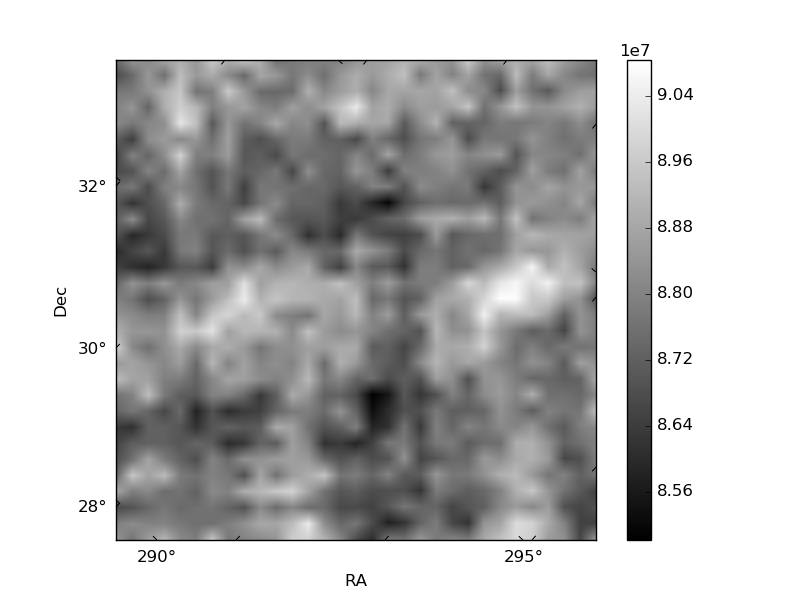
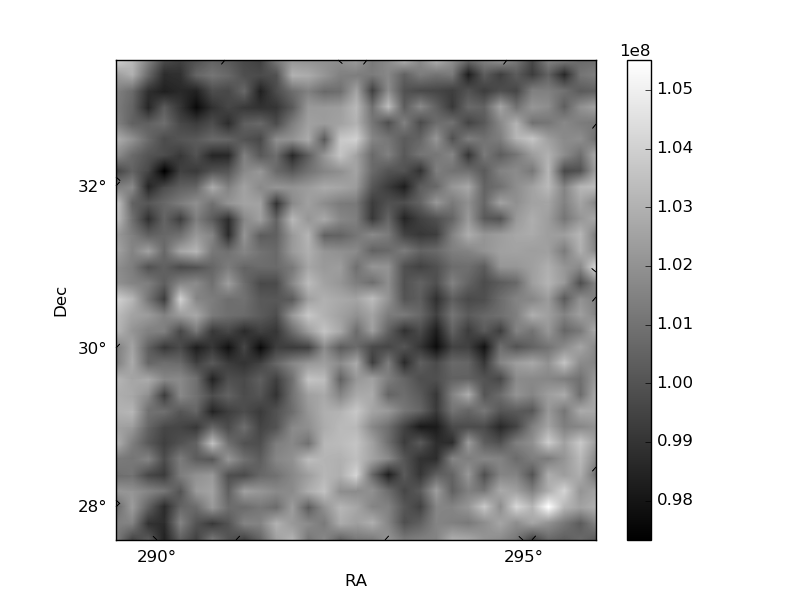
Histogram calculated using DETX and DETY for each event in the final _common_clean file
| Quadrant A | 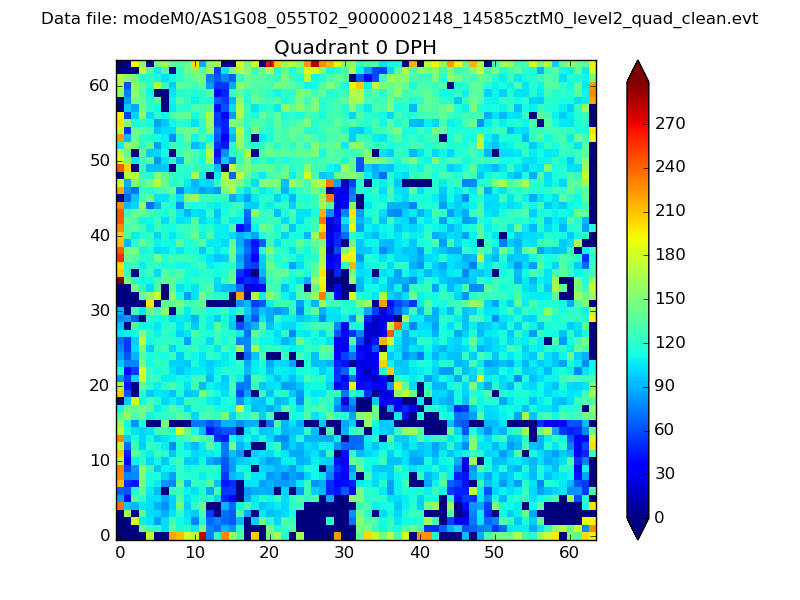 |
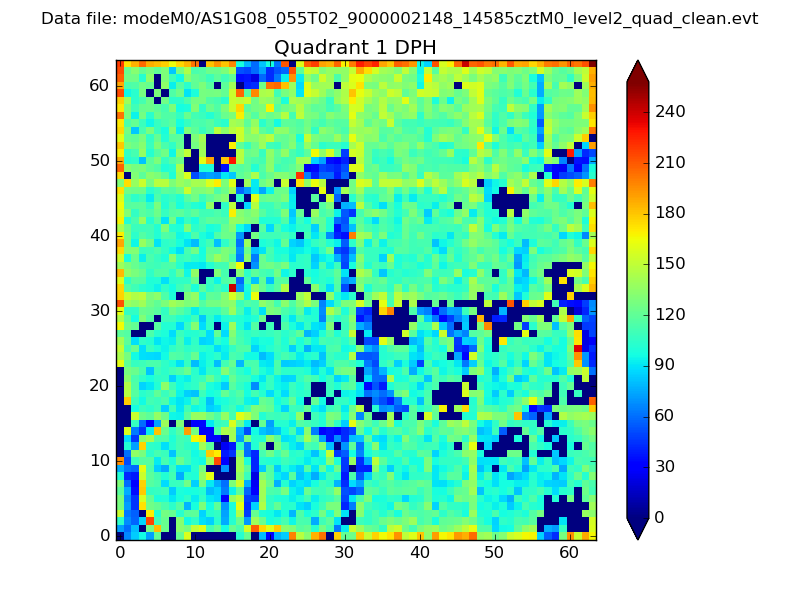 |
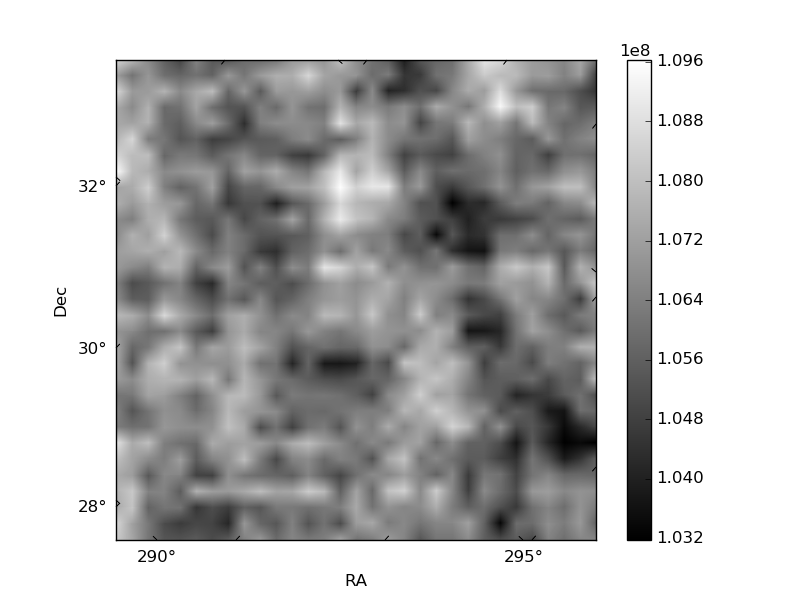
Quadrant B |
|---|---|---|---|
| Quadrant D | 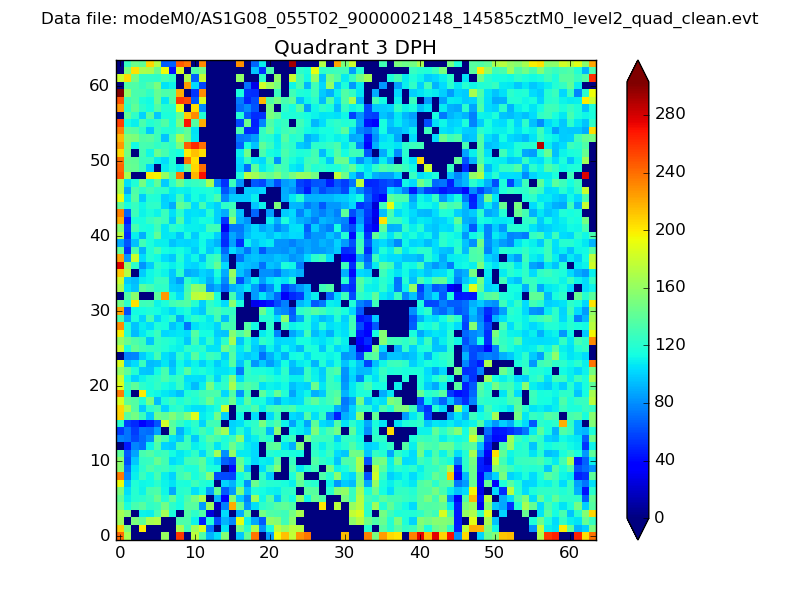 |
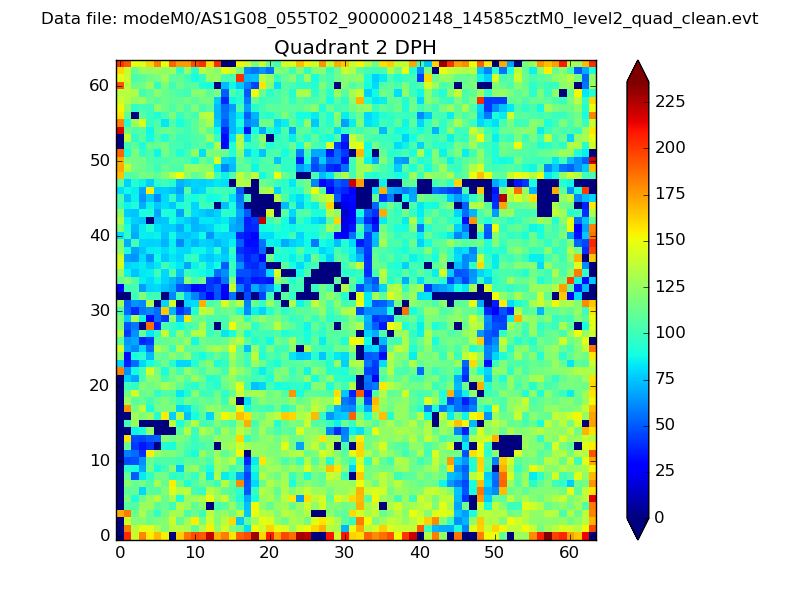 |
Quadrant C |
| Plot type | Count rate plots | Images |
|---|---|---|
| Comparison with Poisson distribution Blue bars denote a histogram of data divided into 1 sec bins. Red curve is a Poisson curve with rate = median count rate of data. |
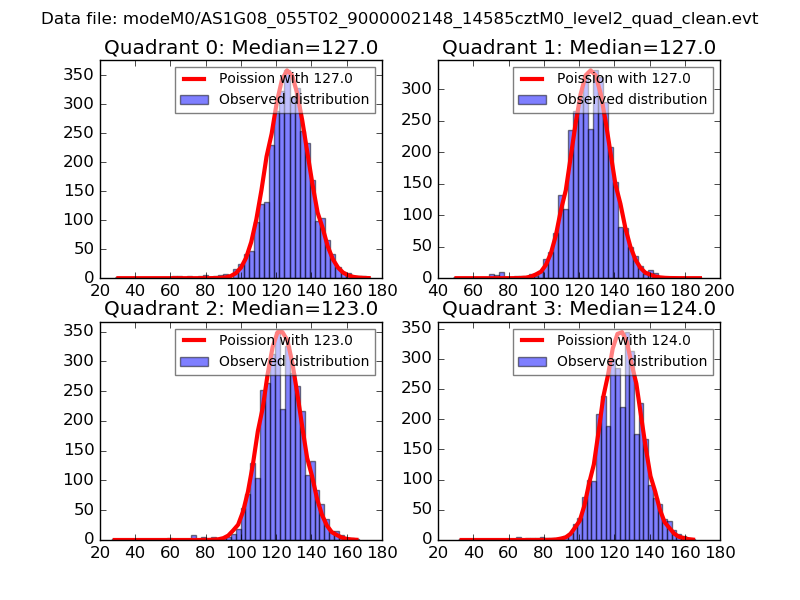 |
 |
| Quadrant-wise count rates Data is divided into 100 sec bins |
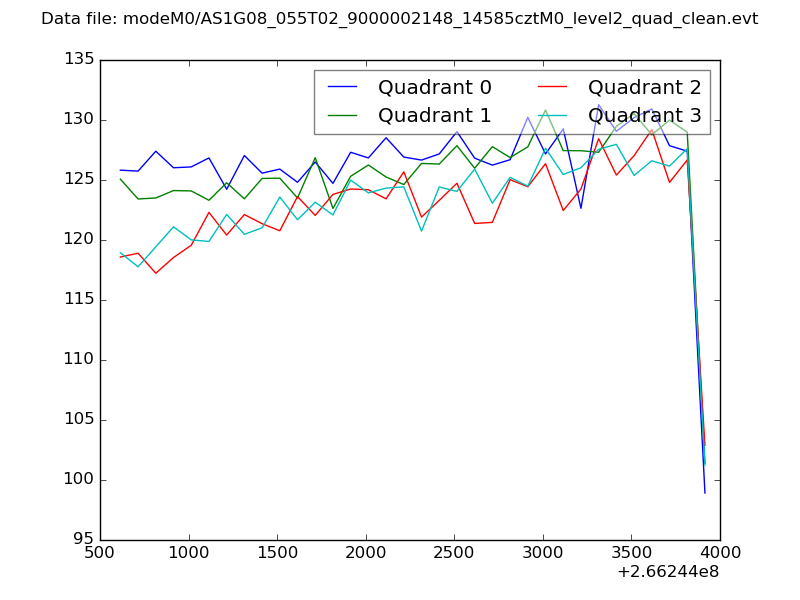 |
|
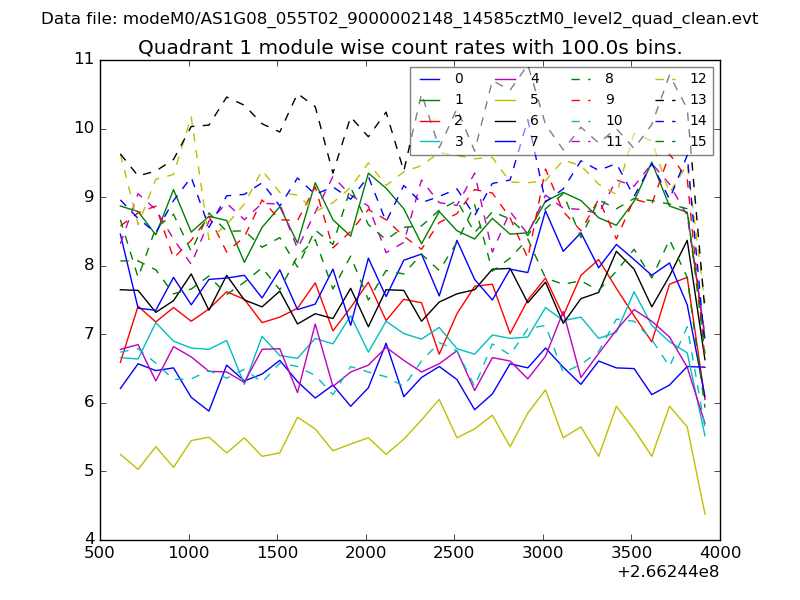
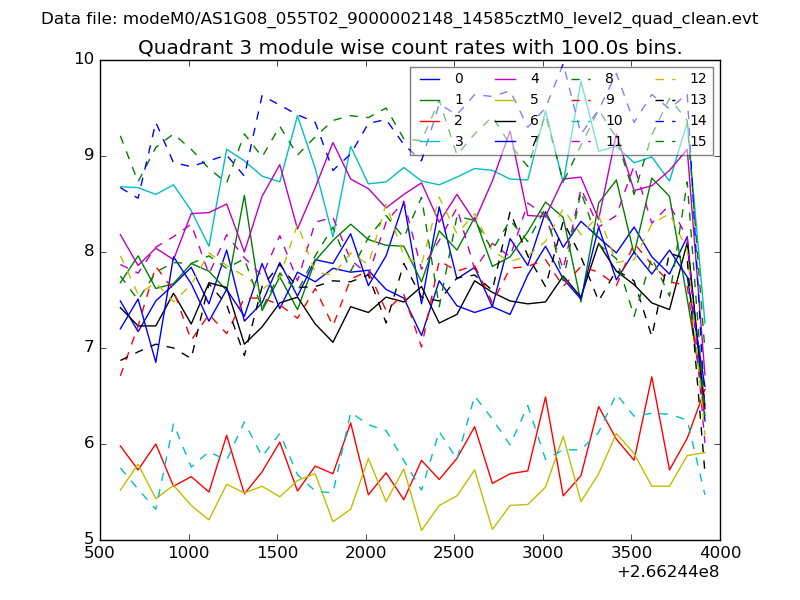
| Module-wise count rates for Quadrant A Data is divided into 100 sec bins |
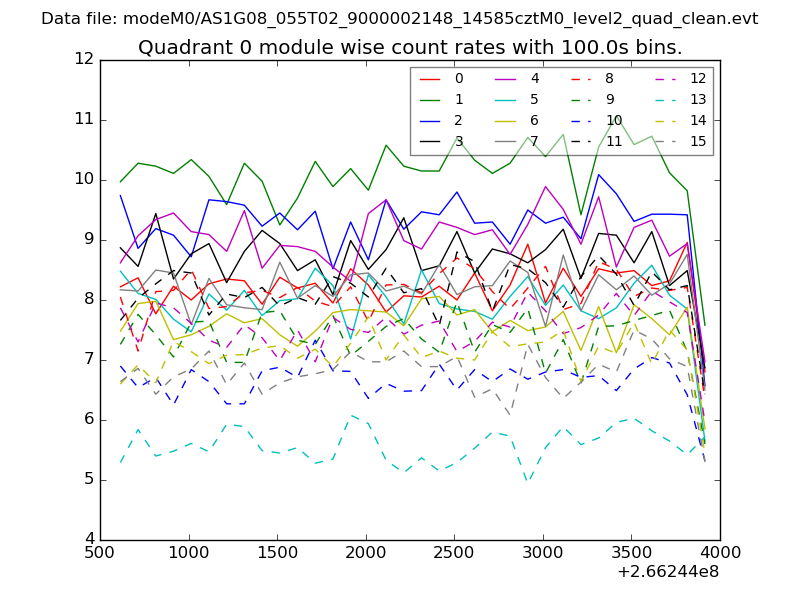 |
 |
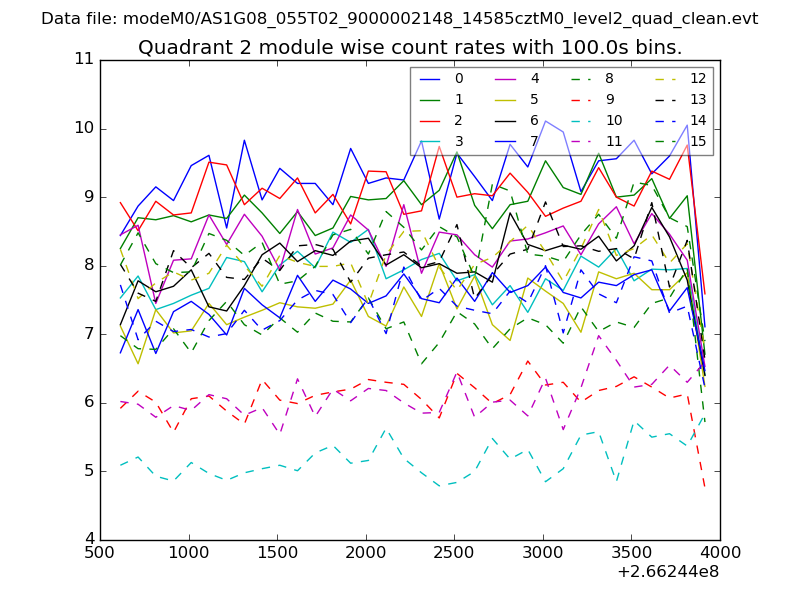
| Module-wise count rates for Quadrant B Data is divided into 100 sec bins |
 |
 |
| Module-wise count rates for Quadrant C Data is divided into 100 sec bins |
 |
 |
| Module-wise count rates for Quadrant D Data is divided into 100 sec bins |
 |
 |
| Parameter | Plot |
|---|---|
| CZT HV Monitor | 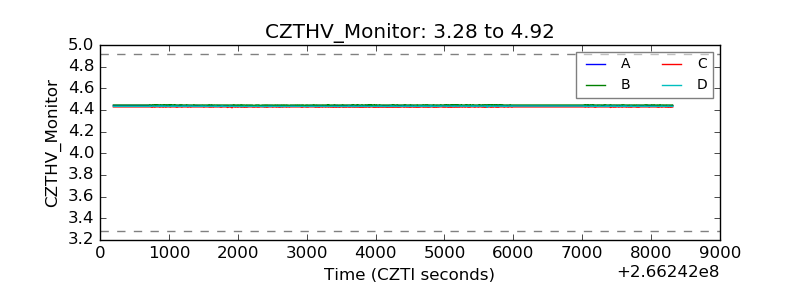 |
| D_VDD | 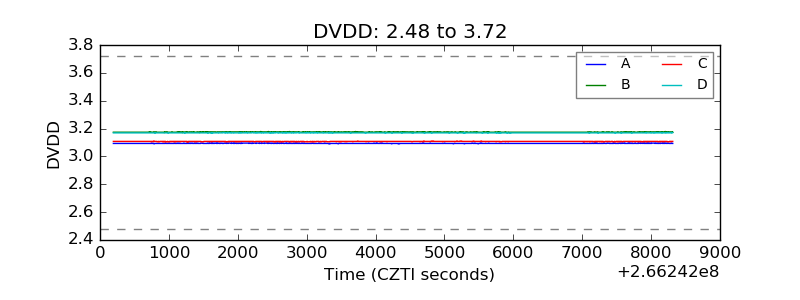 |
| Temperature 1 | 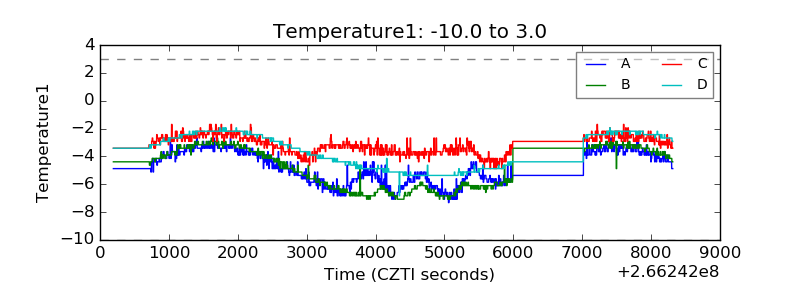 |
| Veto HV Monitor | 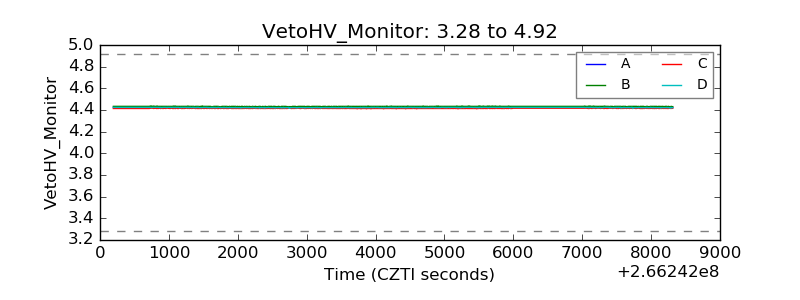 |
| Veto LLD | 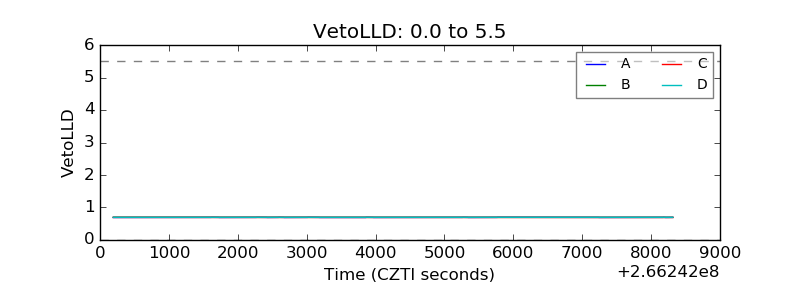 |
| Alpha Counter | 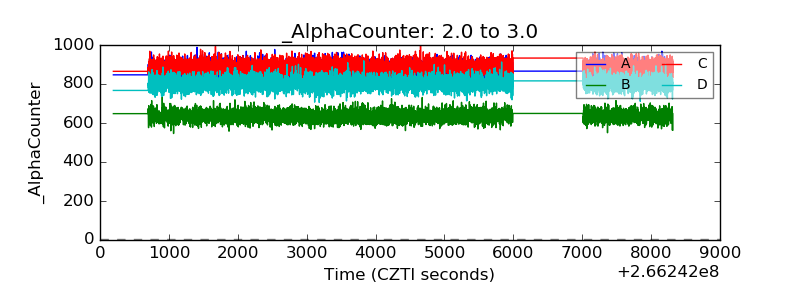 |
| _CPM_Rate | 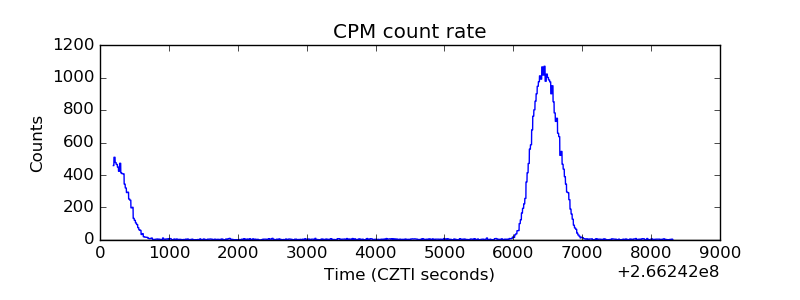 |
| CZT Counter | 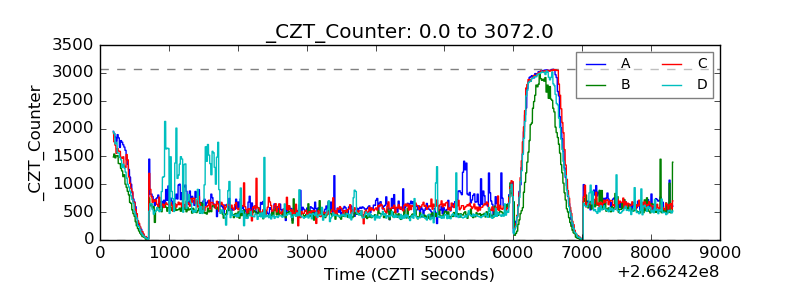 |
| +2.5 Volts monitor |  |
| +5 Volts monitor |  |
| _ROLL_ROT | 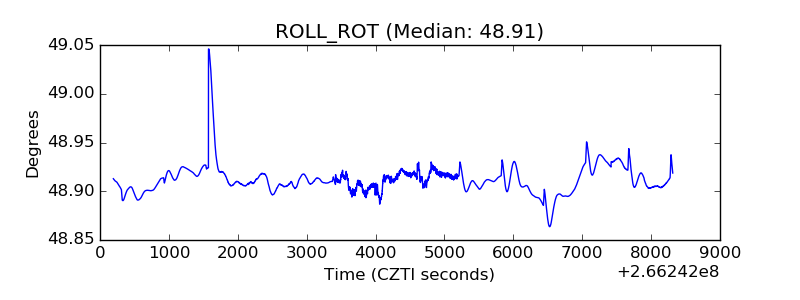 |
| _Roll_DEC |  |
| _Roll_RA | 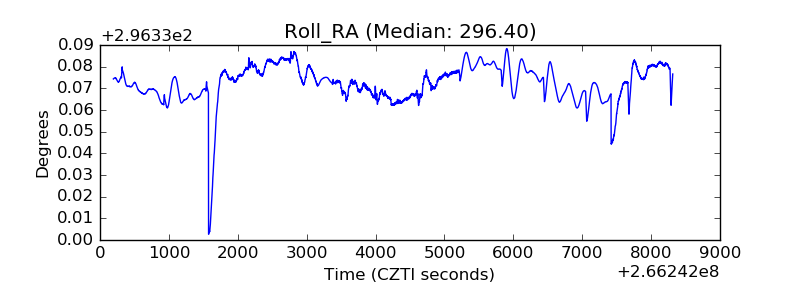 |
| Veto Counter | 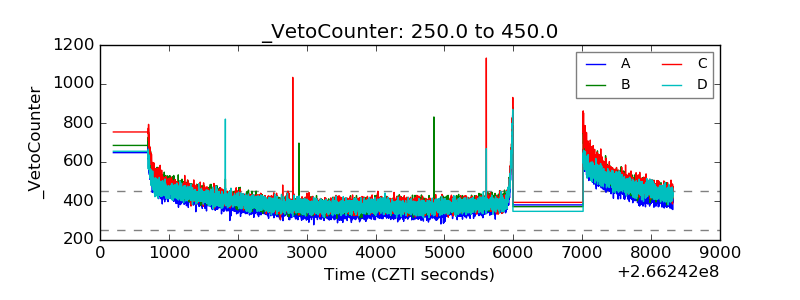 |