| Param | Original file | Final file |
|---|---|---|
| Filename | modeM0/AS1G08_055T02_9000002148_14586cztM0_level2.evt | modeM0/AS1G08_055T02_9000002148_14586cztM0_level2_quad_clean.evt |
| Size (bytes) | 656,622,720 | 85,809,600 |
| Size | 626.2 MB | 81.8 MB |
| Events in quadrant A | 7,520,361 | 521,413 |
| Events in quadrant B | 4,056,013 | 539,431 |
| Events in quadrant C | 4,407,653 | 533,451 |
| Events in quadrant D | 3,447,548 | 534,859 |
| Mode SS | |||
|---|---|---|---|
| Quadrant | BADHDUFLAG | Total packets | Discarded packets |
| A | 0 | 140 | 0 |
| B | 0 | 140 | 0 |
| C | 0 | 140 | 0 |
| D | 0 | 140 | 0 |
| Mode M9 | |||
|---|---|---|---|
| Quadrant | BADHDUFLAG | Total packets | Discarded packets |
| A | 0 | 21 | 0 |
| B | 0 | 21 | 0 |
| C | 0 | 21 | 0 |
| D | 0 | 21 | 0 |
| Mode M0 | |||
|---|---|---|---|
| Quadrant | BADHDUFLAG | Total packets | Discarded packets |
| A | 0 | 27318 | 3 |
| B | 0 | 16425 | 2 |
| C | 0 | 18233 | 2 |
| D | 0 | 14706 | 2 |
| Quadrant | Total seconds | Saturated seconds | Saturation percentage |
|---|---|---|---|
| A | 6728 | 248 | 3.686088% |
| B | 6728 | 202 | 3.002378% |
| C | 6728 | 97 | 1.441736% |
| D | 6728 | 81 | 1.203924% |
Noise dominated data is calculated using 1-second bins in cleaned event files. If a bin has >2000 counts, and if more than 50% of those come from <1% of pixels, then it is considered to be noise-dominated and hence unusable.
| Quadrant | # 1 sec bins | Bins with >0 counts | Bins with >2000 counts | High rate bins dominated by noise | Noise dominated (total time) | Noise dominated (detector-on time) | Marked lightcurve |
|---|---|---|---|---|---|---|---|
| A | 8879 | 6729 | 6 | 6 | 0.07% | 0.09% | 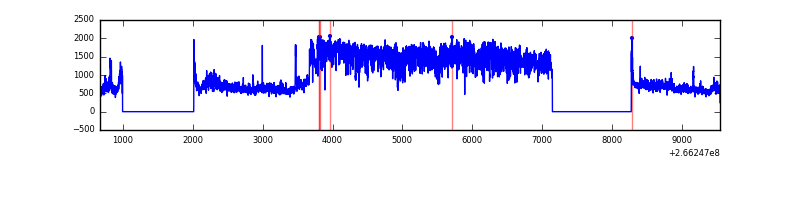 |
| B | 8879 | 6729 | 85 | 85 | 0.96% | 1.26% | 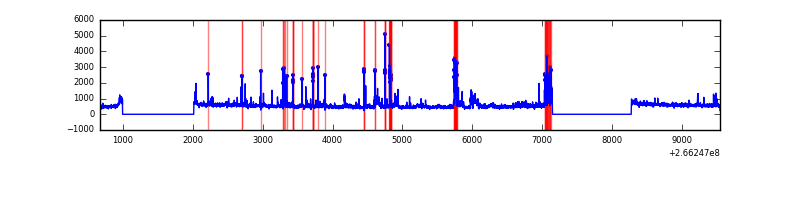 |
| C | 8879 | 6729 | 0 | 0 | 0.00% | 0.00% | 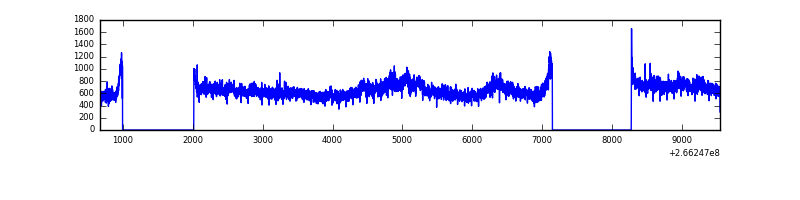 |
| D | 8879 | 6729 | 10 | 10 | 0.11% | 0.15% | 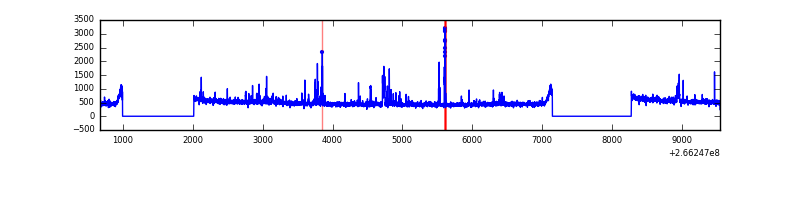 |
Top three noisy pixels from each quadrant. If the there are fewer than three noisy pixels in the level2.evt file, extra rows are filled as -1
| Pixel properties | Quadrant properties | ||||||
|---|---|---|---|---|---|---|---|
| Quadrant | DetID | PixID | Counts | Sigma | Mean | Median | Sigma |
| A | 0 | 23 | 3852690 | 22124.39 | 863 | 846 | 174.1 |
| A | 0 | 226 | 236309 | 1352.46 | 863 | 846 | 174.1 |
| A | 8 | 15 | 57753 | 326.86 | 863 | 846 | 174.1 |
| B | 10 | 16 | 547600 | 3354.16 | 860 | 842 | 163.0 |
| B | 0 | 189 | 47715 | 287.55 | 860 | 842 | 163.0 |
| B | 0 | 229 | 31209 | 186.29 | 860 | 842 | 163.0 |
| C | 3 | 233 | 1096697 | 5617.06 | 847 | 853 | 195.1 |
| C | 3 | 232 | 5827 | 25.5 | 847 | 853 | 195.1 |
| C | 13 | 61 | 5786 | 25.29 | 847 | 853 | 195.1 |
| D | 12 | 110 | 96899 | 472.8 | 850 | 829 | 203.2 |
| D | 10 | 199 | 50269 | 243.32 | 850 | 829 | 203.2 |
| D | 2 | 152 | 28525 | 136.3 | 850 | 829 | 203.2 |
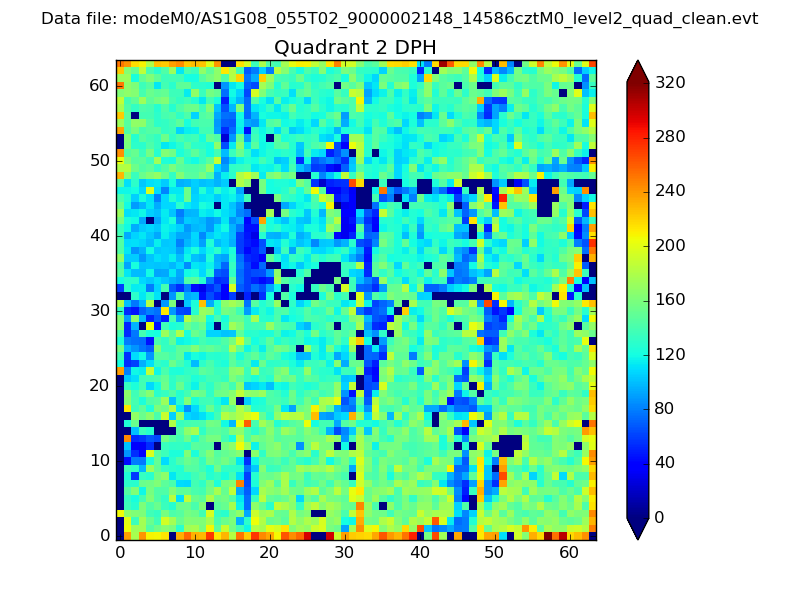
Histogram calculated using DETX and DETY for each event in the final _common_clean file
| Quadrant A | 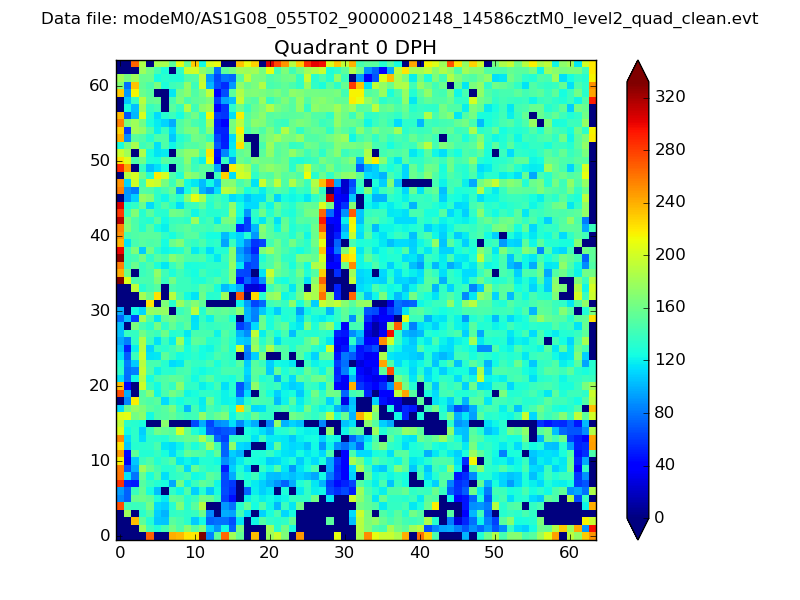 |
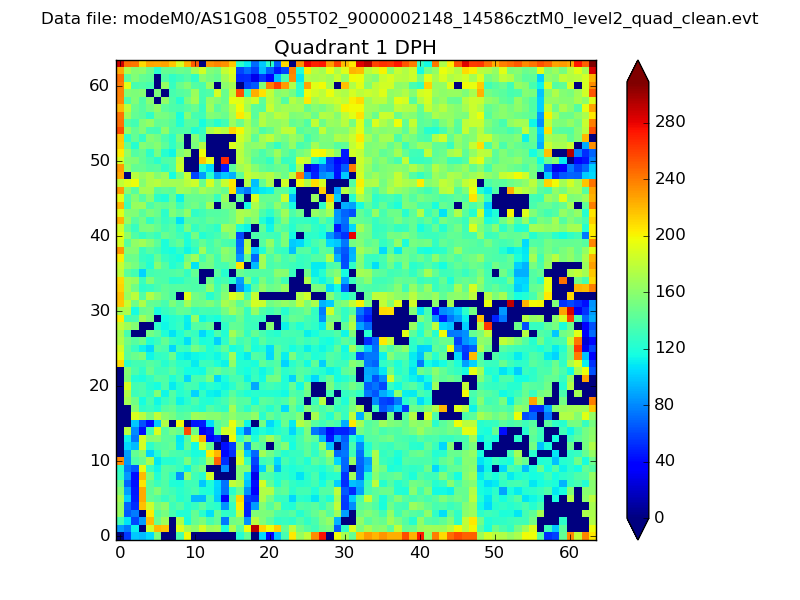 |
Quadrant B |
|---|---|---|---|
| Quadrant D | 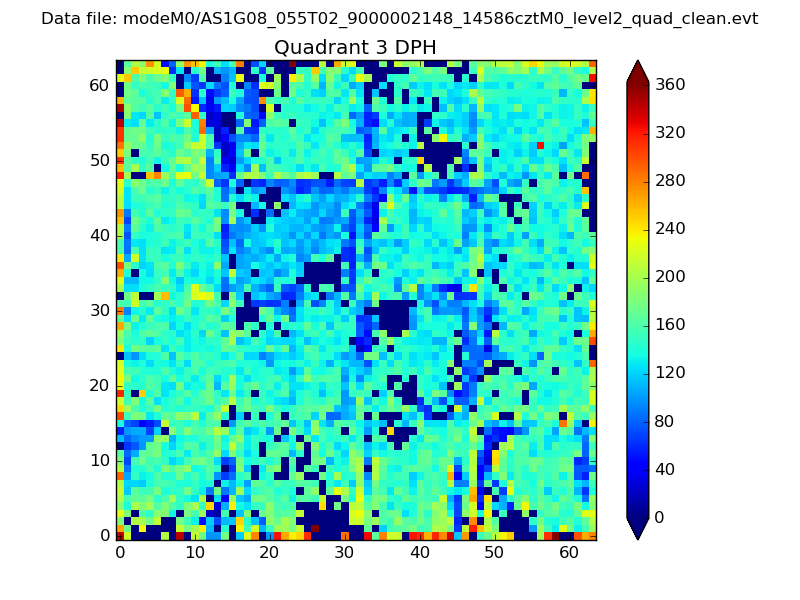 |
 |
Quadrant C |
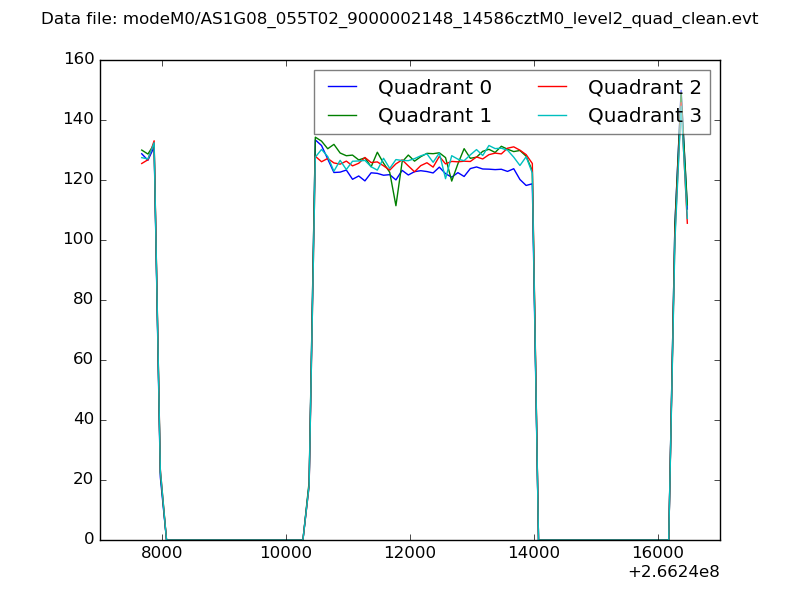
| Plot type | Count rate plots | Images |
|---|---|---|
| Comparison with Poisson distribution Blue bars denote a histogram of data divided into 1 sec bins. Red curve is a Poisson curve with rate = median count rate of data. |
 |
 |
| Quadrant-wise count rates Data is divided into 100 sec bins |
 |
|
| Module-wise count rates for Quadrant A Data is divided into 100 sec bins |
 |
 |
| Module-wise count rates for Quadrant B Data is divided into 100 sec bins |
 |
 |
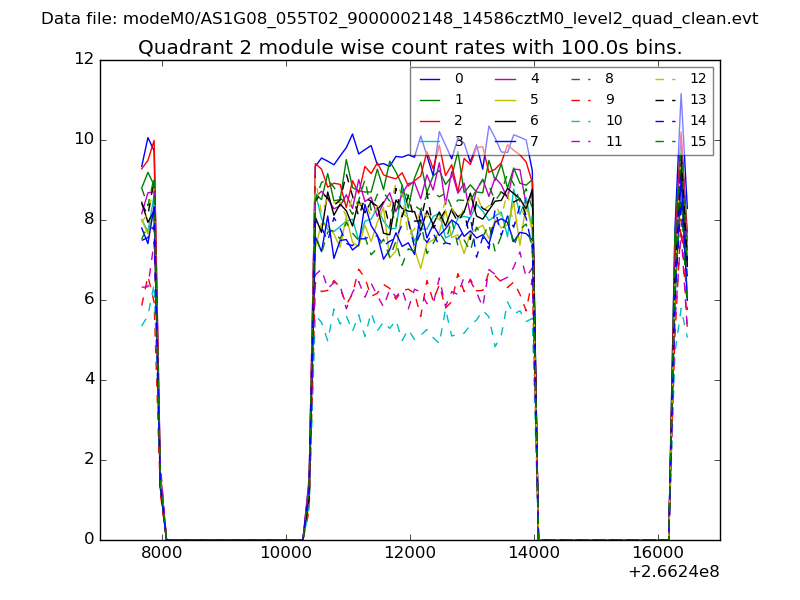
| Module-wise count rates for Quadrant C Data is divided into 100 sec bins |
 |
 |
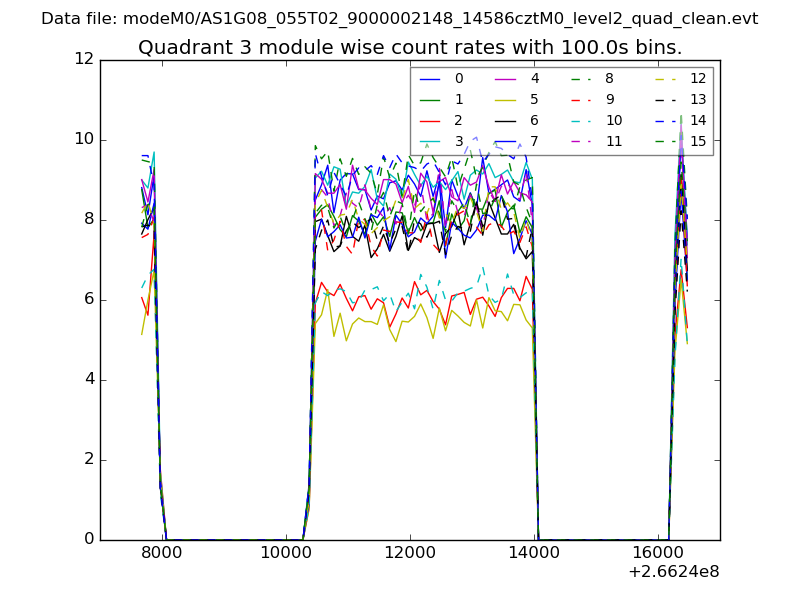
| Module-wise count rates for Quadrant D Data is divided into 100 sec bins |
 |
 |
| Parameter | Plot |
|---|---|
| CZT HV Monitor |  |
| D_VDD | 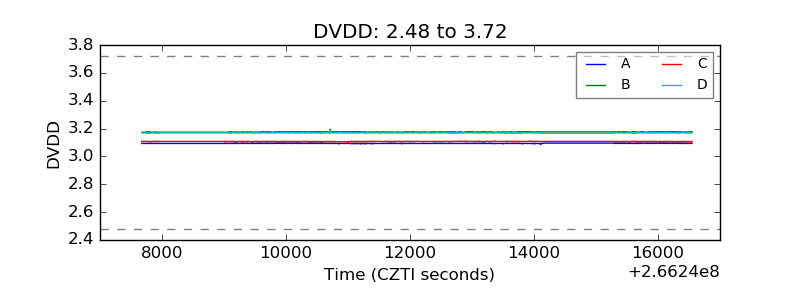 |
| Temperature 1 | 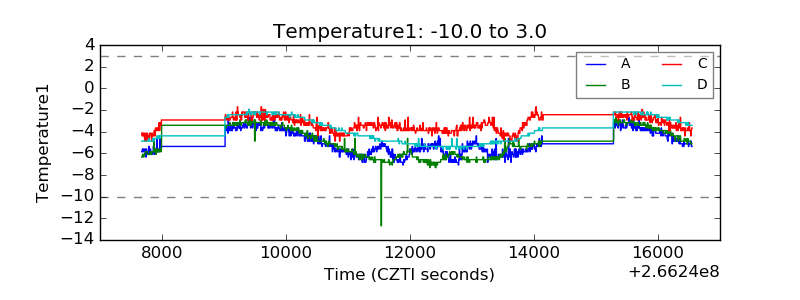 |
| Veto HV Monitor |  |
| Veto LLD | 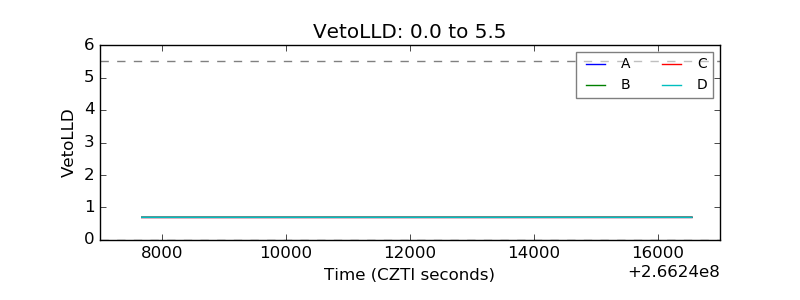 |
| Alpha Counter | 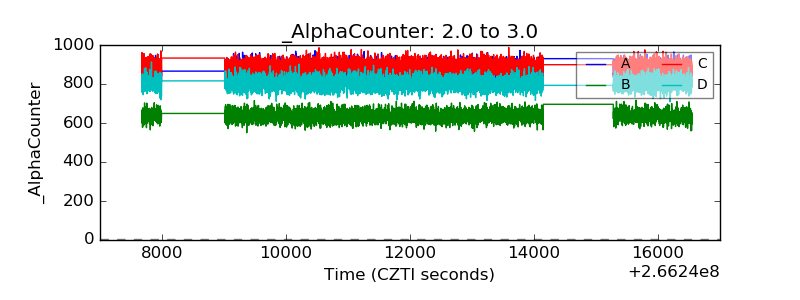 |
| _CPM_Rate | 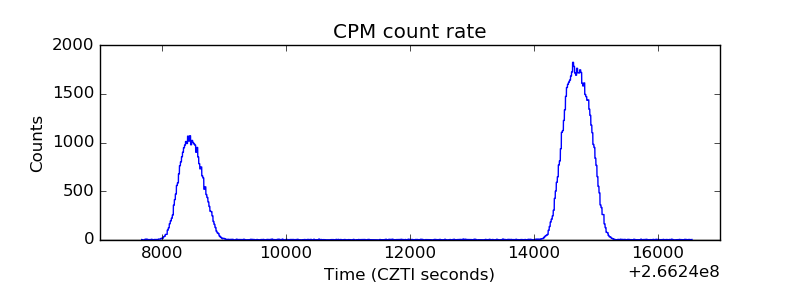 |
| CZT Counter | 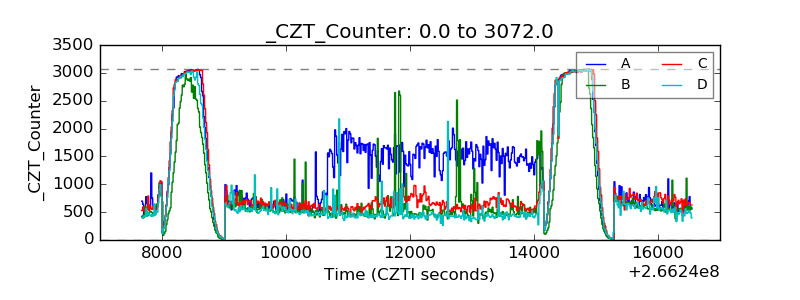 |
| +2.5 Volts monitor | 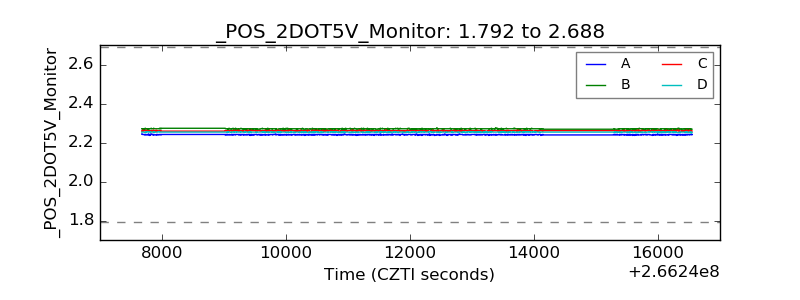 |
| +5 Volts monitor |  |
| _ROLL_ROT | 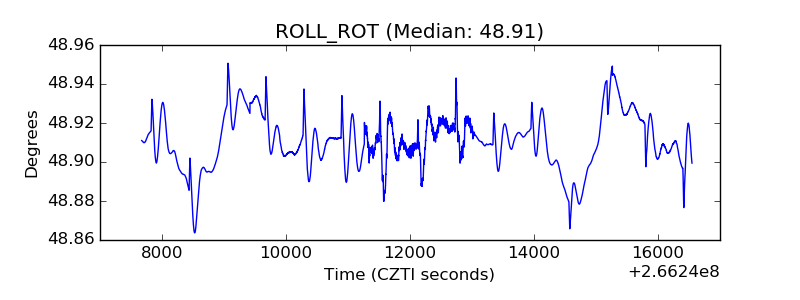 |
| _Roll_DEC |  |
| _Roll_RA | 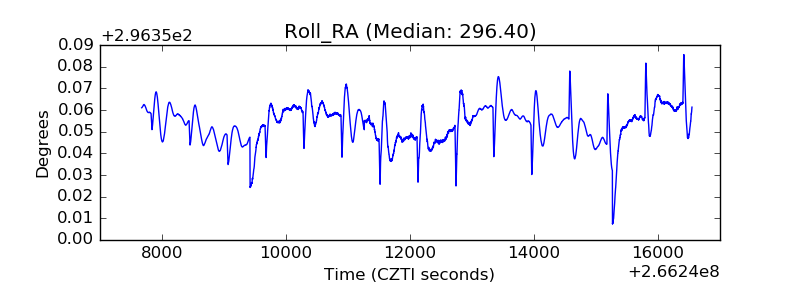 |
| Veto Counter | 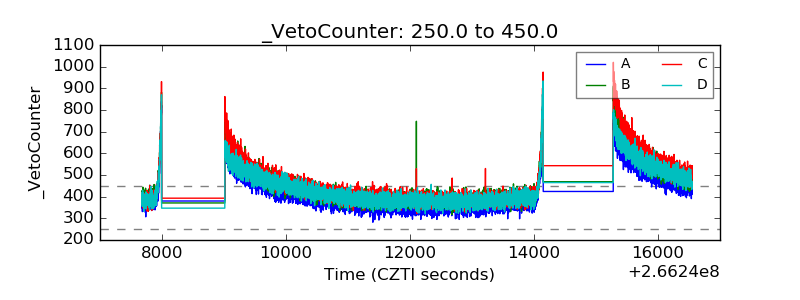 |