| Param | Original file | Final file |
|---|---|---|
| Filename | modeM0/AS1G08_055T02_9000002148_14588cztM0_level2.evt | modeM0/AS1G08_055T02_9000002148_14588cztM0_level2_quad_clean.evt |
| Size (bytes) | 552,392,640 | 96,016,320 |
| Size | 526.8 MB | 91.6 MB |
| Events in quadrant A | 4,534,404 | 616,601 |
| Events in quadrant B | 3,870,301 | 617,255 |
| Events in quadrant C | 4,306,439 | 607,385 |
| Events in quadrant D | 3,571,936 | 607,247 |
| Mode SS | |||
|---|---|---|---|
| Quadrant | BADHDUFLAG | Total packets | Discarded packets |
| A | 0 | 136 | 0 |
| B | 0 | 136 | 0 |
| C | 0 | 136 | 0 |
| D | 0 | 136 | 0 |
| Mode M9 | |||
|---|---|---|---|
| Quadrant | BADHDUFLAG | Total packets | Discarded packets |
| A | 0 | 23 | 0 |
| B | 0 | 23 | 0 |
| C | 0 | 23 | 0 |
| D | 0 | 23 | 0 |
| Mode M0 | |||
|---|---|---|---|
| Quadrant | BADHDUFLAG | Total packets | Discarded packets |
| A | 0 | 18063 | 3 |
| B | 0 | 15836 | 2 |
| C | 0 | 17628 | 2 |
| D | 0 | 14979 | 2 |
| Quadrant | Total seconds | Saturated seconds | Saturation percentage |
|---|---|---|---|
| A | 6586 | 182 | 2.763438% |
| B | 6586 | 214 | 3.249317% |
| C | 6586 | 139 | 2.110538% |
| D | 6586 | 101 | 1.533556% |
Noise dominated data is calculated using 1-second bins in cleaned event files. If a bin has >2000 counts, and if more than 50% of those come from <1% of pixels, then it is considered to be noise-dominated and hence unusable.
| Quadrant | # 1 sec bins | Bins with >0 counts | Bins with >2000 counts | High rate bins dominated by noise | Noise dominated (total time) | Noise dominated (detector-on time) | Marked lightcurve |
|---|---|---|---|---|---|---|---|
| A | 8927 | 6587 | 4 | 4 | 0.04% | 0.06% | 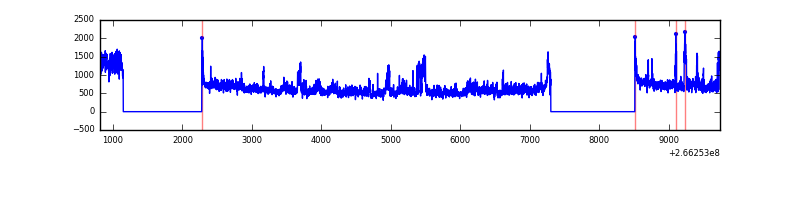 |
| B | 8927 | 6587 | 78 | 78 | 0.87% | 1.18% | 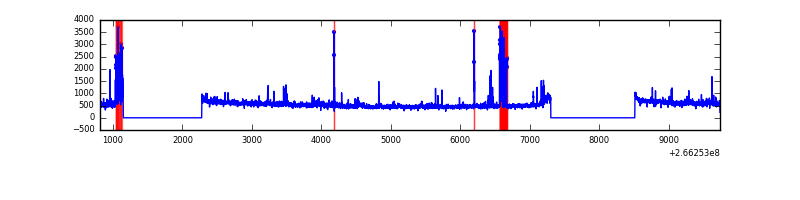 |
| C | 8927 | 6587 | 11 | 11 | 0.12% | 0.17% | 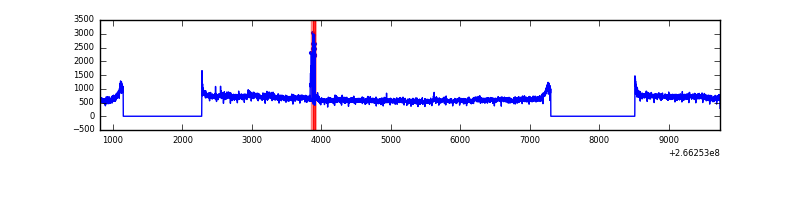 |
| D | 8927 | 6587 | 10 | 10 | 0.11% | 0.15% | 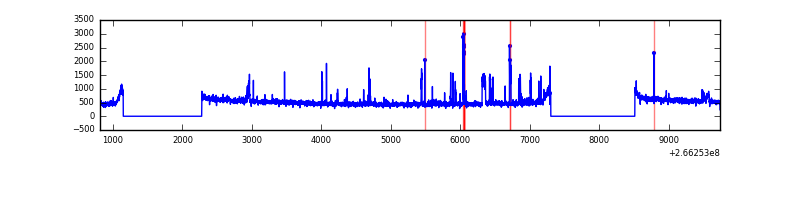 |
Top three noisy pixels from each quadrant. If the there are fewer than three noisy pixels in the level2.evt file, extra rows are filled as -1
| Pixel properties | Quadrant properties | ||||||
|---|---|---|---|---|---|---|---|
| Quadrant | DetID | PixID | Counts | Sigma | Mean | Median | Sigma |
| A | 0 | 23 | 1032052 | 5846.94 | 875 | 858 | 176.4 |
| A | 0 | 226 | 68384 | 382.88 | 875 | 858 | 176.4 |
| A | 8 | 15 | 40803 | 226.49 | 875 | 858 | 176.4 |
| B | 10 | 16 | 341703 | 2057.78 | 873 | 852 | 165.6 |
| B | 0 | 189 | 38205 | 225.51 | 873 | 852 | 165.6 |
| B | 0 | 205 | 25636 | 149.63 | 873 | 852 | 165.6 |
| C | 3 | 233 | 938535 | 4728.96 | 863 | 871 | 198.3 |
| C | 13 | 61 | 6024 | 25.99 | 863 | 871 | 198.3 |
| C | 3 | 232 | 3540 | 13.46 | 863 | 871 | 198.3 |
| D | 12 | 110 | 145550 | 702.19 | 864 | 842 | 206.1 |
| D | 10 | 199 | 58916 | 281.8 | 864 | 842 | 206.1 |
| D | 13 | 122 | 49237 | 234.83 | 864 | 842 | 206.1 |
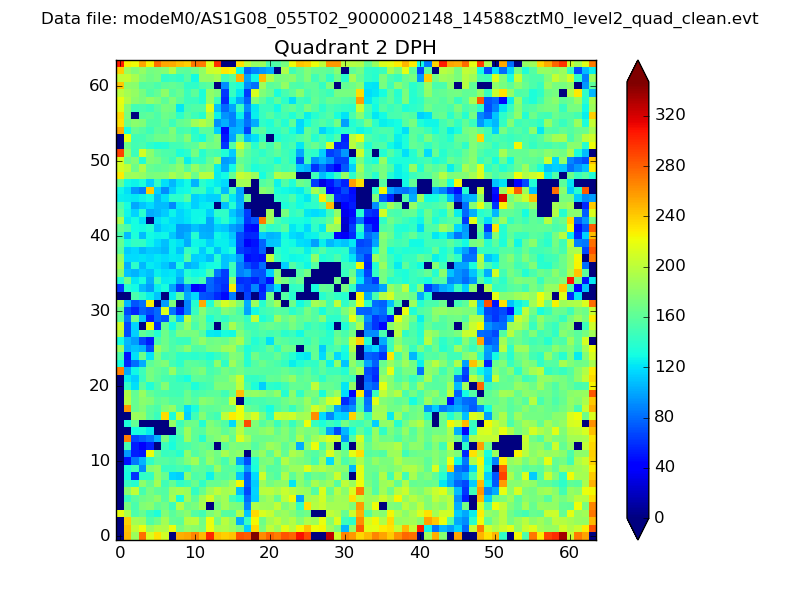
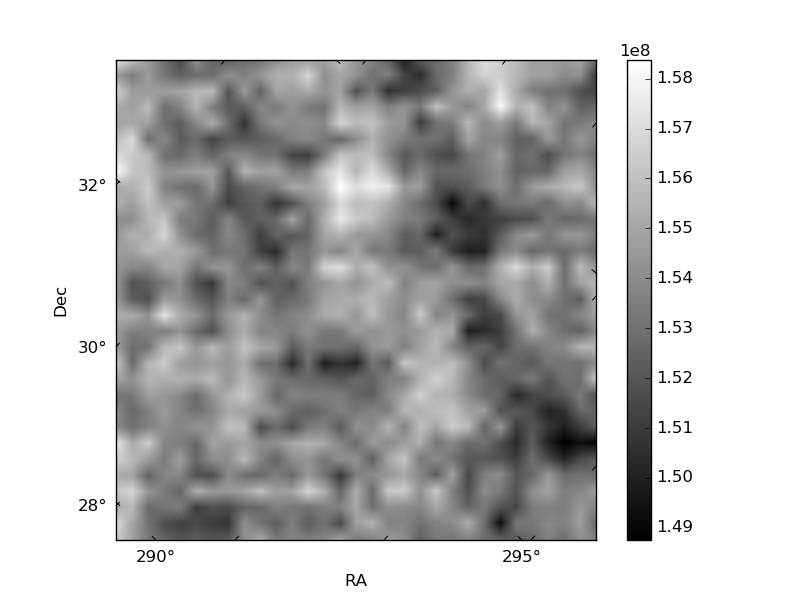
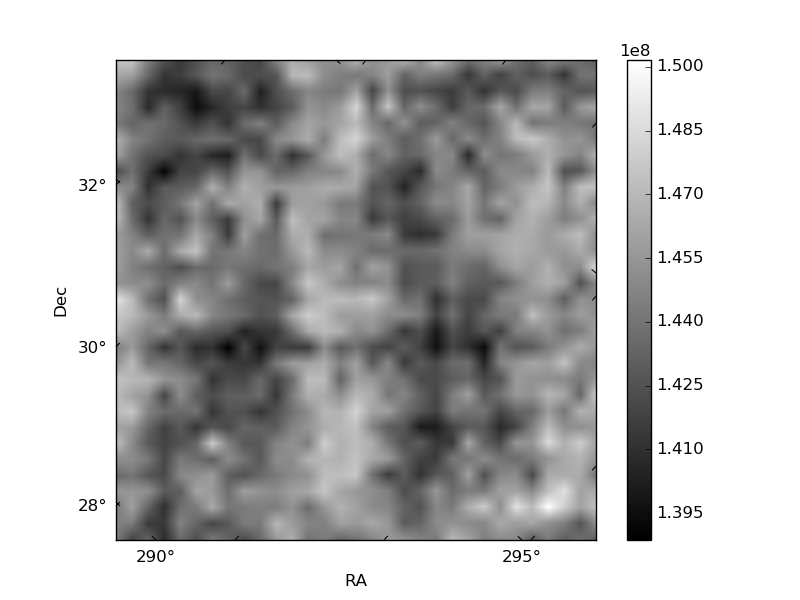
Histogram calculated using DETX and DETY for each event in the final _common_clean file
| Quadrant A | 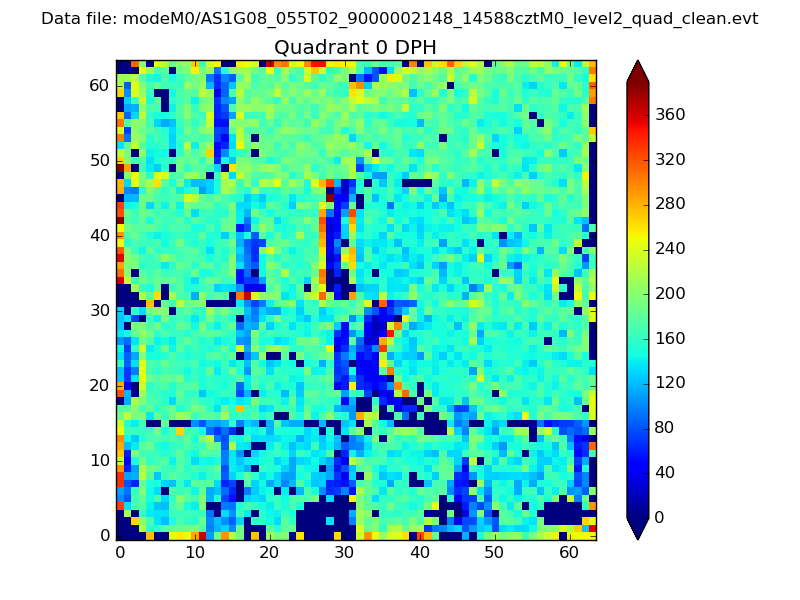 |
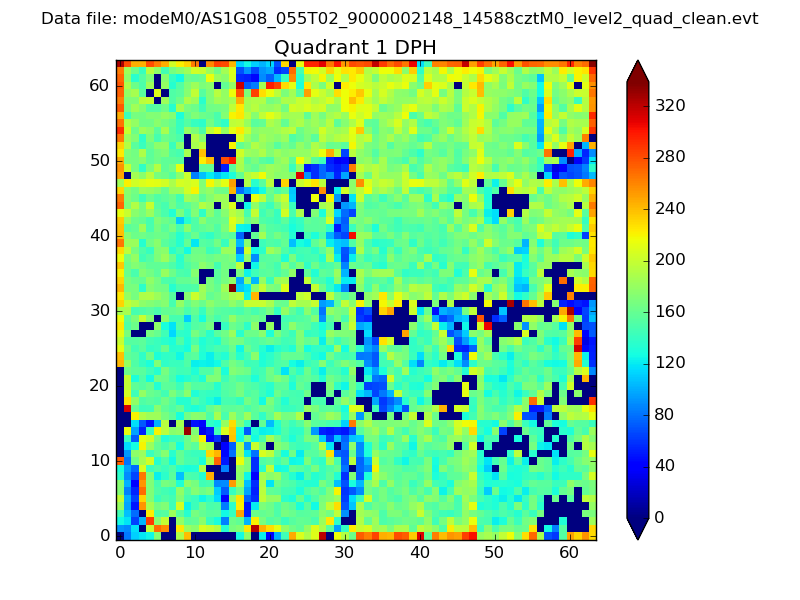 |
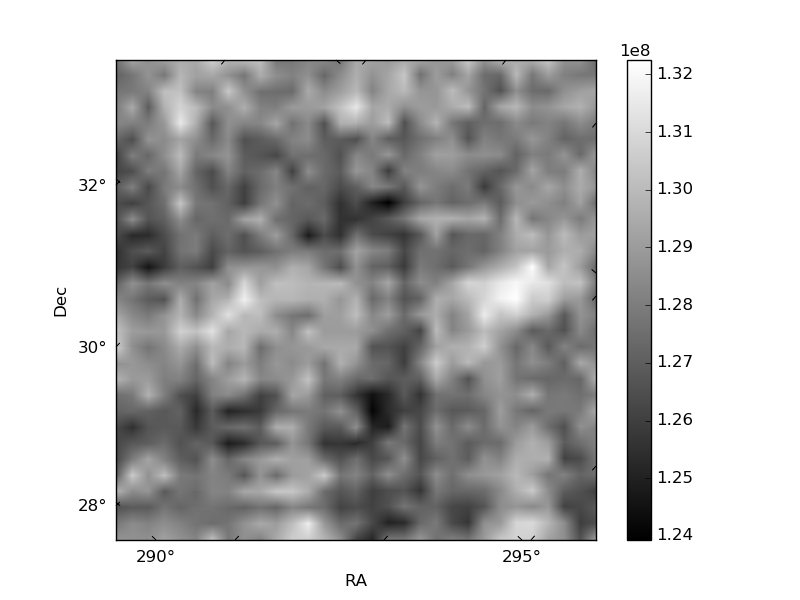
Quadrant B |
|---|---|---|---|
| Quadrant D | 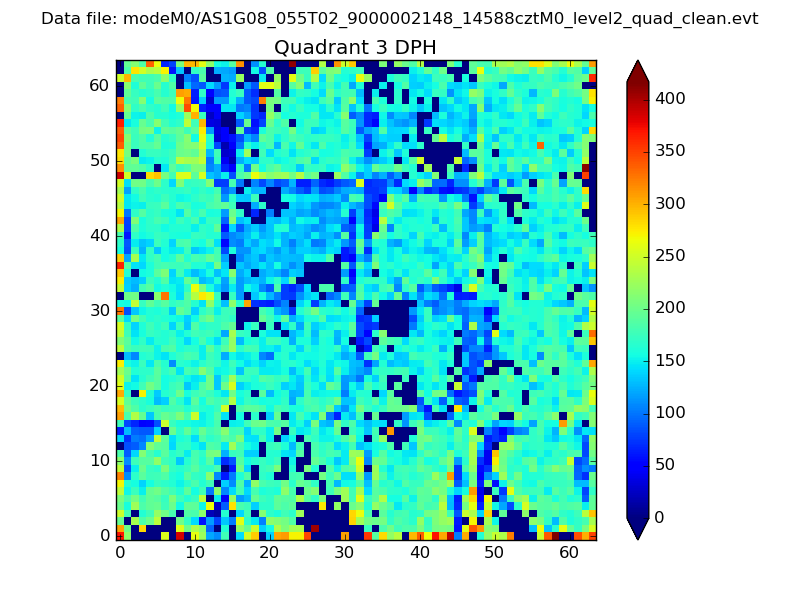 |
 |
Quadrant C |
| Plot type | Count rate plots | Images |
|---|---|---|
| Comparison with Poisson distribution Blue bars denote a histogram of data divided into 1 sec bins. Red curve is a Poisson curve with rate = median count rate of data. |
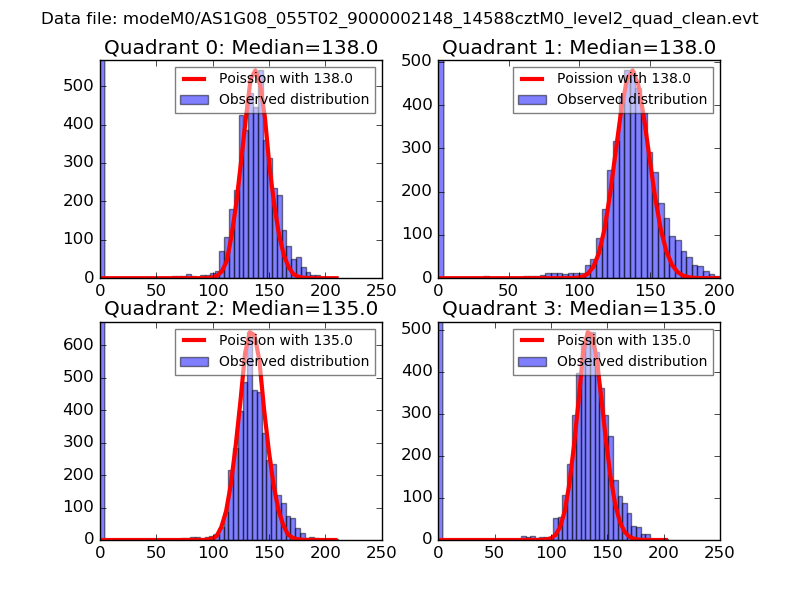 |
 |
| Quadrant-wise count rates Data is divided into 100 sec bins |
 |
|
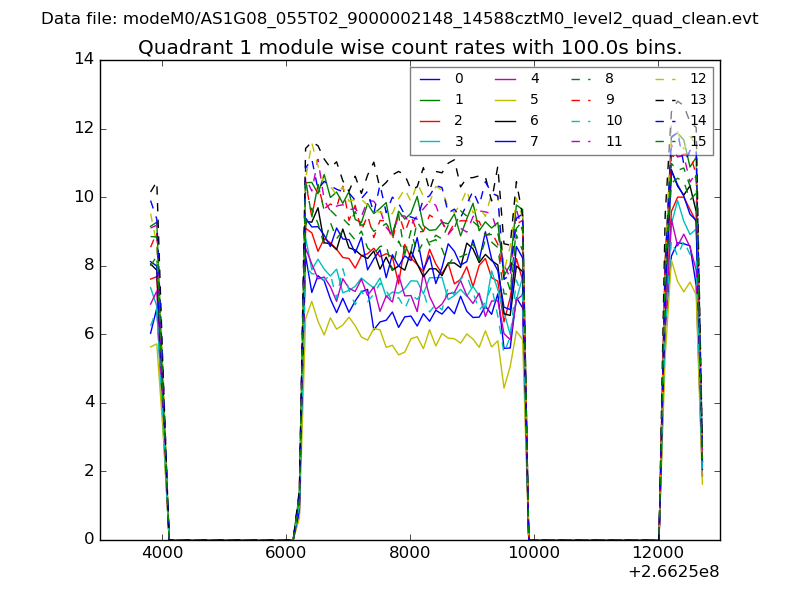
| Module-wise count rates for Quadrant A Data is divided into 100 sec bins |
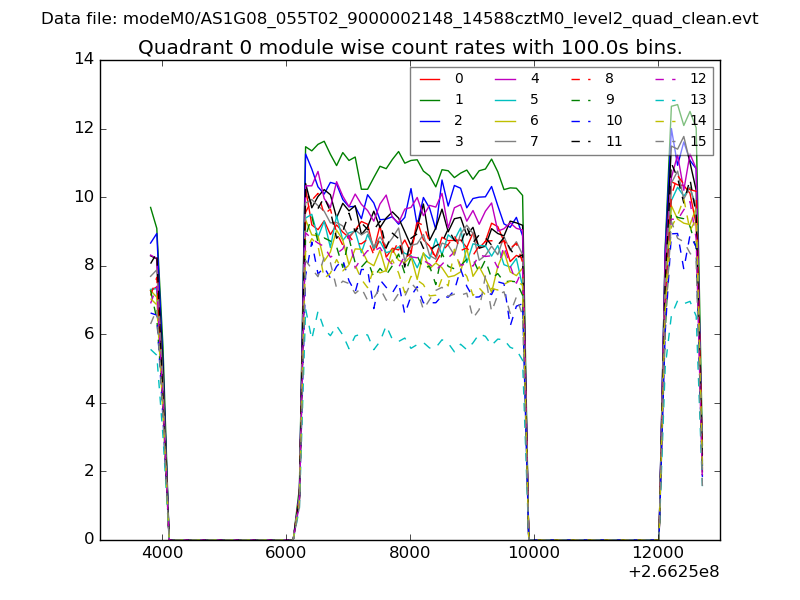 |
 |
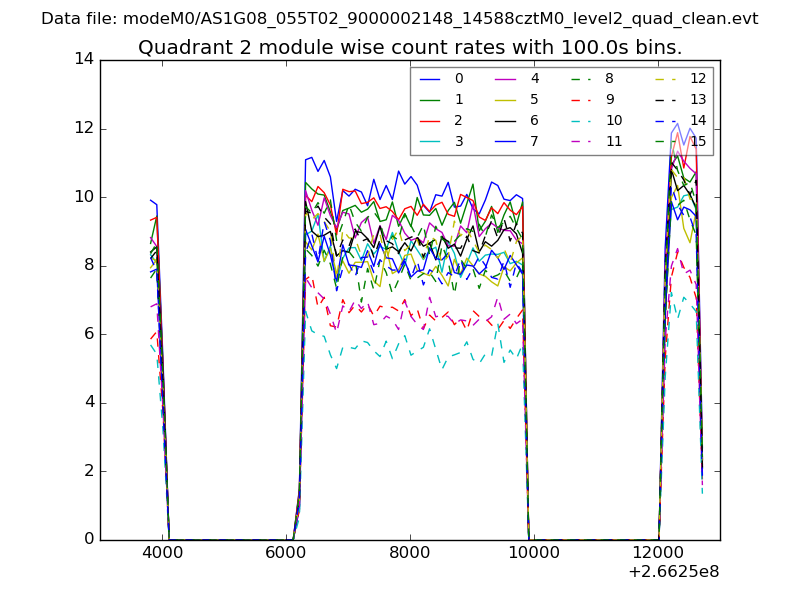
| Module-wise count rates for Quadrant B Data is divided into 100 sec bins |
 |
 |
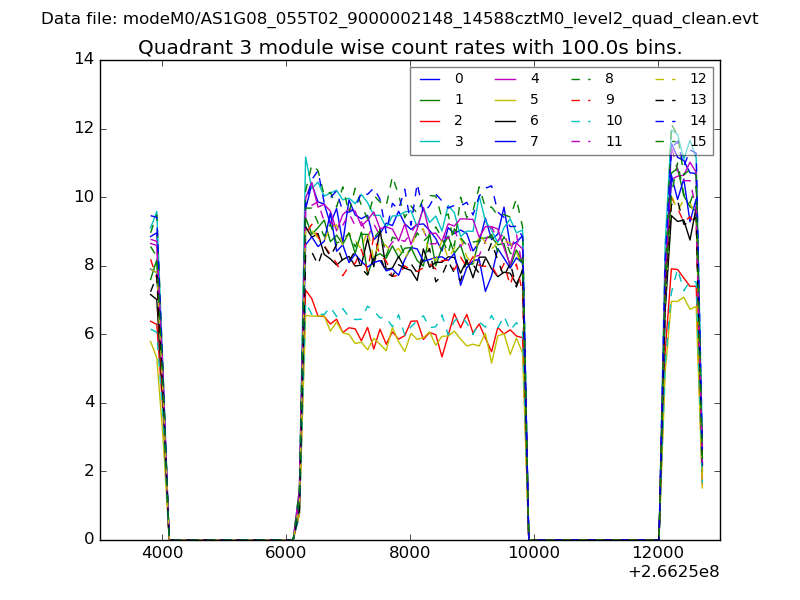
| Module-wise count rates for Quadrant C Data is divided into 100 sec bins |
 |
 |
| Module-wise count rates for Quadrant D Data is divided into 100 sec bins |
 |
 |
| Parameter | Plot |
|---|---|
| CZT HV Monitor | 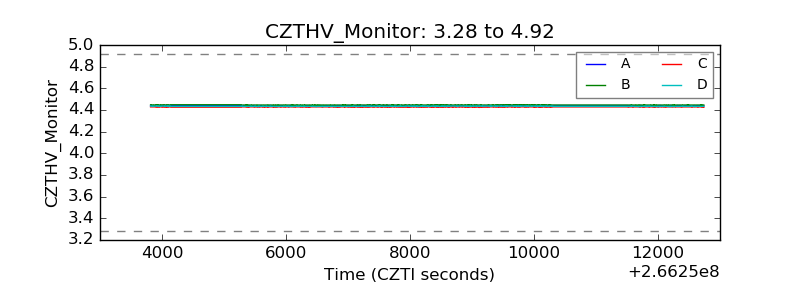 |
| D_VDD | 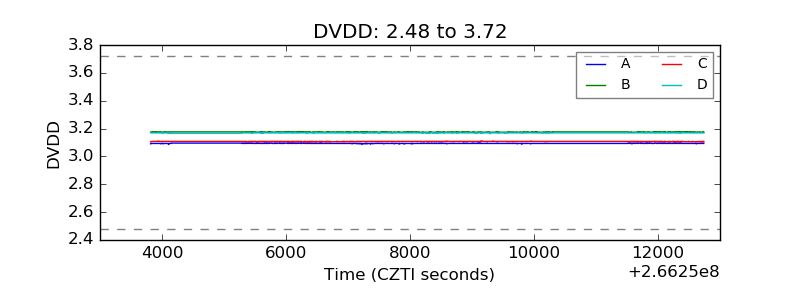 |
| Temperature 1 | 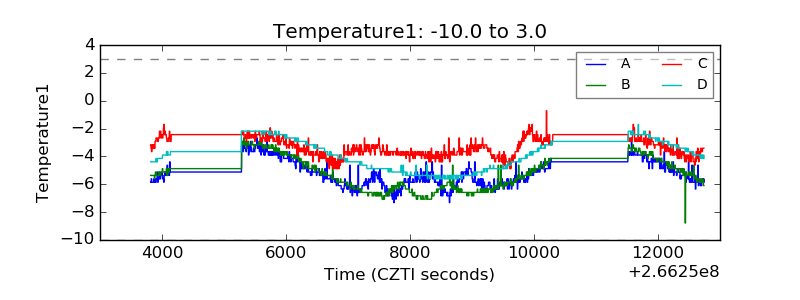 |
| Veto HV Monitor | 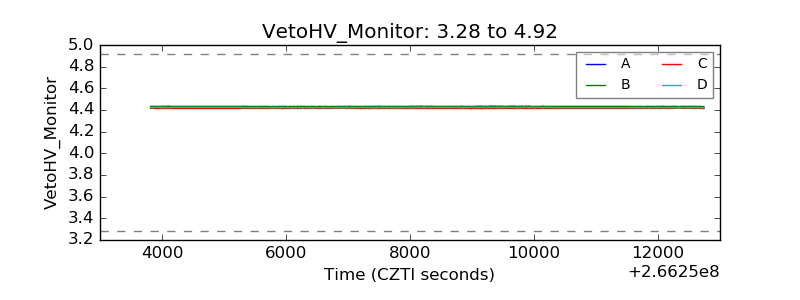 |
| Veto LLD | 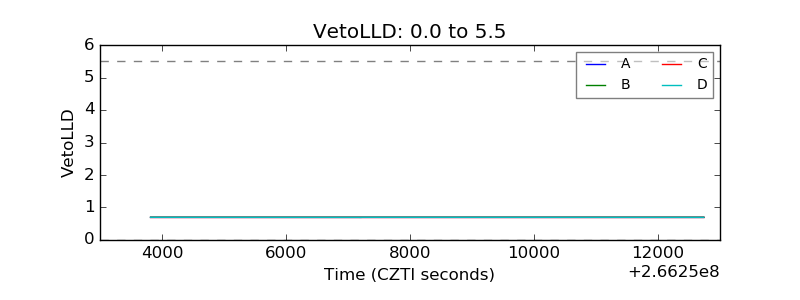 |
| Alpha Counter |  |
| _CPM_Rate |  |
| CZT Counter | 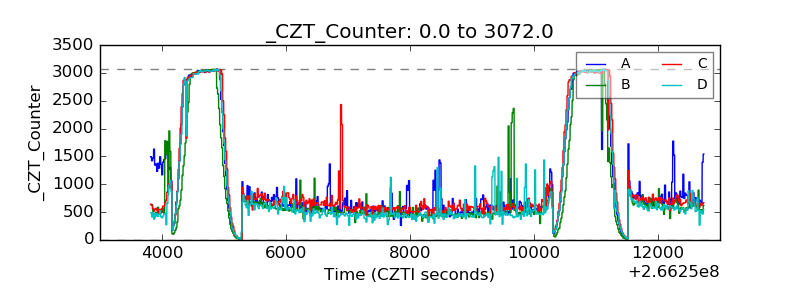 |
| +2.5 Volts monitor |  |
| +5 Volts monitor |  |
| _ROLL_ROT | 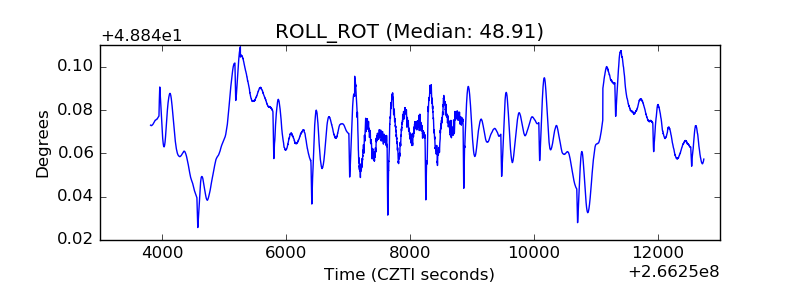 |
| _Roll_DEC | 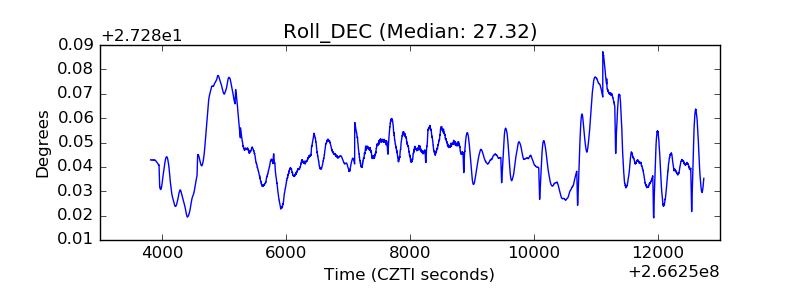 |
| _Roll_RA | 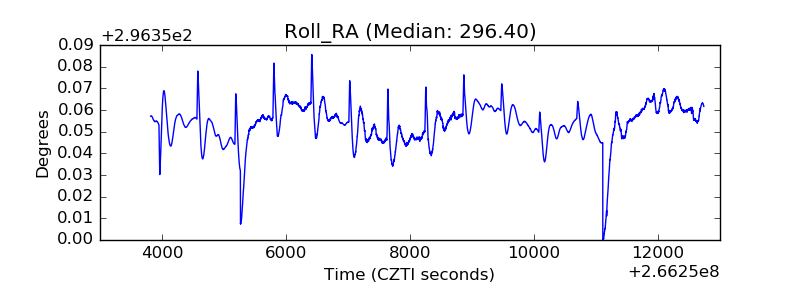 |
| Veto Counter | 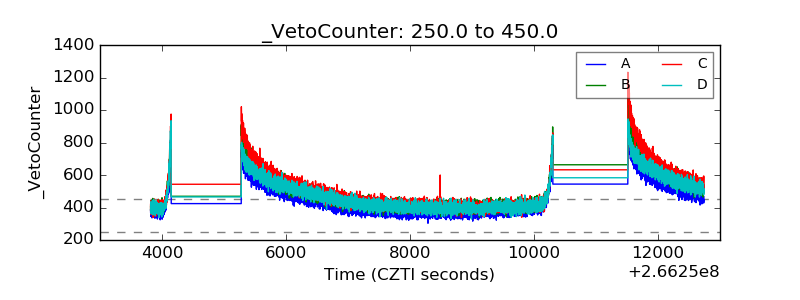 |