| Param | Original file | Final file |
|---|---|---|
| Filename | modeM0/AS1G08_055T02_9000002148_14589cztM0_level2.evt | modeM0/AS1G08_055T02_9000002148_14589cztM0_level2_quad_clean.evt |
| Size (bytes) | 553,982,400 | 101,871,360 |
| Size | 528.3 MB | 97.2 MB |
| Events in quadrant A | 4,790,708 | 658,115 |
| Events in quadrant B | 3,294,933 | 679,266 |
| Events in quadrant C | 4,235,684 | 666,178 |
| Events in quadrant D | 4,043,968 | 656,457 |
| Mode SS | |||
|---|---|---|---|
| Quadrant | BADHDUFLAG | Total packets | Discarded packets |
| A | 0 | 122 | 0 |
| B | 0 | 122 | 0 |
| C | 0 | 122 | 0 |
| D | 0 | 122 | 0 |
| Mode M9 | |||
|---|---|---|---|
| Quadrant | BADHDUFLAG | Total packets | Discarded packets |
| A | 0 | 20 | 0 |
| B | 0 | 20 | 0 |
| C | 0 | 20 | 0 |
| D | 0 | 21 | 0 |
| Mode M0 | |||
|---|---|---|---|
| Quadrant | BADHDUFLAG | Total packets | Discarded packets |
| A | 0 | 18512 | 3 |
| B | 0 | 13825 | 2 |
| C | 0 | 17507 | 2 |
| D | 0 | 16105 | 2 |
| Quadrant | Total seconds | Saturated seconds | Saturation percentage |
|---|---|---|---|
| A | 6097 | 244 | 4.001968% |
| B | 6097 | 72 | 1.180909% |
| C | 6097 | 86 | 1.410530% |
| D | 6097 | 288 | 4.723635% |
Noise dominated data is calculated using 1-second bins in cleaned event files. If a bin has >2000 counts, and if more than 50% of those come from <1% of pixels, then it is considered to be noise-dominated and hence unusable.
| Quadrant | # 1 sec bins | Bins with >0 counts | Bins with >2000 counts | High rate bins dominated by noise | Noise dominated (total time) | Noise dominated (detector-on time) | Marked lightcurve |
|---|---|---|---|---|---|---|---|
| A | 7423 | 6099 | 62 | 62 | 0.84% | 1.02% | 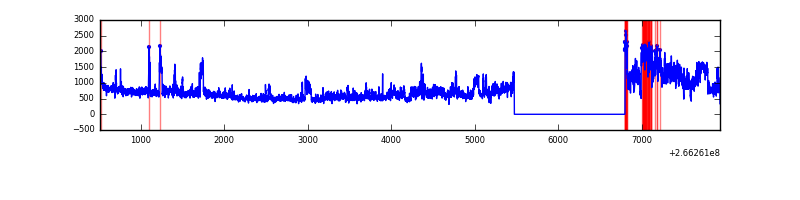 |
| B | 7423 | 6099 | 1 | 1 | 0.01% | 0.02% | 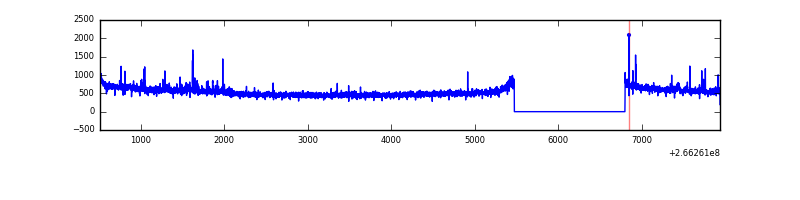 |
| C | 7423 | 6099 | 0 | 0 | 0.00% | 0.00% | 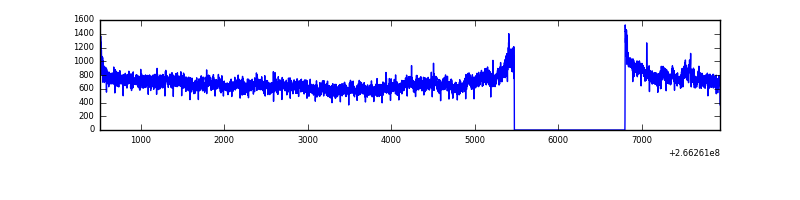 |
| D | 7423 | 6099 | 224 | 224 | 3.02% | 3.67% | 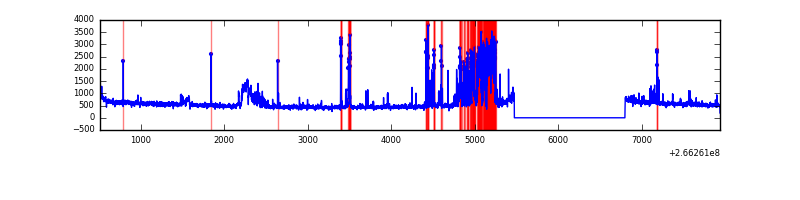 |
Top three noisy pixels from each quadrant. If the there are fewer than three noisy pixels in the level2.evt file, extra rows are filled as -1
| Pixel properties | Quadrant properties | ||||||
|---|---|---|---|---|---|---|---|
| Quadrant | DetID | PixID | Counts | Sigma | Mean | Median | Sigma |
| A | 0 | 23 | 1510339 | 9317.73 | 812 | 797 | 162.0 |
| A | 0 | 226 | 97057 | 594.17 | 812 | 797 | 162.0 |
| A | 12 | 189 | 35846 | 216.34 | 812 | 797 | 162.0 |
| B | 0 | 229 | 26799 | 170.26 | 820 | 801 | 152.7 |
| B | 12 | 111 | 17504 | 109.39 | 820 | 801 | 152.7 |
| B | 10 | 16 | 16655 | 103.83 | 820 | 801 | 152.7 |
| C | 3 | 233 | 1072541 | 5803.15 | 809 | 818 | 184.7 |
| C | 13 | 61 | 5843 | 27.21 | 809 | 818 | 184.7 |
| C | 3 | 234 | 5078 | 23.07 | 809 | 818 | 184.7 |
| D | 10 | 199 | 732678 | 3893.18 | 799 | 781 | 188.0 |
| D | 12 | 110 | 161552 | 855.19 | 799 | 781 | 188.0 |
| D | 13 | 172 | 41156 | 214.77 | 799 | 781 | 188.0 |
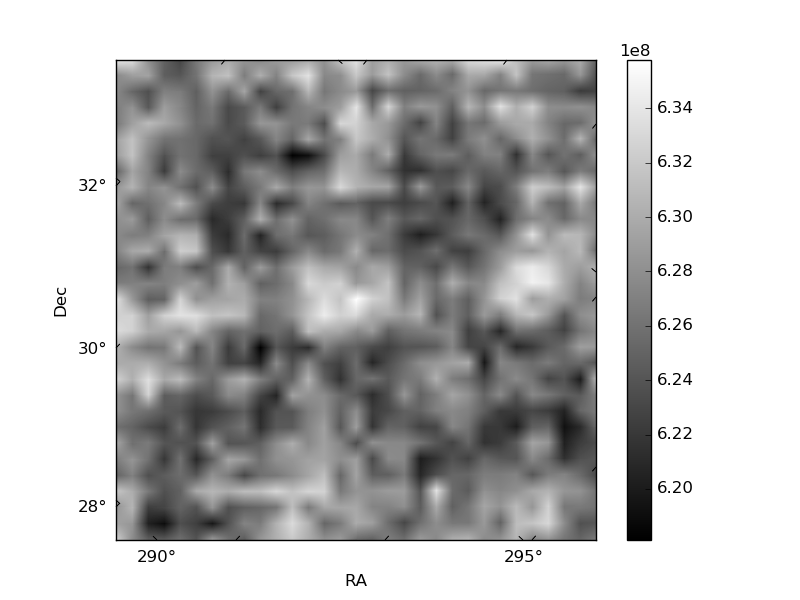
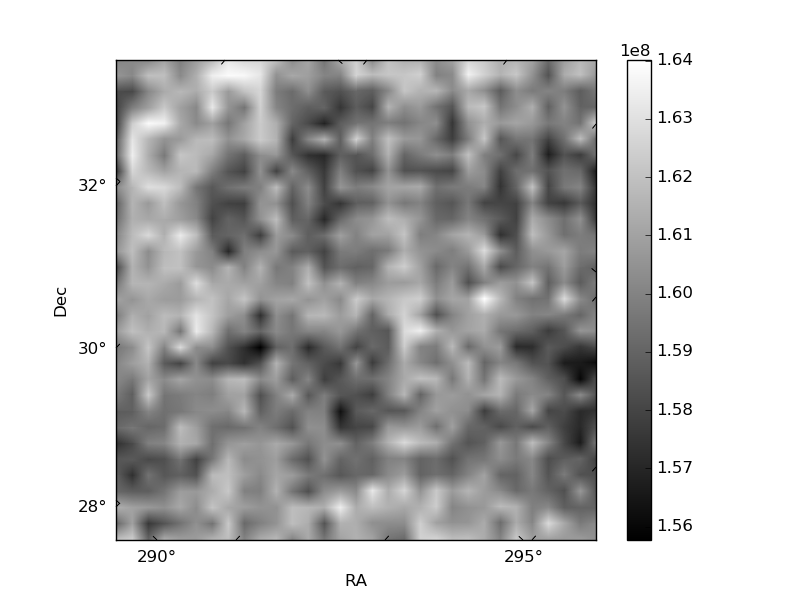
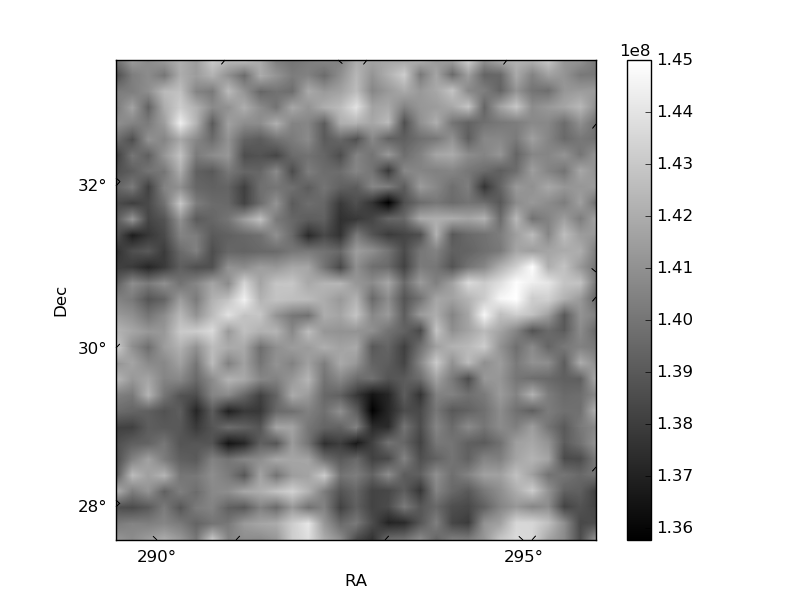
Histogram calculated using DETX and DETY for each event in the final _common_clean file
| Quadrant A | 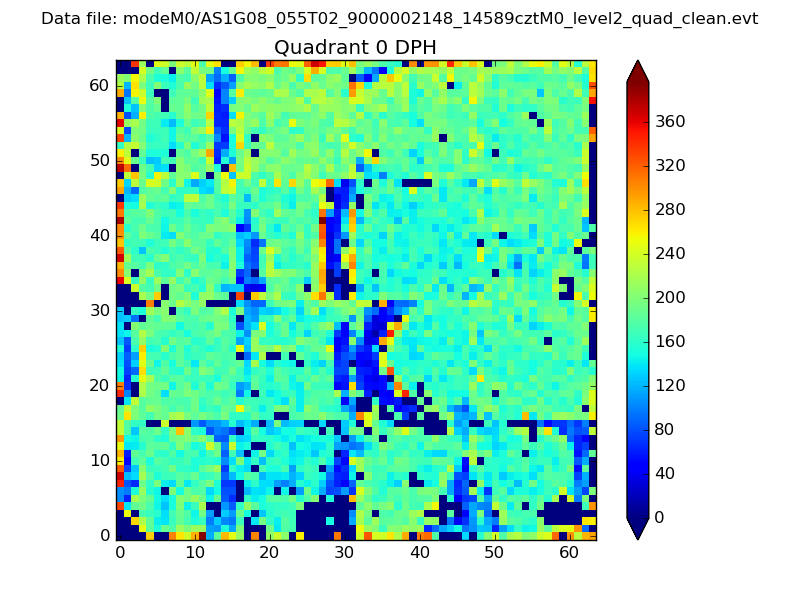 |
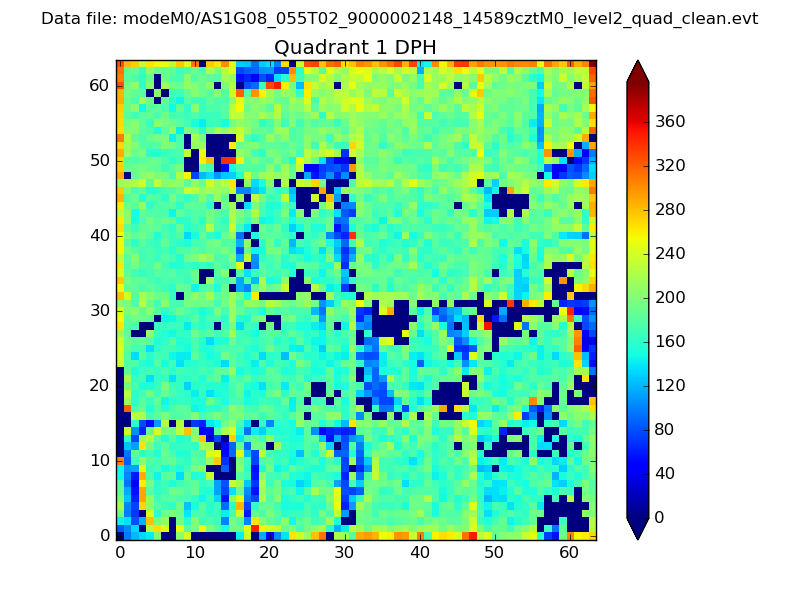 |
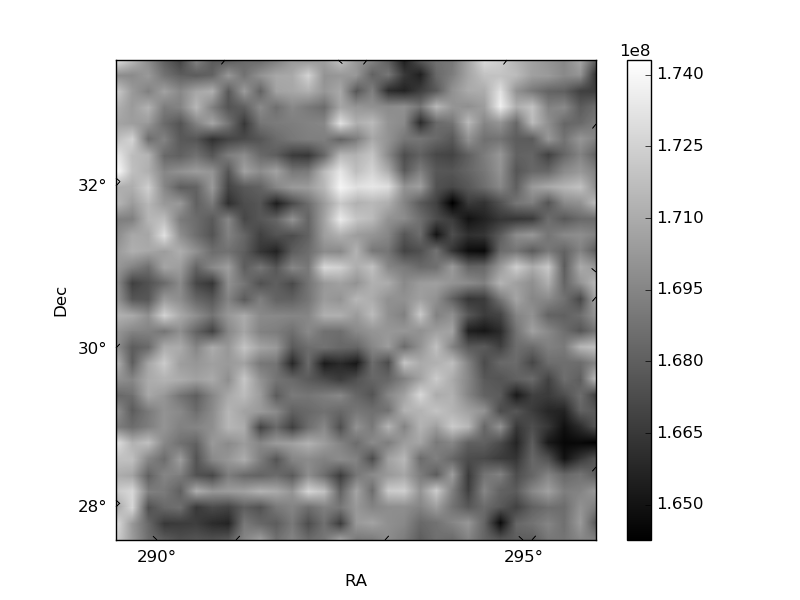
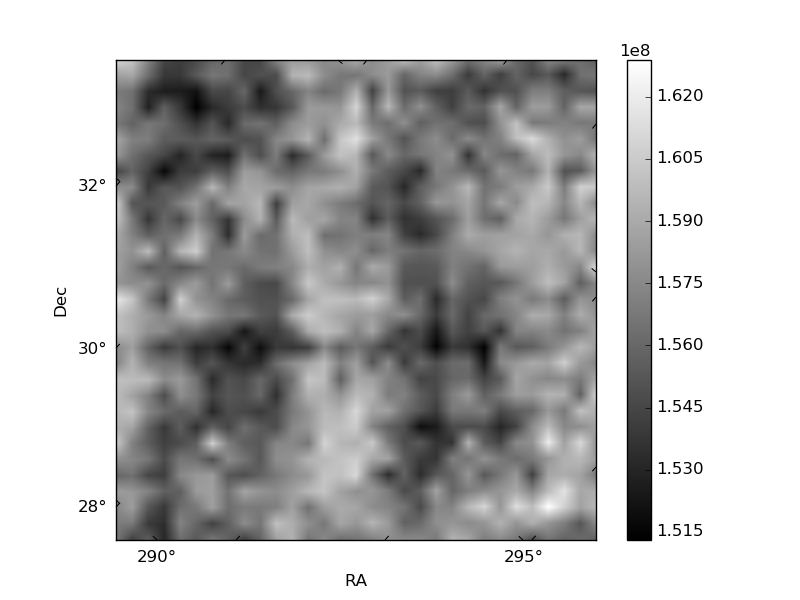
Quadrant B |
|---|---|---|---|
| Quadrant D | 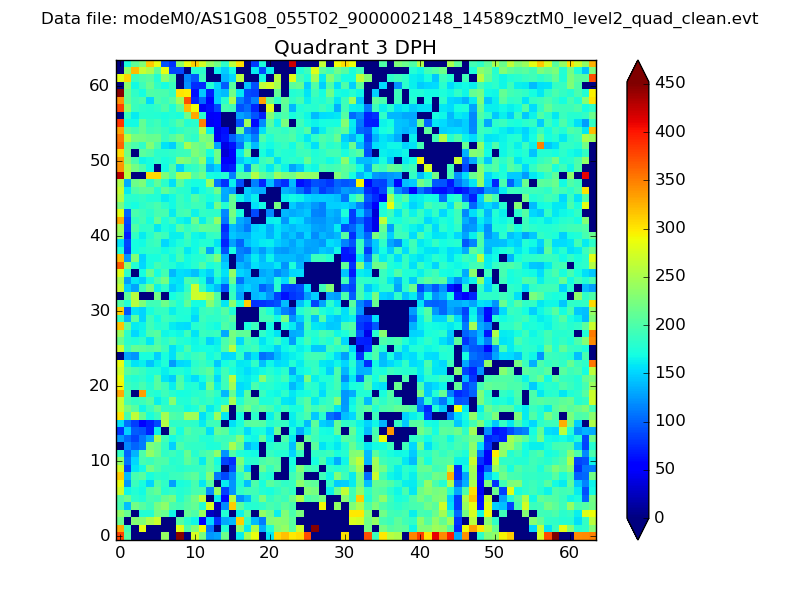 |
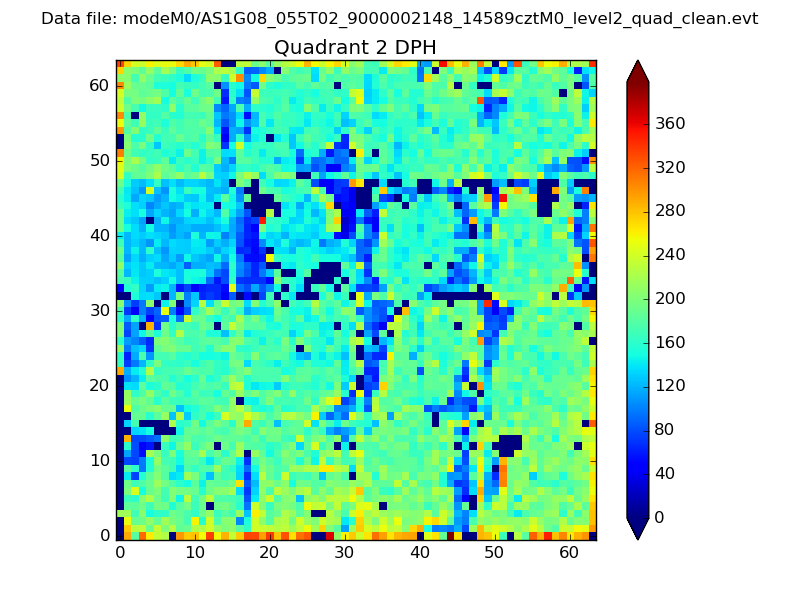 |
Quadrant C |
| Plot type | Count rate plots | Images |
|---|---|---|
| Comparison with Poisson distribution Blue bars denote a histogram of data divided into 1 sec bins. Red curve is a Poisson curve with rate = median count rate of data. |
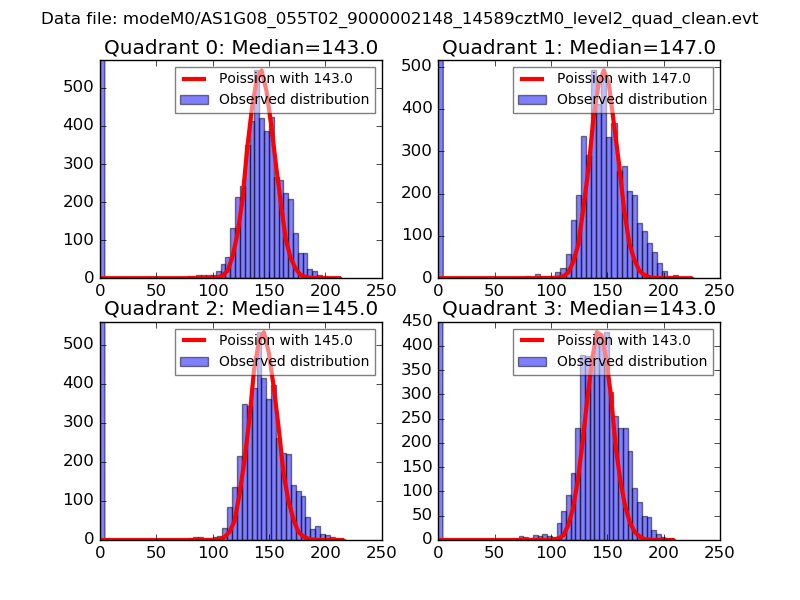 |
 |
| Quadrant-wise count rates Data is divided into 100 sec bins |
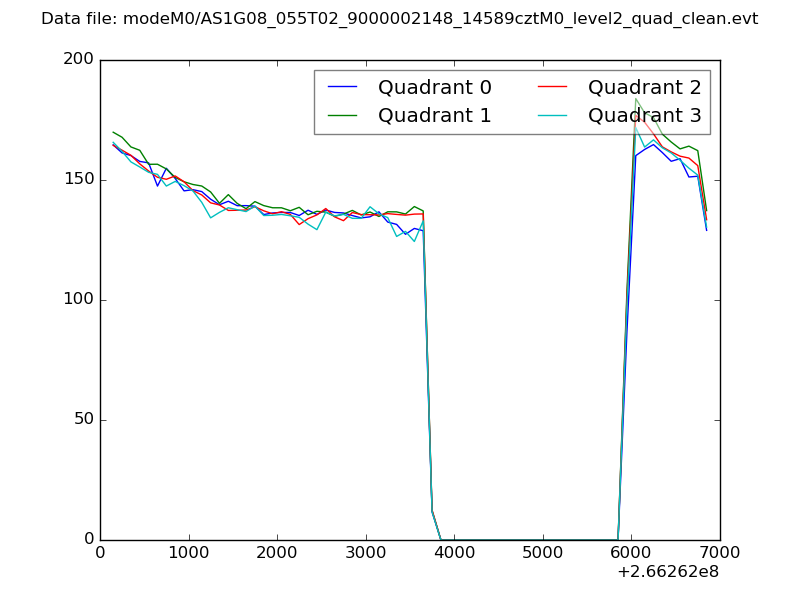 |
|
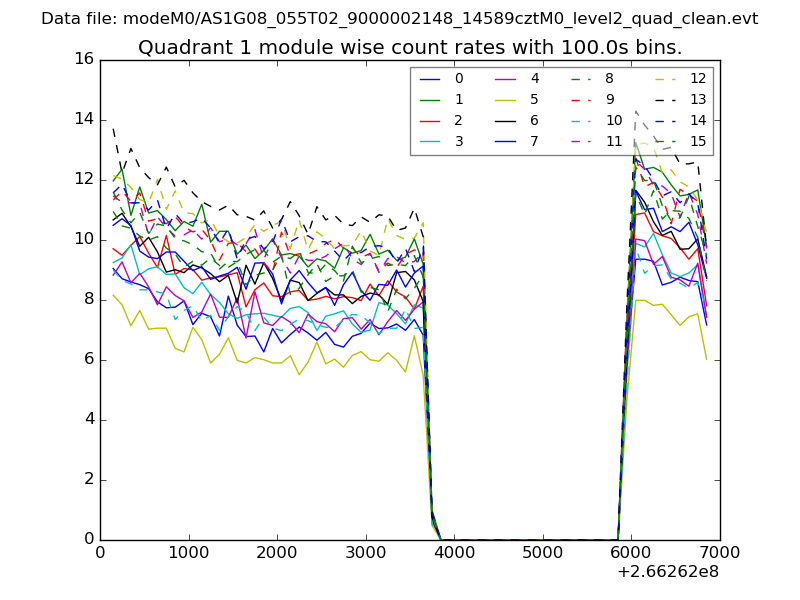
| Module-wise count rates for Quadrant A Data is divided into 100 sec bins |
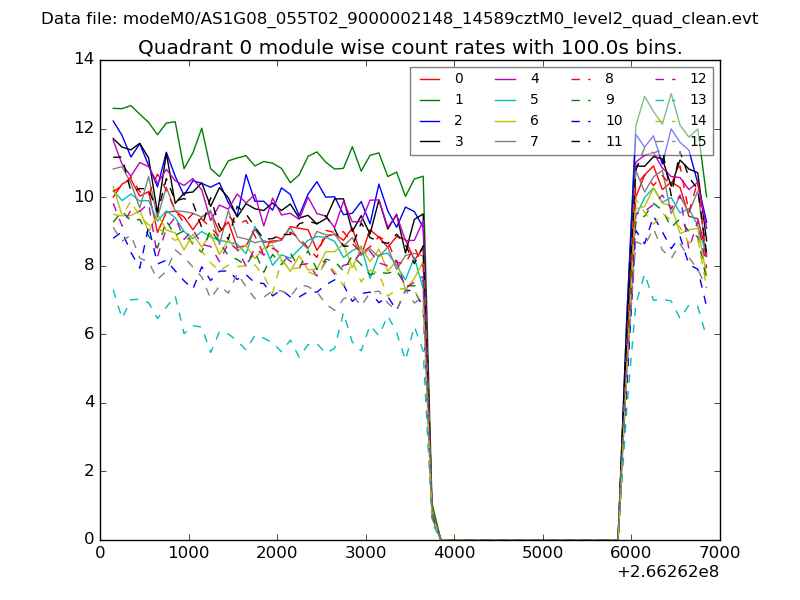 |
 |
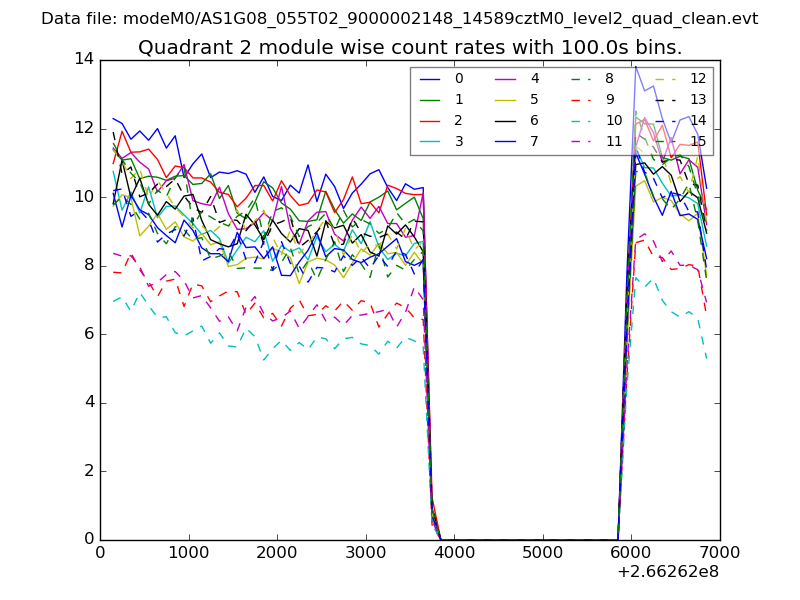
| Module-wise count rates for Quadrant B Data is divided into 100 sec bins |
 |
 |
| Module-wise count rates for Quadrant C Data is divided into 100 sec bins |
 |
 |
| Module-wise count rates for Quadrant D Data is divided into 100 sec bins |
 |
 |
| Parameter | Plot |
|---|---|
| CZT HV Monitor | 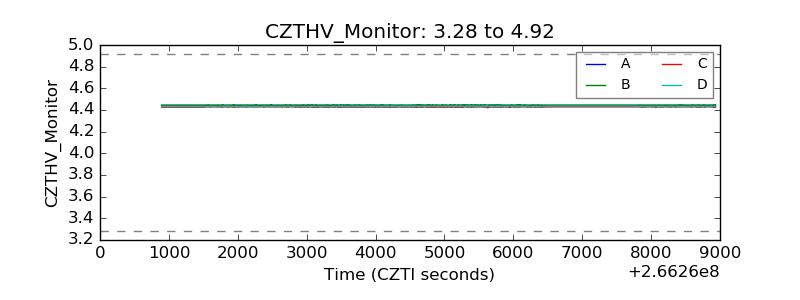 |
| D_VDD | 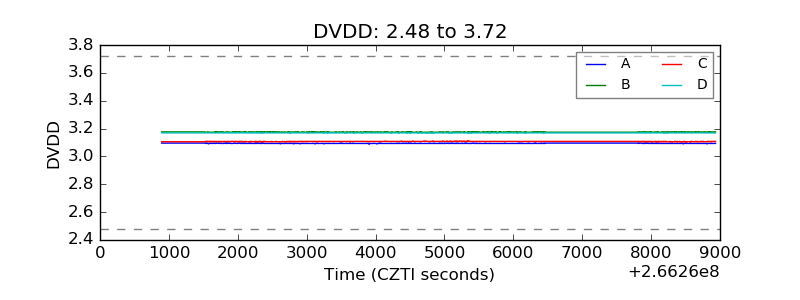 |
| Temperature 1 | 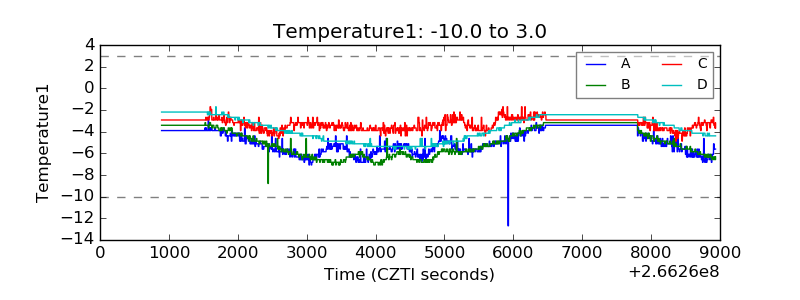 |
| Veto HV Monitor | 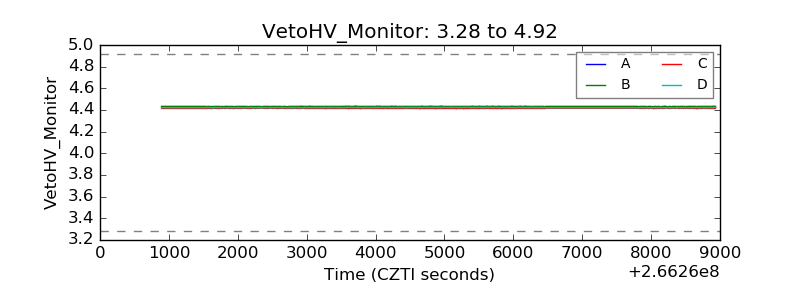 |
| Veto LLD | 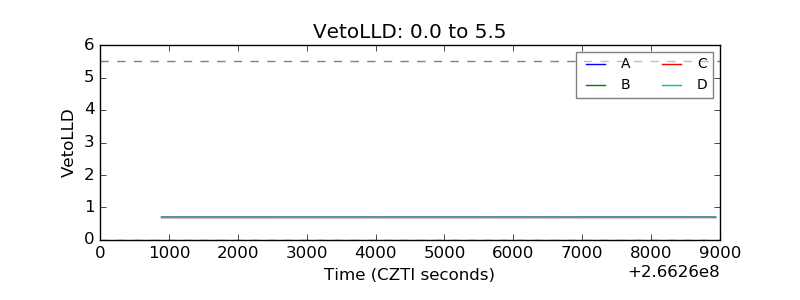 |
| Alpha Counter | 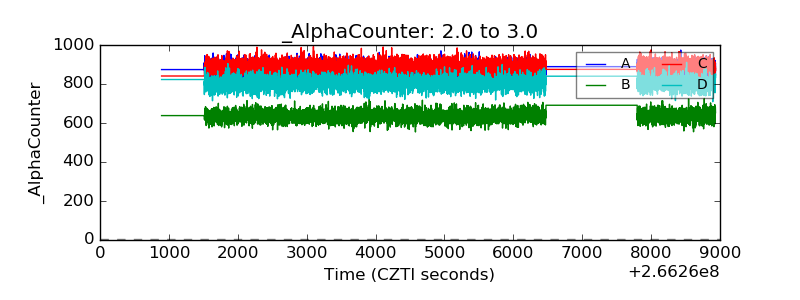 |
| _CPM_Rate | 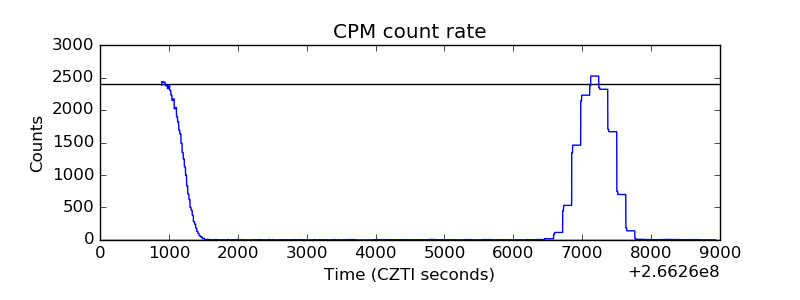 |
| CZT Counter | 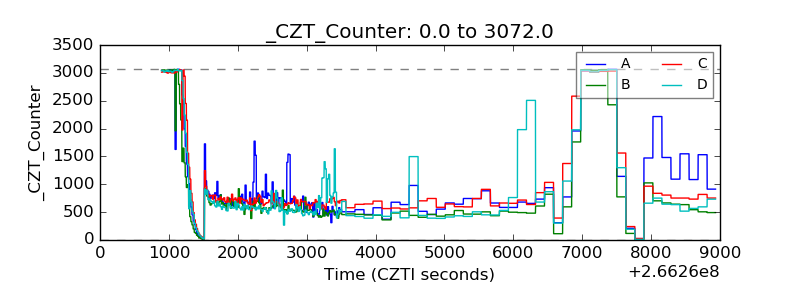 |
| +2.5 Volts monitor |  |
| +5 Volts monitor |  |
| _ROLL_ROT |  |
| _Roll_DEC | 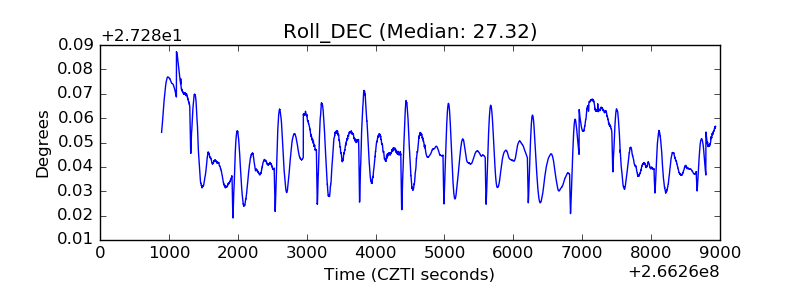 |
| _Roll_RA | 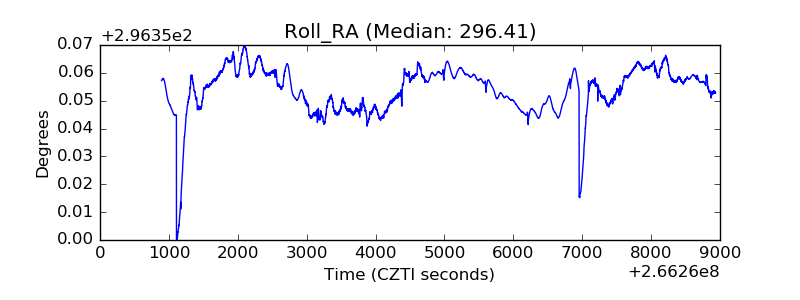 |
| Veto Counter |  |