| Param | Original file | Final file |
|---|---|---|
| Filename | modeM0/AS1G08_055T02_9000002148_14590cztM0_level2.evt | modeM0/AS1G08_055T02_9000002148_14590cztM0_level2_quad_clean.evt |
| Size (bytes) | 735,102,720 | 111,496,320 |
| Size | 701.0 MB | 106.3 MB |
| Events in quadrant A | 8,132,656 | 701,467 |
| Events in quadrant B | 3,741,984 | 745,625 |
| Events in quadrant C | 5,404,777 | 731,892 |
| Events in quadrant D | 4,521,852 | 720,374 |
| Mode SS | |||
|---|---|---|---|
| Quadrant | BADHDUFLAG | Total packets | Discarded packets |
| A | 0 | 140 | 0 |
| B | 0 | 140 | 0 |
| C | 0 | 140 | 0 |
| D | 0 | 140 | 0 |
| Mode M9 | |||
|---|---|---|---|
| Quadrant | BADHDUFLAG | Total packets | Discarded packets |
| A | 0 | 27 | 0 |
| B | 0 | 27 | 0 |
| C | 0 | 27 | 0 |
| D | 0 | 27 | 0 |
| Mode M0 | |||
|---|---|---|---|
| Quadrant | BADHDUFLAG | Total packets | Discarded packets |
| A | 0 | 29000 | 3 |
| B | 0 | 15502 | 2 |
| C | 0 | 21206 | 2 |
| D | 0 | 17843 | 2 |
| Quadrant | Total seconds | Saturated seconds | Saturation percentage |
|---|---|---|---|
| A | 6855 | 468 | 6.827133% |
| B | 6855 | 142 | 2.071481% |
| C | 6855 | 149 | 2.173596% |
| D | 6855 | 327 | 4.770241% |
Noise dominated data is calculated using 1-second bins in cleaned event files. If a bin has >2000 counts, and if more than 50% of those come from <1% of pixels, then it is considered to be noise-dominated and hence unusable.
| Quadrant | # 1 sec bins | Bins with >0 counts | Bins with >2000 counts | High rate bins dominated by noise | Noise dominated (total time) | Noise dominated (detector-on time) | Marked lightcurve |
|---|---|---|---|---|---|---|---|
| A | 9511 | 6858 | 73 | 73 | 0.77% | 1.06% | 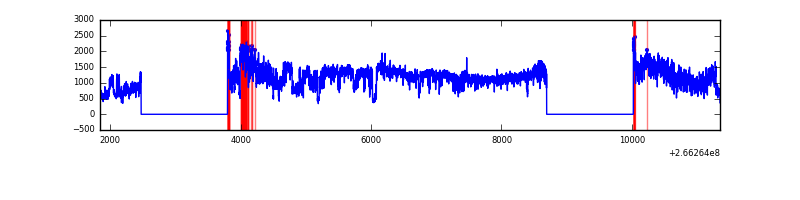 |
| B | 9511 | 6858 | 26 | 26 | 0.27% | 0.38% | 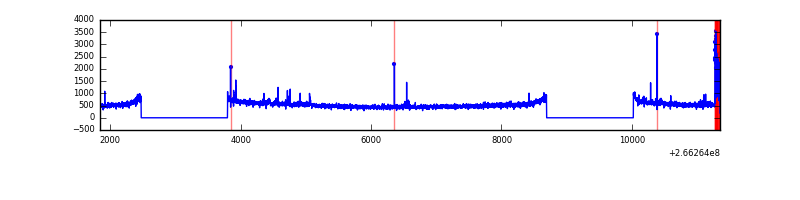 |
| C | 9511 | 6858 | 0 | 0 | 0.00% | 0.00% |  |
| D | 9511 | 6858 | 214 | 214 | 2.25% | 3.12% | 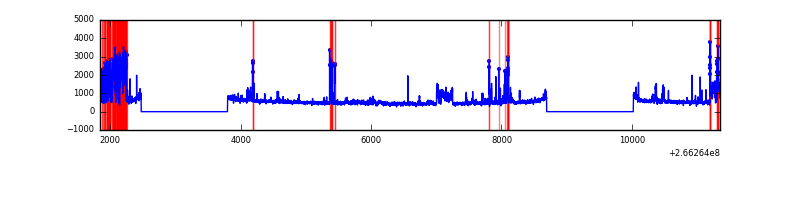 |
Top three noisy pixels from each quadrant. If the there are fewer than three noisy pixels in the level2.evt file, extra rows are filled as -1
| Pixel properties | Quadrant properties | ||||||
|---|---|---|---|---|---|---|---|
| Quadrant | DetID | PixID | Counts | Sigma | Mean | Median | Sigma |
| A | 0 | 23 | 4408257 | 24784.94 | 891 | 872 | 177.8 |
| A | 0 | 226 | 266304 | 1492.66 | 891 | 872 | 177.8 |
| A | 12 | 189 | 28867 | 157.43 | 891 | 872 | 177.8 |
| B | 10 | 16 | 103890 | 600.06 | 912 | 890 | 171.6 |
| B | 0 | 205 | 21454 | 119.8 | 912 | 890 | 171.6 |
| B | 12 | 111 | 19743 | 109.83 | 912 | 890 | 171.6 |
| C | 3 | 233 | 1890364 | 9172.28 | 897 | 904 | 206.0 |
| C | 3 | 234 | 11031 | 49.16 | 897 | 904 | 206.0 |
| C | 3 | 232 | 8260 | 35.71 | 897 | 904 | 206.0 |
| D | 10 | 199 | 732451 | 3496.02 | 885 | 864 | 209.3 |
| D | 12 | 110 | 285958 | 1362.37 | 885 | 864 | 209.3 |
| D | 2 | 152 | 90150 | 426.67 | 885 | 864 | 209.3 |
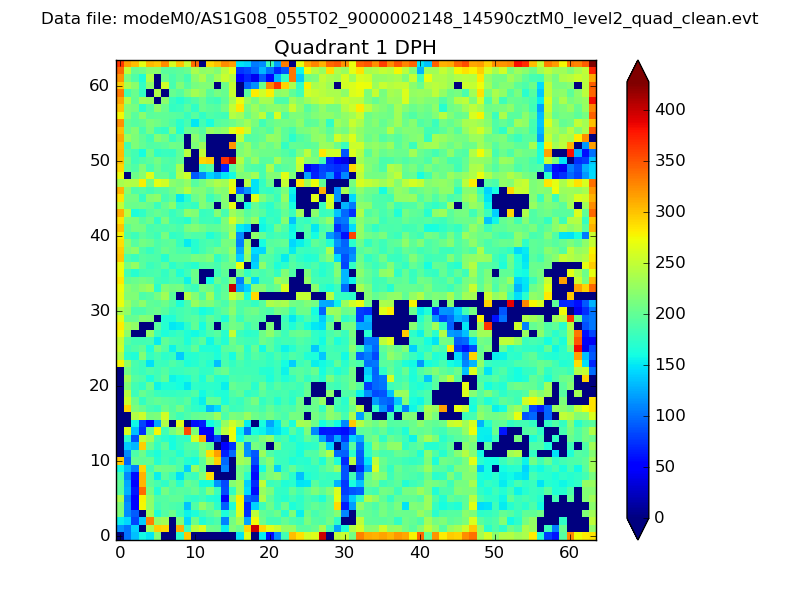
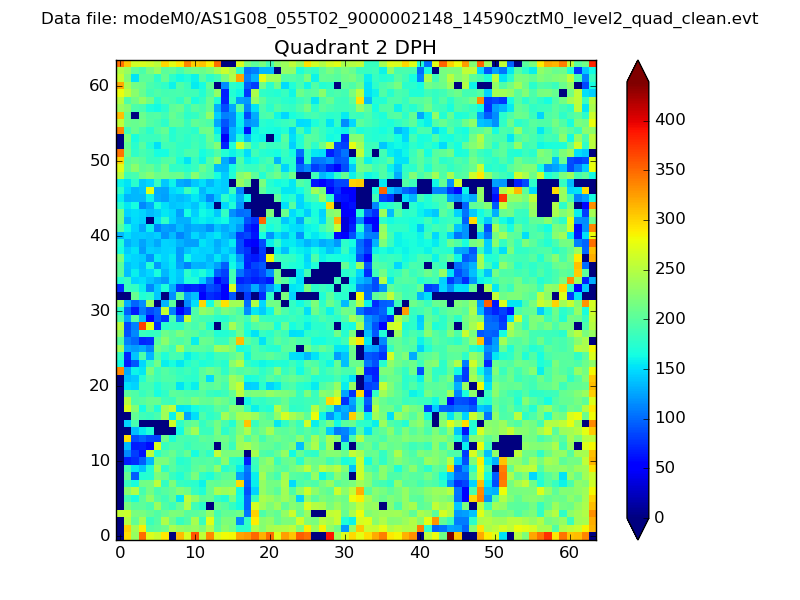
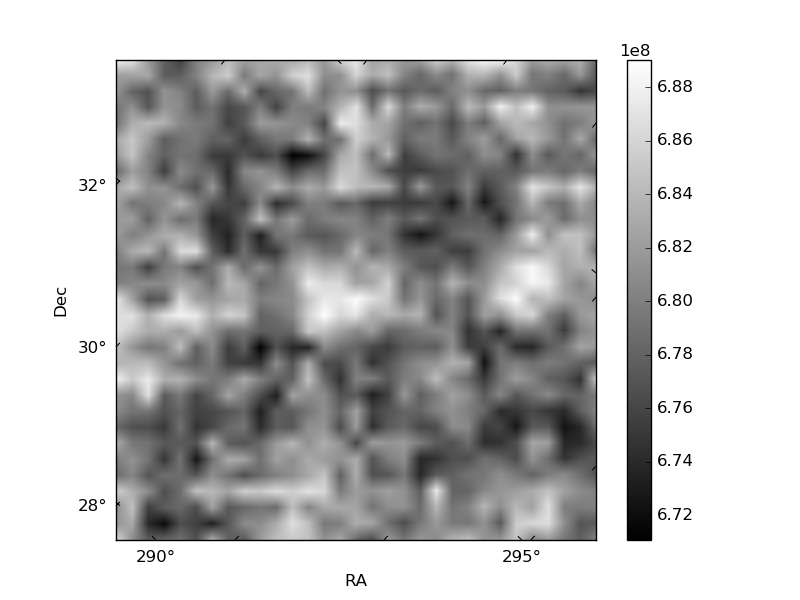
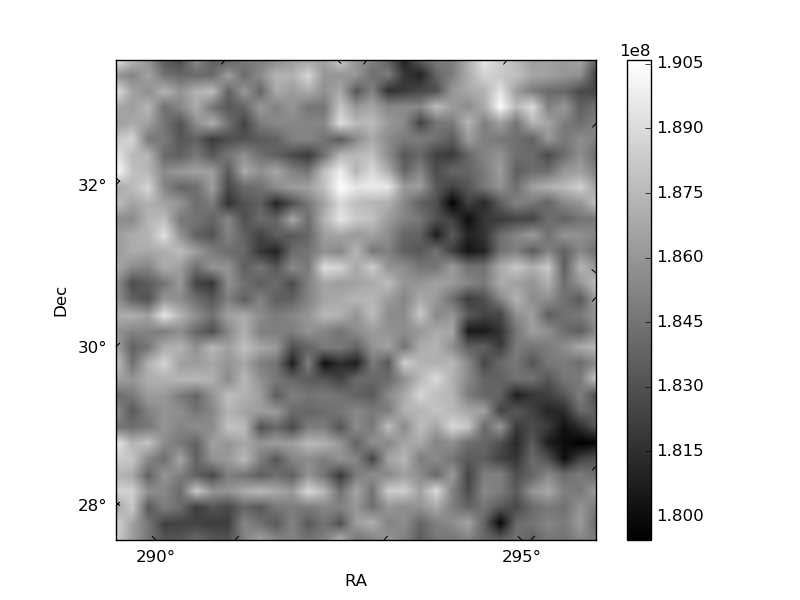
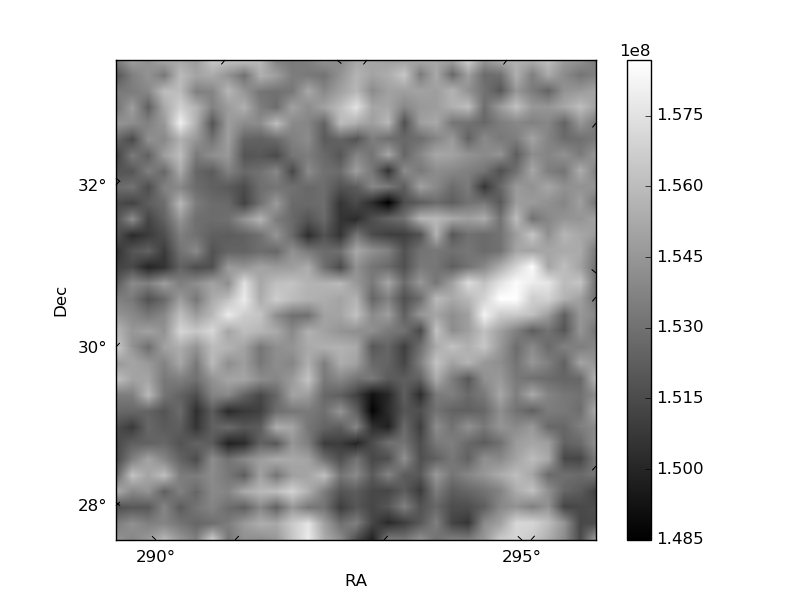
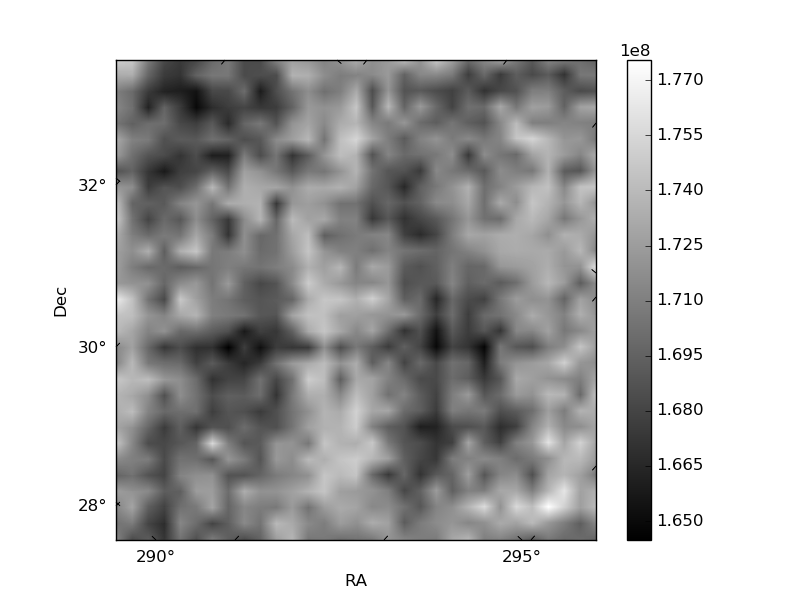
Histogram calculated using DETX and DETY for each event in the final _common_clean file
| Quadrant A | 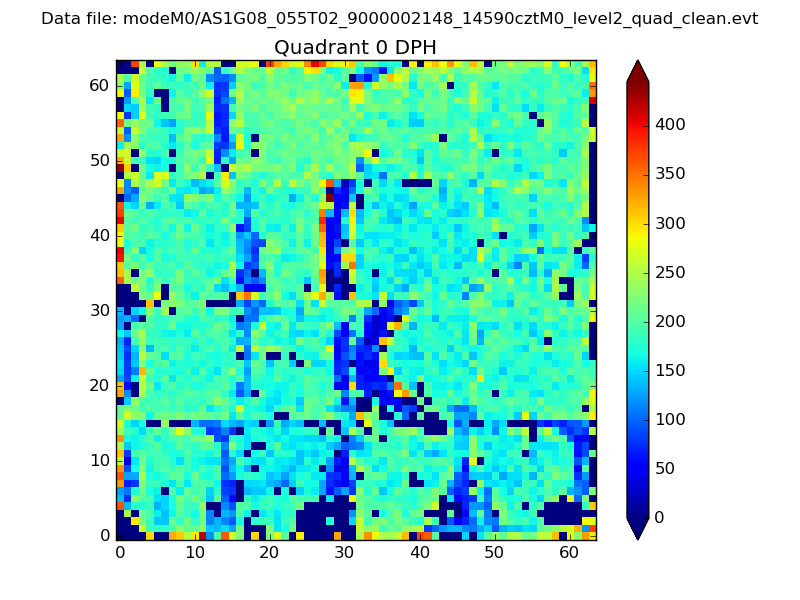 |
 |
Quadrant B |
|---|---|---|---|
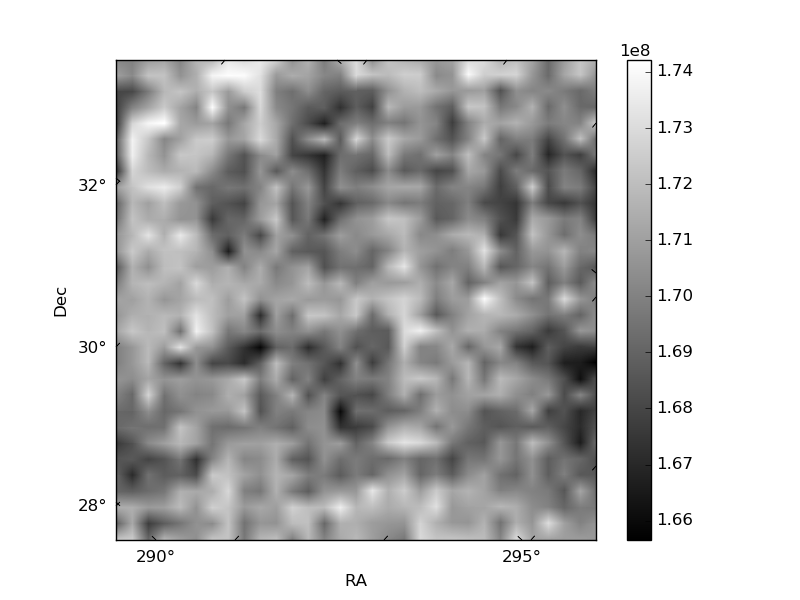
| Quadrant D | 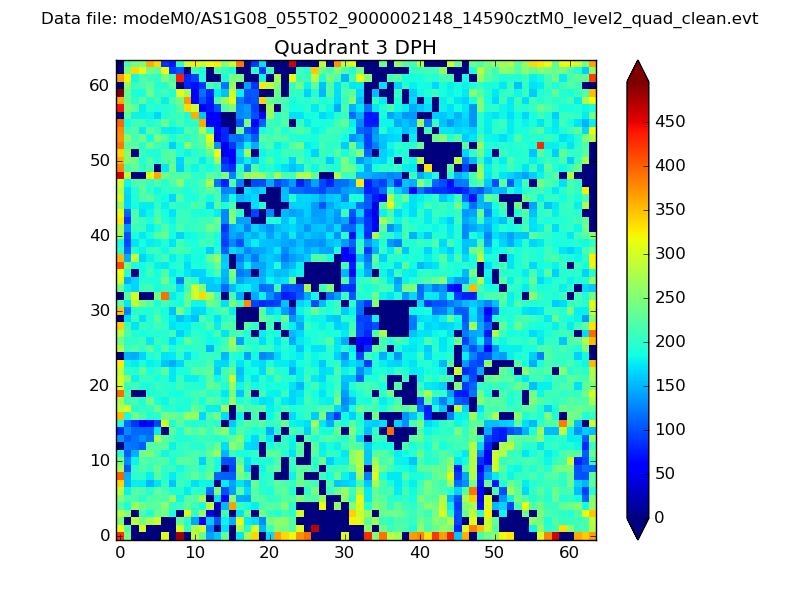 |
 |
Quadrant C |
| Plot type | Count rate plots | Images |
|---|---|---|
| Comparison with Poisson distribution Blue bars denote a histogram of data divided into 1 sec bins. Red curve is a Poisson curve with rate = median count rate of data. |
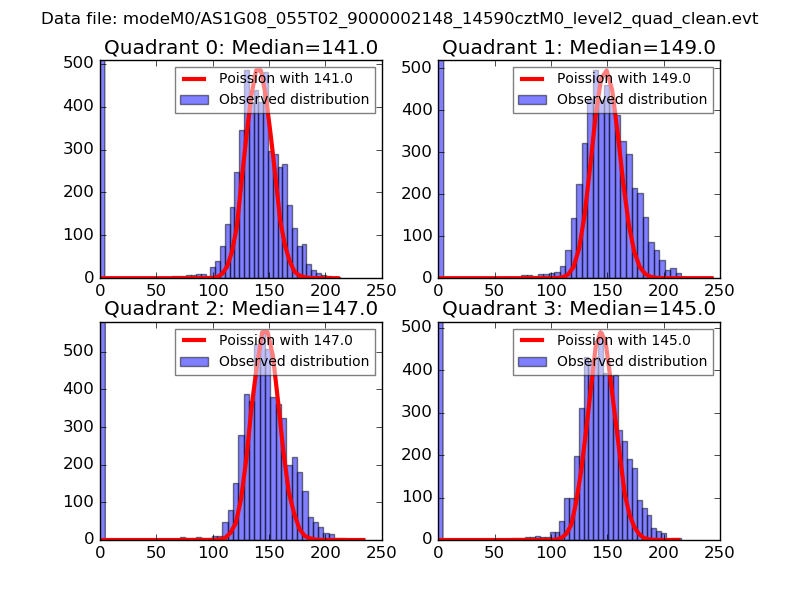 |
 |
| Quadrant-wise count rates Data is divided into 100 sec bins |
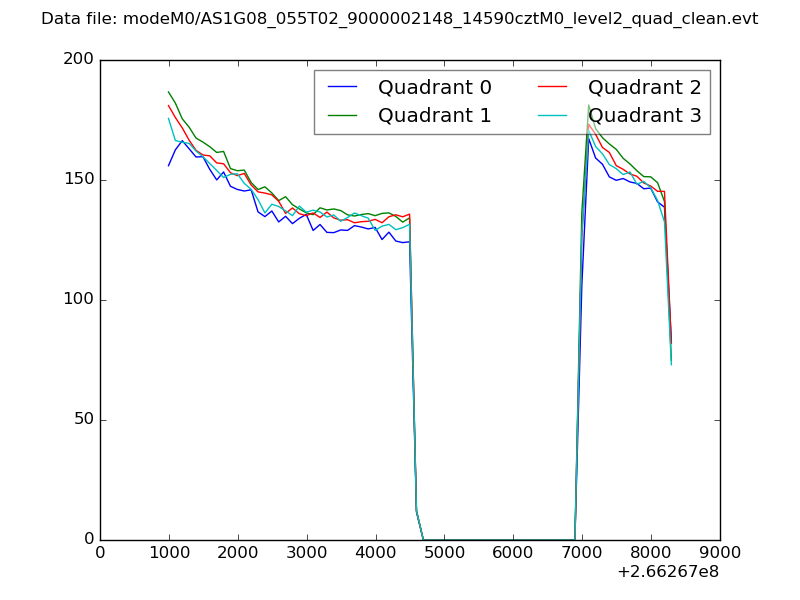 |
|
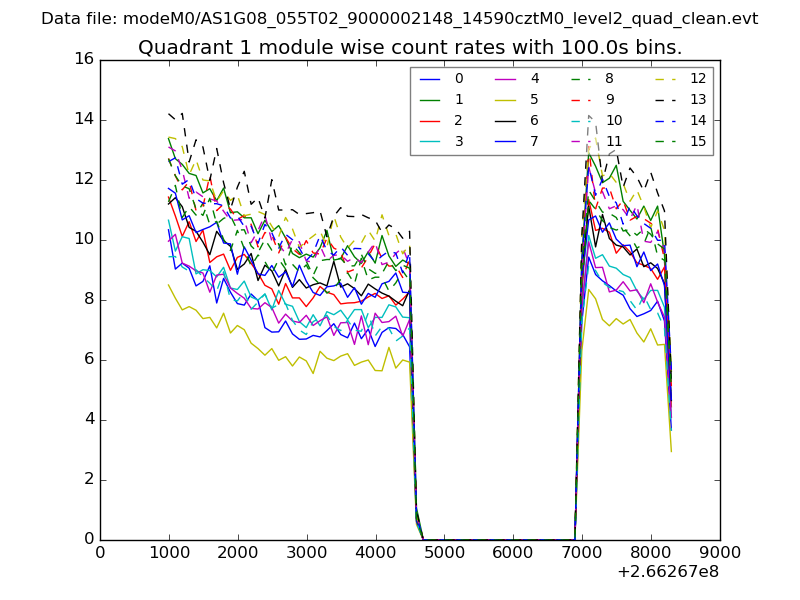
| Module-wise count rates for Quadrant A Data is divided into 100 sec bins |
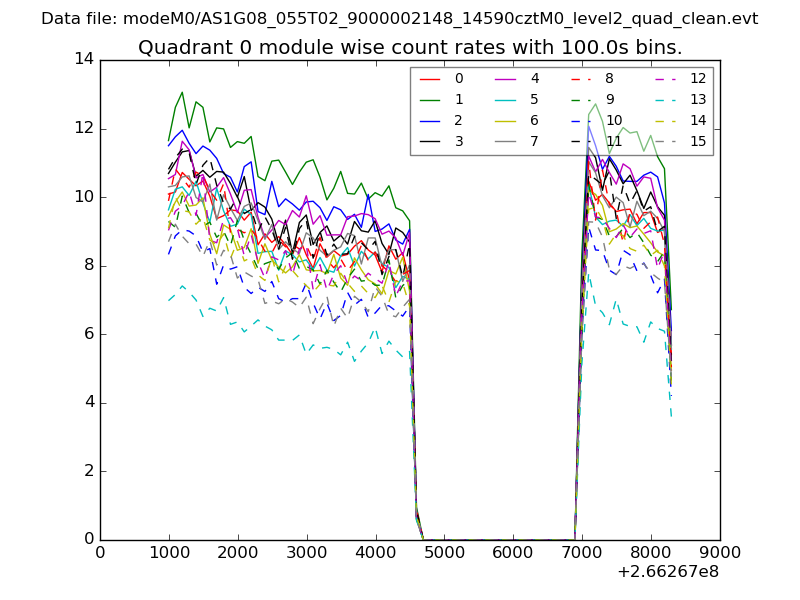 |
 |
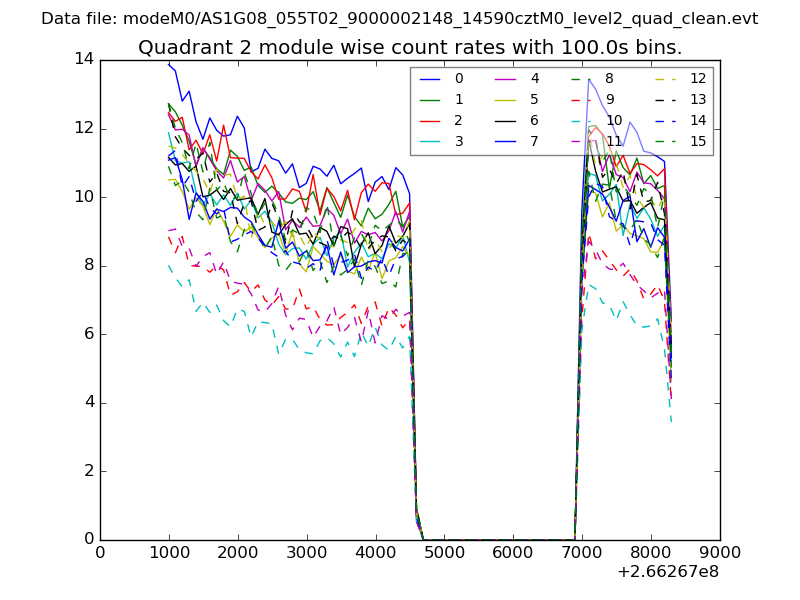
| Module-wise count rates for Quadrant B Data is divided into 100 sec bins |
 |
 |
| Module-wise count rates for Quadrant C Data is divided into 100 sec bins |
 |
 |
| Module-wise count rates for Quadrant D Data is divided into 100 sec bins |
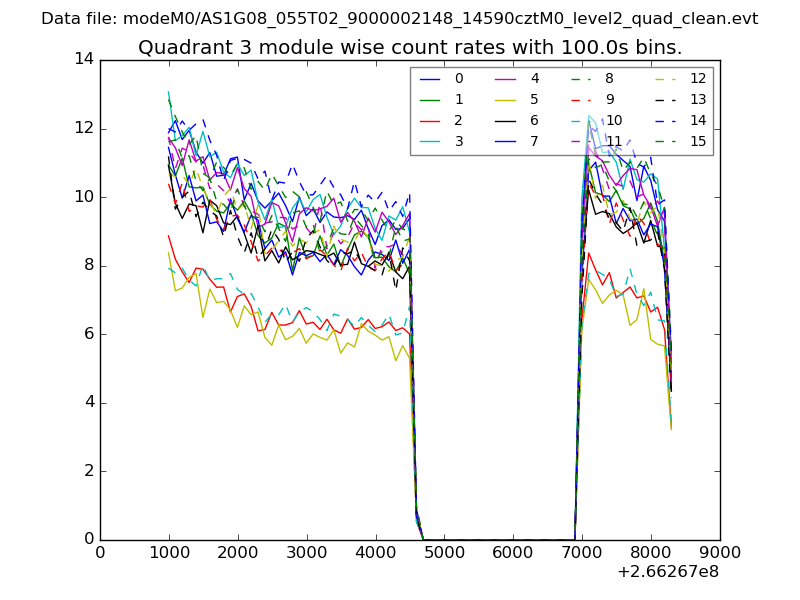 |
 |
| Parameter | Plot |
|---|---|
| CZT HV Monitor | 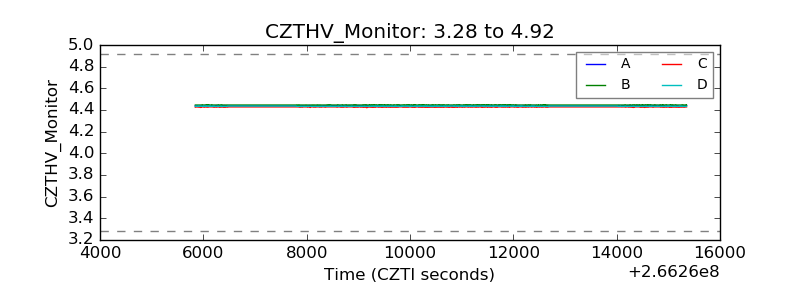 |
| D_VDD | 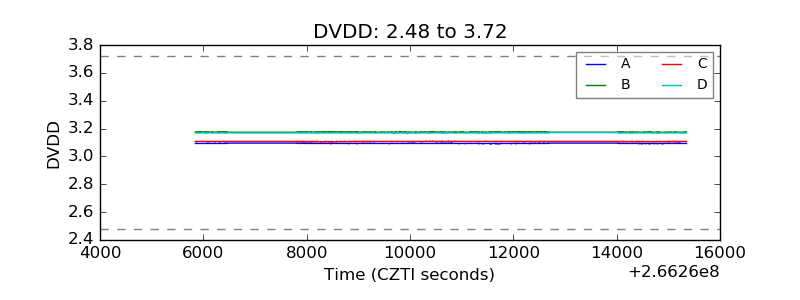 |
| Temperature 1 | 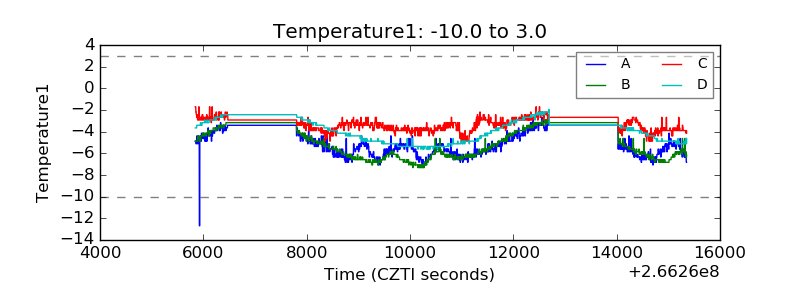 |
| Veto HV Monitor | 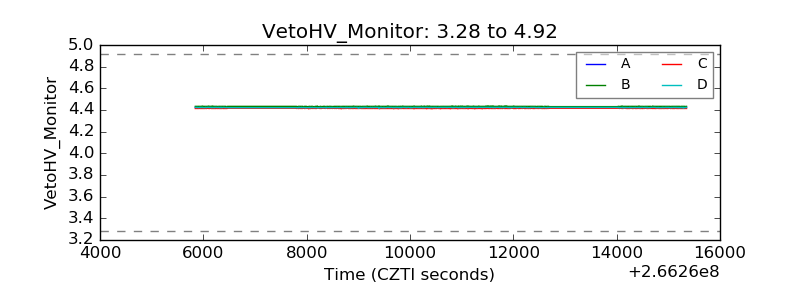 |
| Veto LLD | 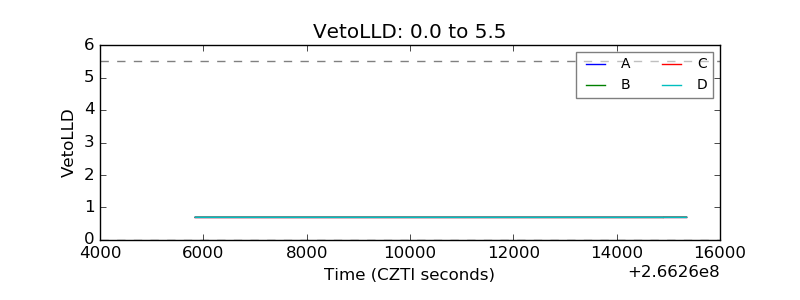 |
| Alpha Counter | 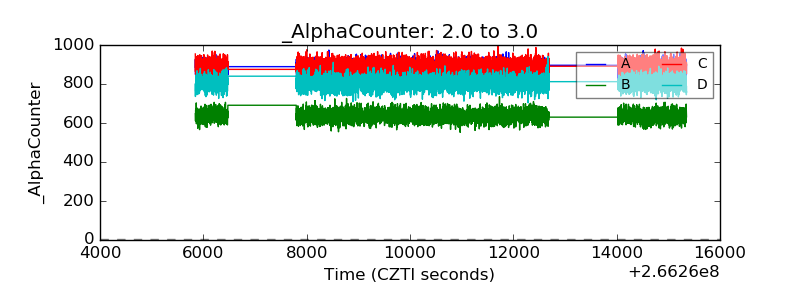 |
| _CPM_Rate | 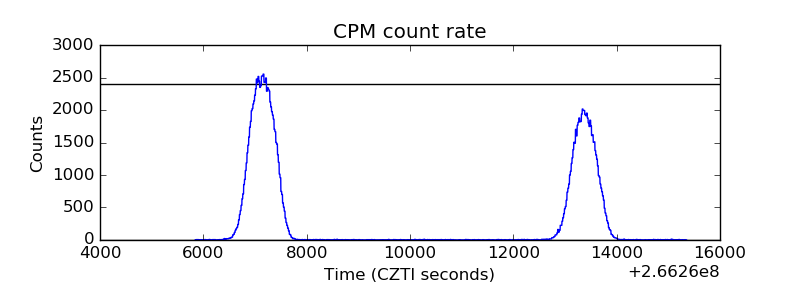 |
| CZT Counter | 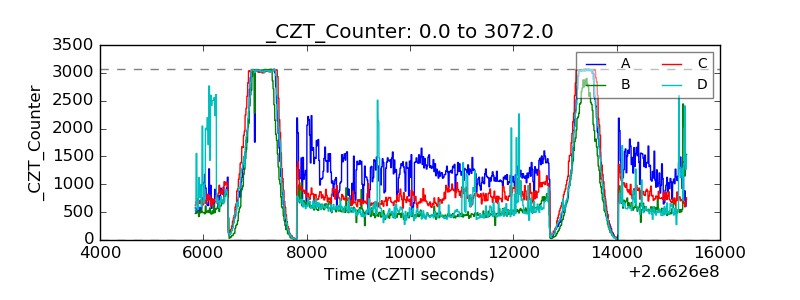 |
| +2.5 Volts monitor |  |
| +5 Volts monitor | 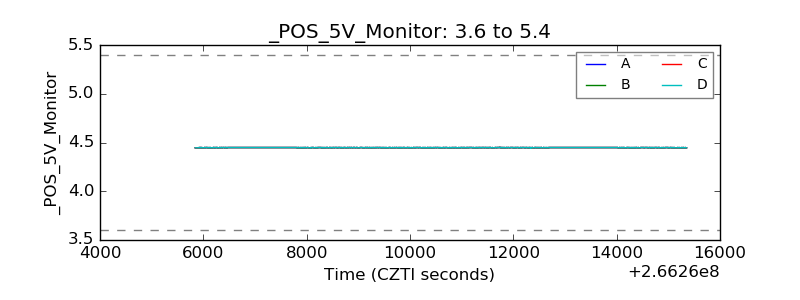 |
| _ROLL_ROT | 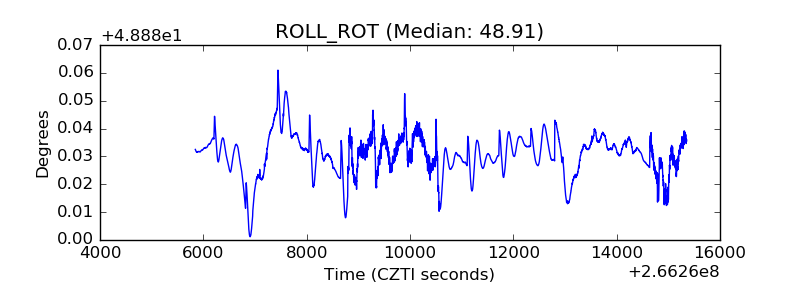 |
| _Roll_DEC | 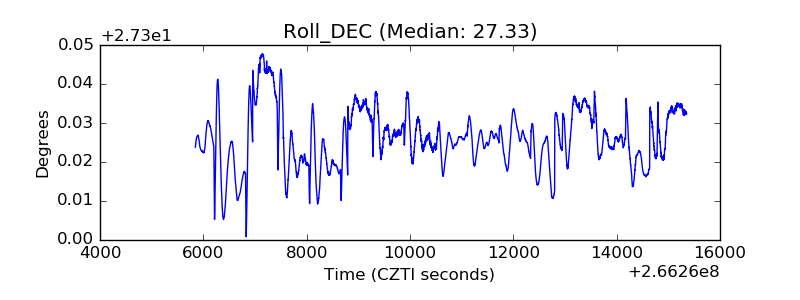 |
| _Roll_RA | 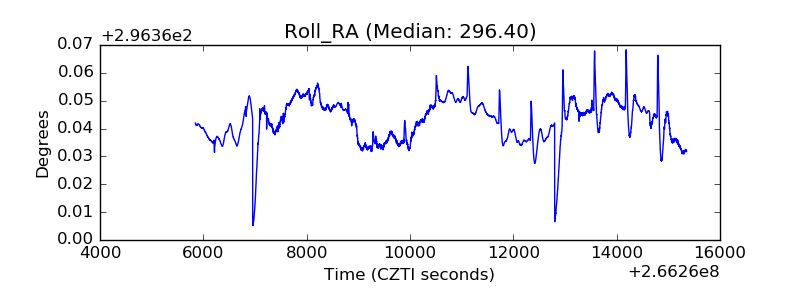 |
| Veto Counter | 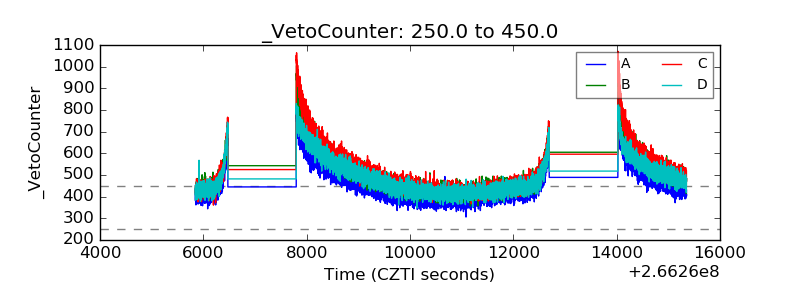 |