| Param | Original file | Final file |
|---|---|---|
| Filename | modeM0/AS1G08_055T02_9000002148_14591cztM0_level2.evt | modeM0/AS1G08_055T02_9000002148_14591cztM0_level2_quad_clean.evt |
| Size (bytes) | 716,192,640 | 102,536,640 |
| Size | 683.0 MB | 97.8 MB |
| Events in quadrant A | 7,930,899 | 647,732 |
| Events in quadrant B | 3,704,450 | 684,974 |
| Events in quadrant C | 4,650,618 | 672,382 |
| Events in quadrant D | 4,956,501 | 637,179 |
| Mode SS | |||
|---|---|---|---|
| Quadrant | BADHDUFLAG | Total packets | Discarded packets |
| A | 0 | 138 | 0 |
| B | 0 | 138 | 0 |
| C | 0 | 138 | 0 |
| D | 0 | 138 | 0 |
| Mode M9 | |||
|---|---|---|---|
| Quadrant | BADHDUFLAG | Total packets | Discarded packets |
| A | 0 | 25 | 0 |
| B | 0 | 25 | 0 |
| C | 0 | 25 | 0 |
| D | 0 | 25 | 0 |
| Mode M0 | |||
|---|---|---|---|
| Quadrant | BADHDUFLAG | Total packets | Discarded packets |
| A | 0 | 28246 | 3 |
| B | 0 | 15318 | 2 |
| C | 0 | 18802 | 2 |
| D | 0 | 19022 | 2 |
| Quadrant | Total seconds | Saturated seconds | Saturation percentage |
|---|---|---|---|
| A | 6635 | 470 | 7.083647% |
| B | 6635 | 142 | 2.140166% |
| C | 6635 | 114 | 1.718161% |
| D | 6635 | 611 | 9.208742% |
Noise dominated data is calculated using 1-second bins in cleaned event files. If a bin has >2000 counts, and if more than 50% of those come from <1% of pixels, then it is considered to be noise-dominated and hence unusable.
| Quadrant | # 1 sec bins | Bins with >0 counts | Bins with >2000 counts | High rate bins dominated by noise | Noise dominated (total time) | Noise dominated (detector-on time) | Marked lightcurve |
|---|---|---|---|---|---|---|---|
| A | 9231 | 6638 | 33 | 33 | 0.36% | 0.50% | 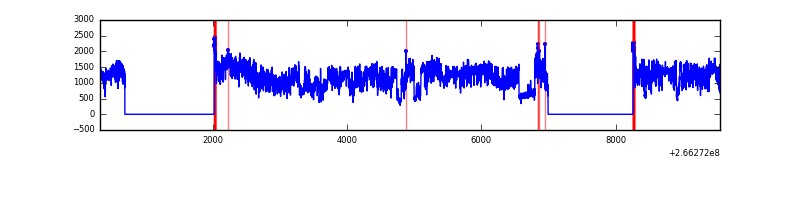 |
| B | 9231 | 6638 | 42 | 42 | 0.45% | 0.63% | 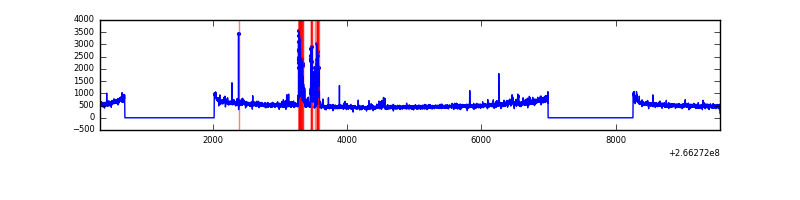 |
| C | 9231 | 6638 | 0 | 0 | 0.00% | 0.00% | 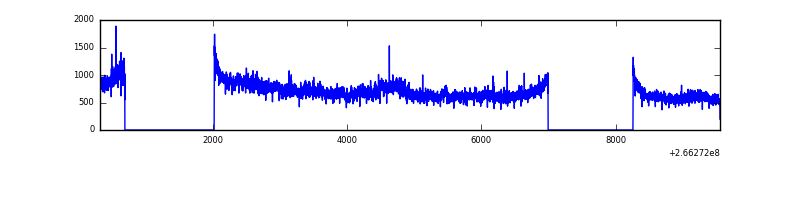 |
| D | 9231 | 6637 | 437 | 437 | 4.73% | 6.58% | 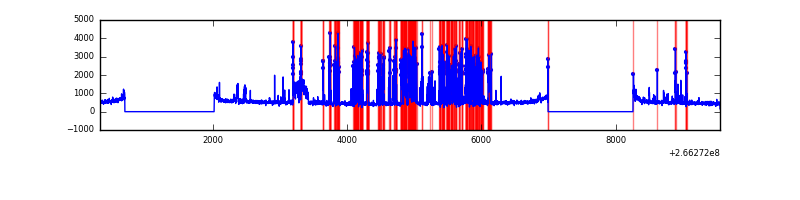 |
Top three noisy pixels from each quadrant. If the there are fewer than three noisy pixels in the level2.evt file, extra rows are filled as -1
| Pixel properties | Quadrant properties | ||||||
|---|---|---|---|---|---|---|---|
| Quadrant | DetID | PixID | Counts | Sigma | Mean | Median | Sigma |
| A | 0 | 23 | 4421680 | 26395.38 | 836 | 819 | 167.5 |
| A | 0 | 226 | 266111 | 1583.96 | 836 | 819 | 167.5 |
| A | 12 | 189 | 15690 | 88.79 | 836 | 819 | 167.5 |
| B | 10 | 16 | 249815 | 1528.13 | 858 | 836 | 162.9 |
| B | 0 | 214 | 24772 | 146.91 | 858 | 836 | 162.9 |
| B | 0 | 189 | 22655 | 133.92 | 858 | 836 | 162.9 |
| C | 3 | 233 | 1349101 | 6936.86 | 844 | 851 | 194.4 |
| C | 3 | 234 | 7018 | 31.73 | 844 | 851 | 194.4 |
| C | 13 | 61 | 5975 | 26.36 | 844 | 851 | 194.4 |
| D | 10 | 199 | 1473324 | 7776.03 | 803 | 783 | 189.4 |
| D | 12 | 110 | 199197 | 1047.76 | 803 | 783 | 189.4 |
| D | 2 | 120 | 149501 | 785.33 | 803 | 783 | 189.4 |
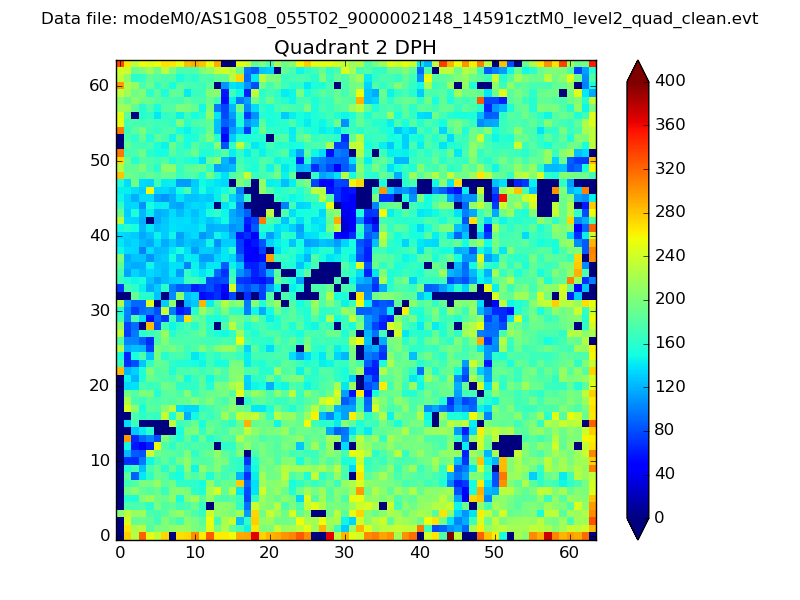
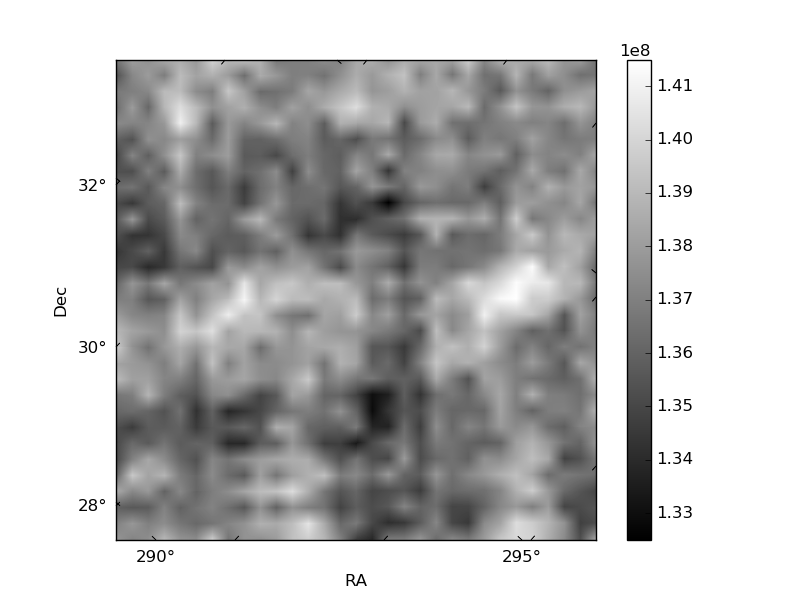
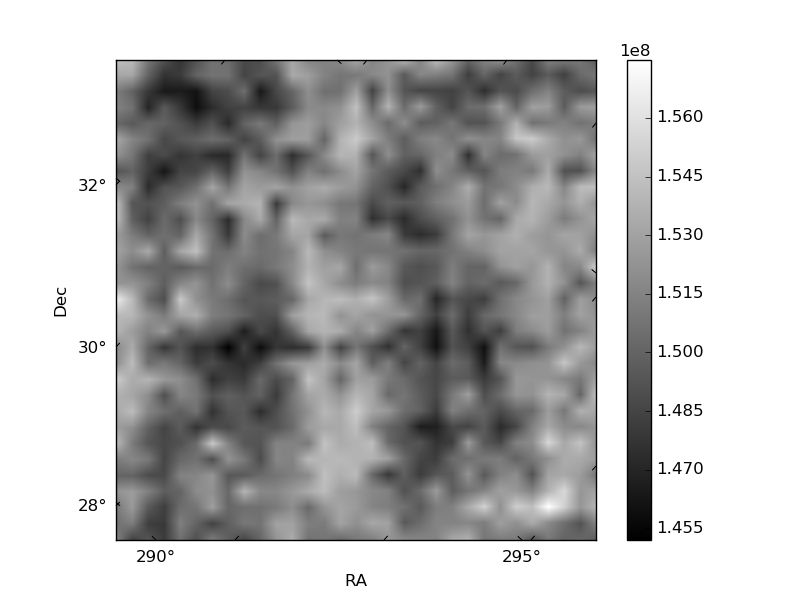
Histogram calculated using DETX and DETY for each event in the final _common_clean file
| Quadrant A | 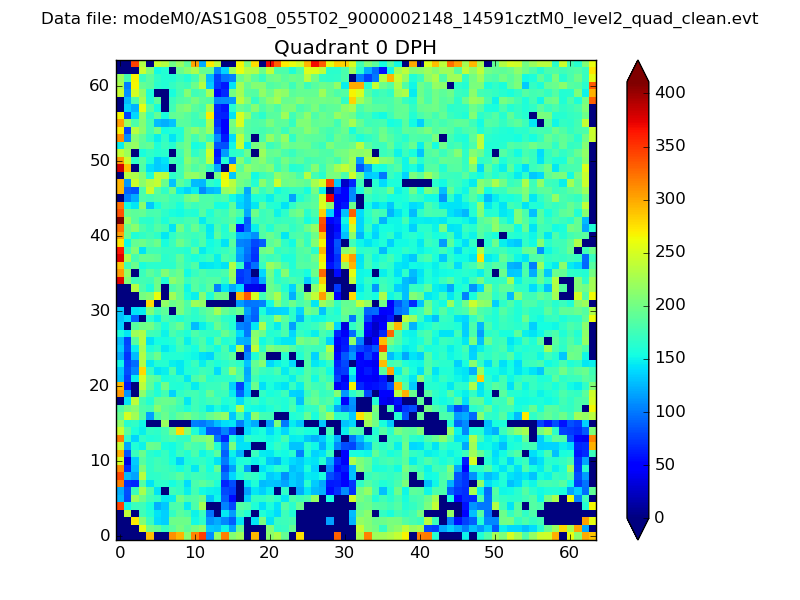 |
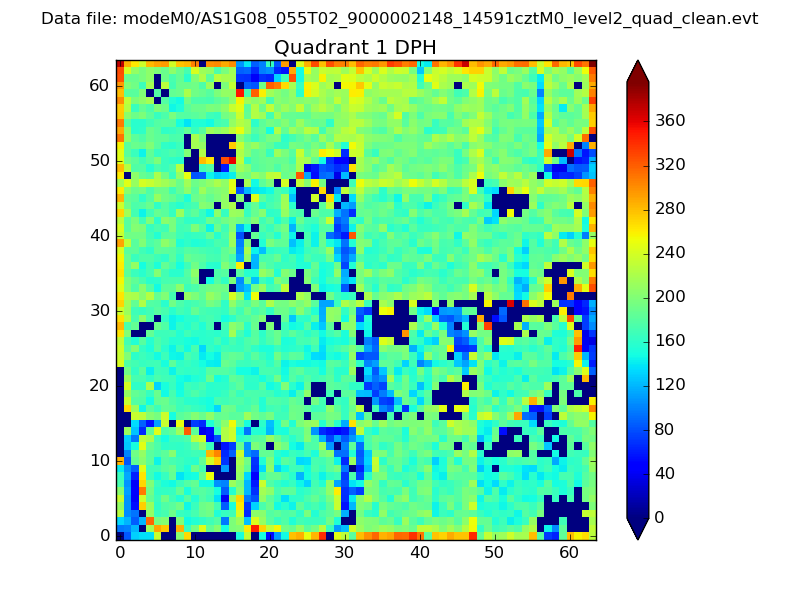 |
Quadrant B |
|---|---|---|---|
| Quadrant D | 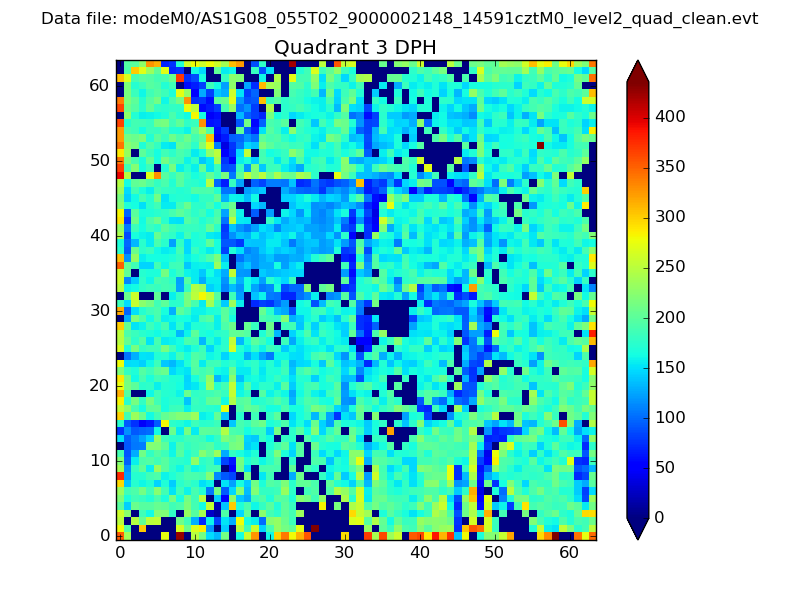 |
 |
Quadrant C |
| Plot type | Count rate plots | Images |
|---|---|---|
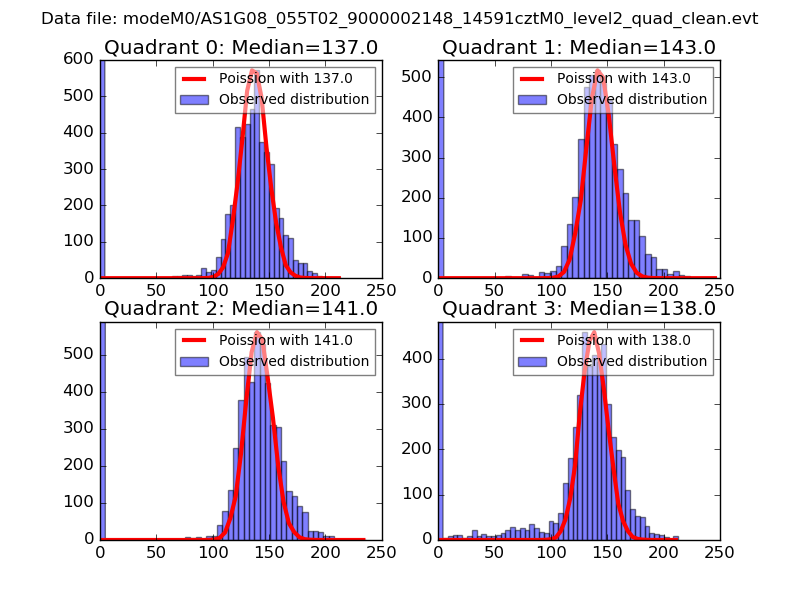
| Comparison with Poisson distribution Blue bars denote a histogram of data divided into 1 sec bins. Red curve is a Poisson curve with rate = median count rate of data. |
 |
 |
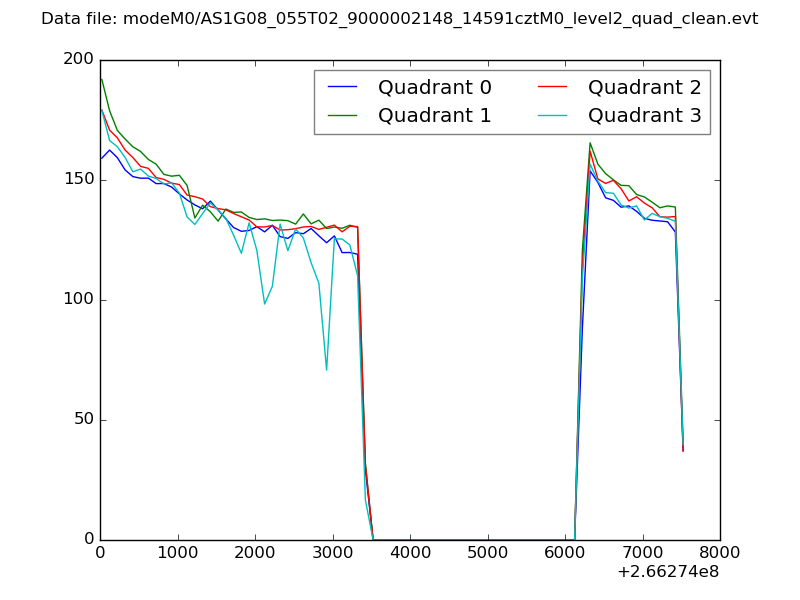
| Quadrant-wise count rates Data is divided into 100 sec bins |
 |
|
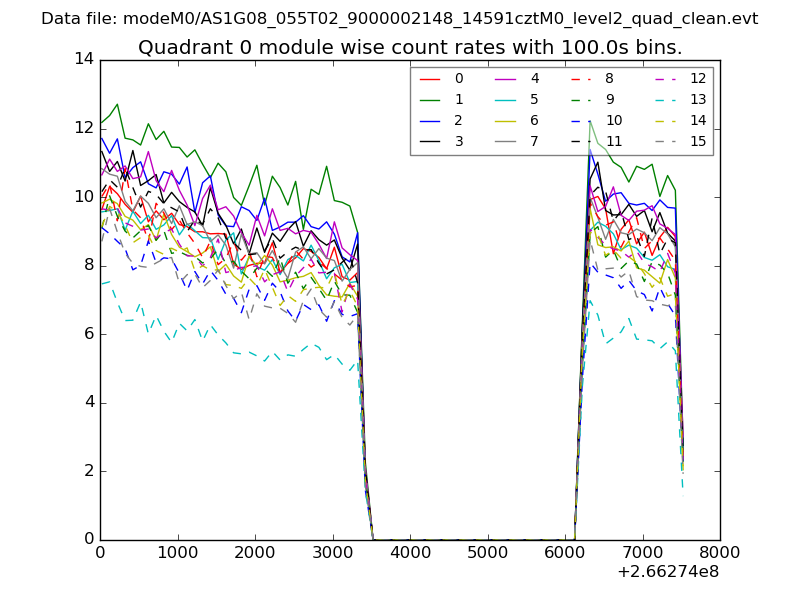
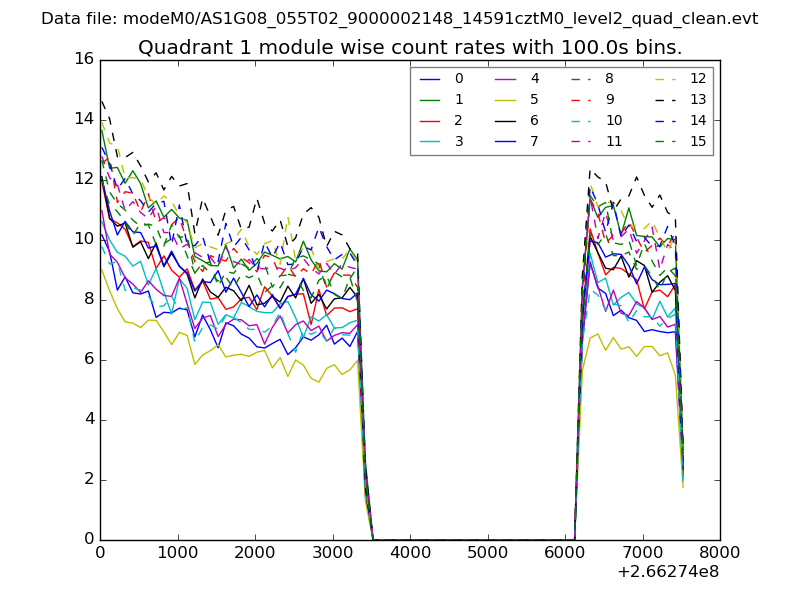
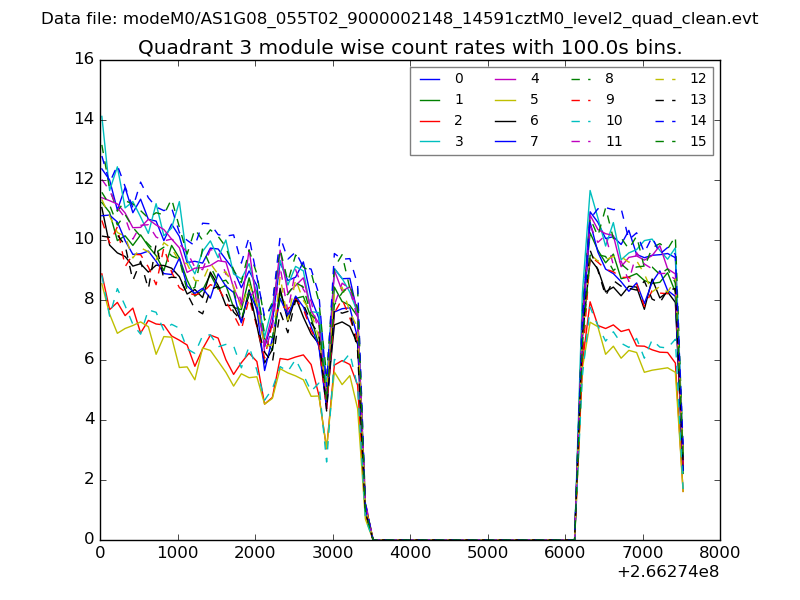
| Module-wise count rates for Quadrant A Data is divided into 100 sec bins |
 |
 |
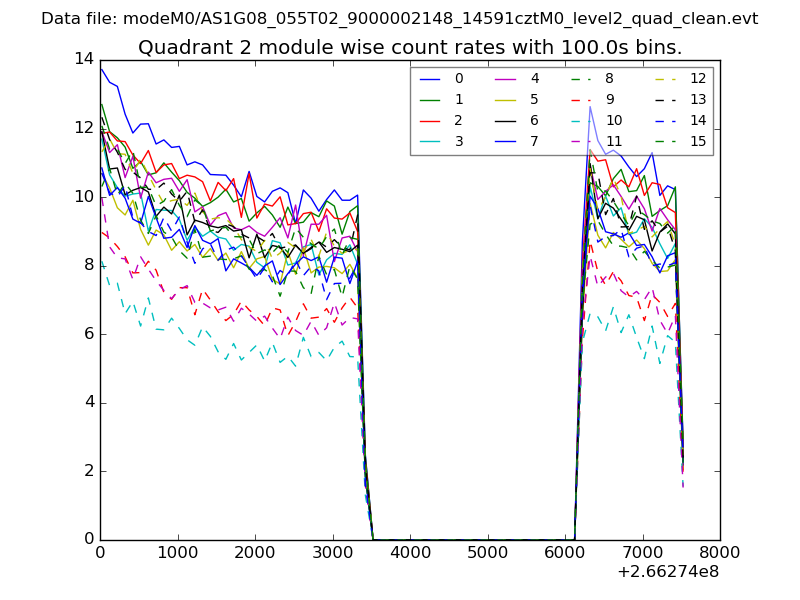
| Module-wise count rates for Quadrant B Data is divided into 100 sec bins |
 |
 |
| Module-wise count rates for Quadrant C Data is divided into 100 sec bins |
 |
 |
| Module-wise count rates for Quadrant D Data is divided into 100 sec bins |
 |
 |
| Parameter | Plot |
|---|---|
| CZT HV Monitor | 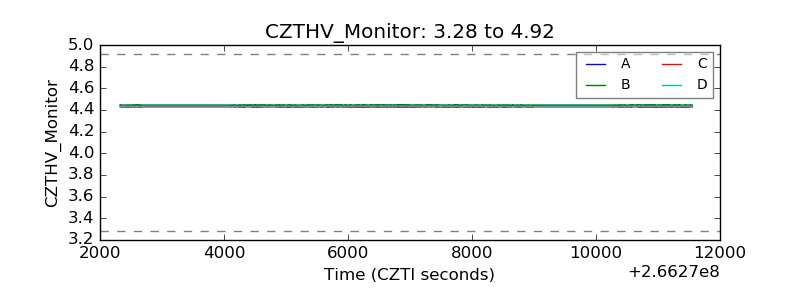 |
| D_VDD |  |
| Temperature 1 | 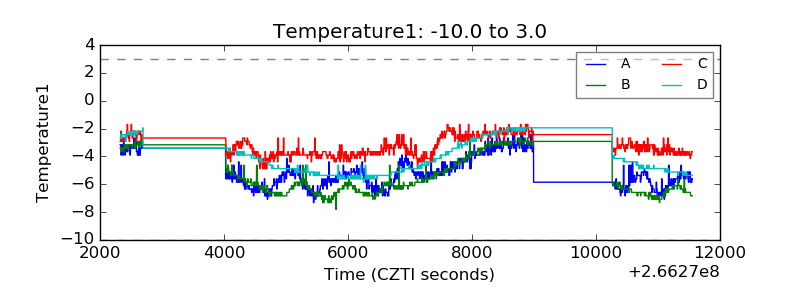 |
| Veto HV Monitor | 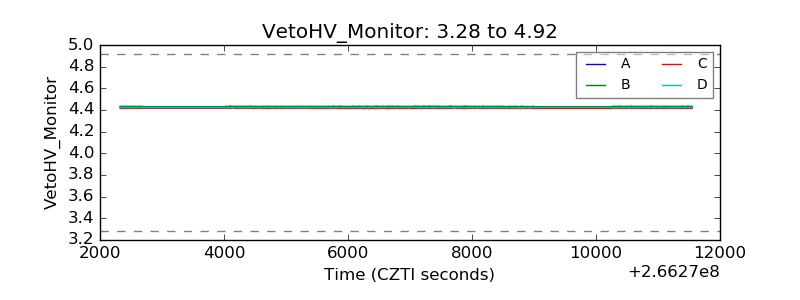 |
| Veto LLD | 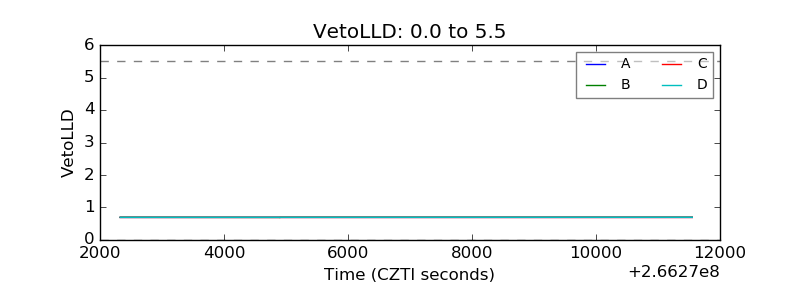 |
| Alpha Counter | 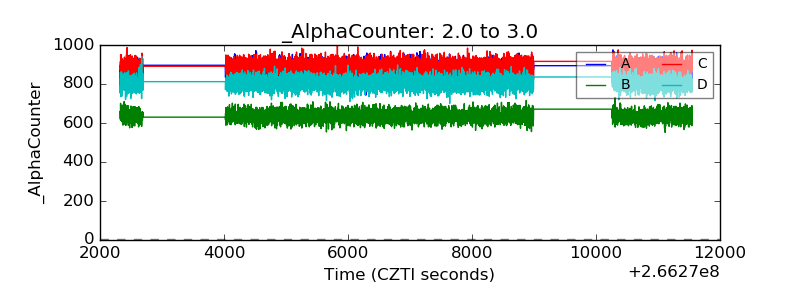 |
| _CPM_Rate | 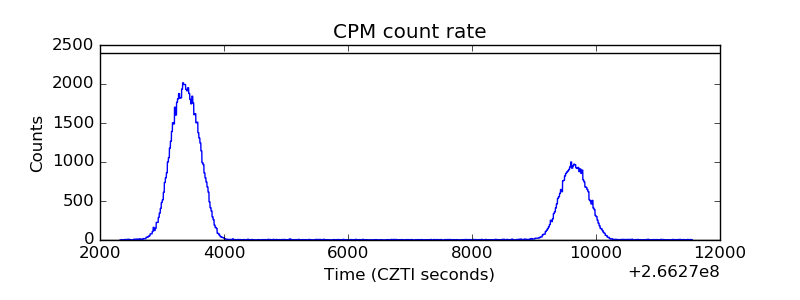 |
| CZT Counter | 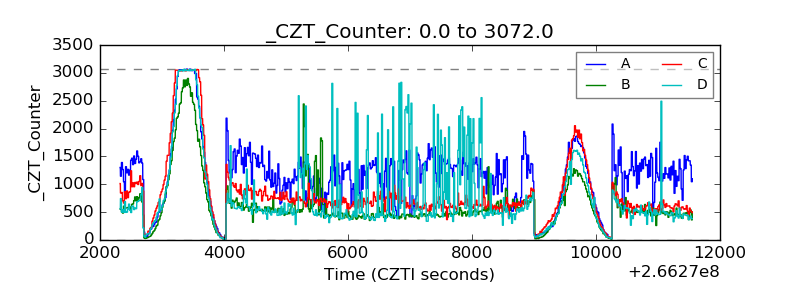 |
| +2.5 Volts monitor | 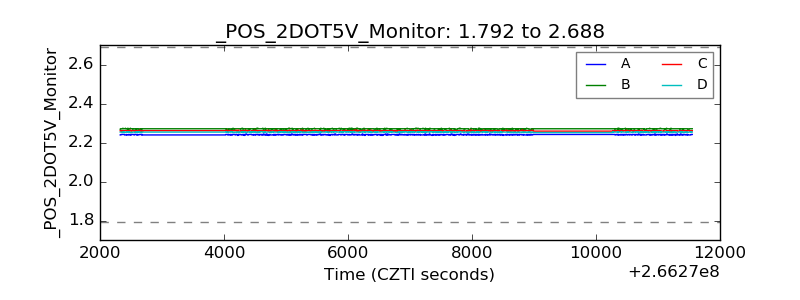 |
| +5 Volts monitor |  |
| _ROLL_ROT | 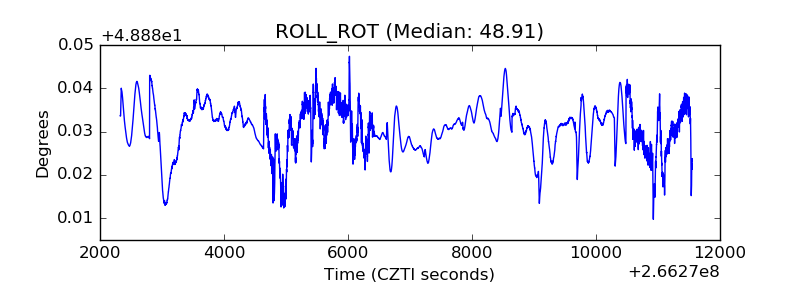 |
| _Roll_DEC | 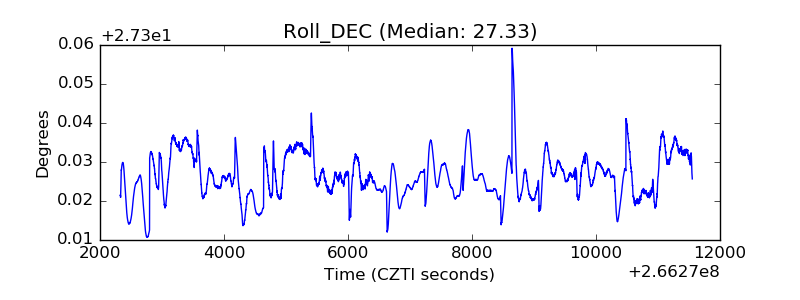 |
| _Roll_RA | 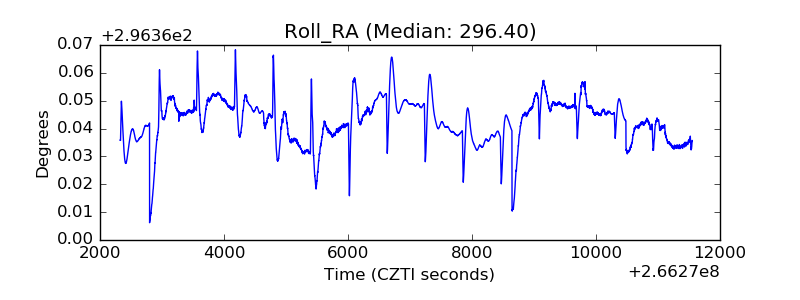 |
| Veto Counter | 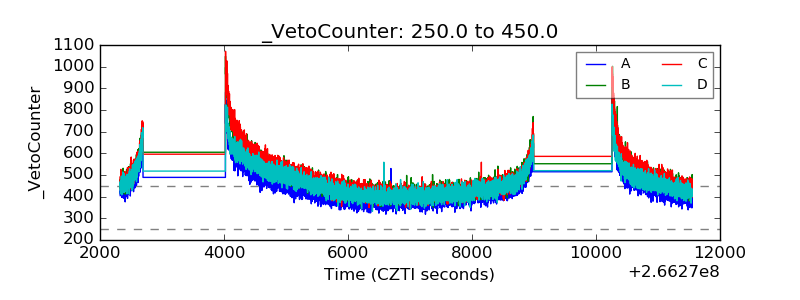 |