| Param | Original file | Final file |
|---|---|---|
| Filename | modeM0/AS1G08_055T02_9000002148_14592cztM0_level2.evt | modeM0/AS1G08_055T02_9000002148_14592cztM0_level2_quad_clean.evt |
| Size (bytes) | 711,786,240 | 93,015,360 |
| Size | 678.8 MB | 88.7 MB |
| Events in quadrant A | 9,072,053 | 567,871 |
| Events in quadrant B | 3,455,095 | 603,592 |
| Events in quadrant C | 4,006,014 | 589,629 |
| Events in quadrant D | 4,556,587 | 573,609 |
| Mode SS | |||
|---|---|---|---|
| Quadrant | BADHDUFLAG | Total packets | Discarded packets |
| A | 0 | 142 | 0 |
| B | 0 | 142 | 0 |
| C | 0 | 142 | 0 |
| D | 0 | 142 | 0 |
| Mode M9 | |||
|---|---|---|---|
| Quadrant | BADHDUFLAG | Total packets | Discarded packets |
| A | 0 | 23 | 0 |
| B | 0 | 23 | 0 |
| C | 0 | 23 | 0 |
| D | 0 | 23 | 0 |
| Mode M0 | |||
|---|---|---|---|
| Quadrant | BADHDUFLAG | Total packets | Discarded packets |
| A | 0 | 31828 | 3 |
| B | 0 | 14797 | 2 |
| C | 0 | 16120 | 2 |
| D | 0 | 18219 | 2 |
| Quadrant | Total seconds | Saturated seconds | Saturation percentage |
|---|---|---|---|
| A | 6921 | 728 | 10.518711% |
| B | 6921 | 74 | 1.069210% |
| C | 6921 | 74 | 1.069210% |
| D | 6921 | 469 | 6.776477% |
Noise dominated data is calculated using 1-second bins in cleaned event files. If a bin has >2000 counts, and if more than 50% of those come from <1% of pixels, then it is considered to be noise-dominated and hence unusable.
| Quadrant | # 1 sec bins | Bins with >0 counts | Bins with >2000 counts | High rate bins dominated by noise | Noise dominated (total time) | Noise dominated (detector-on time) | Marked lightcurve |
|---|---|---|---|---|---|---|---|
| A | 9232 | 6925 | 60 | 60 | 0.65% | 0.87% | 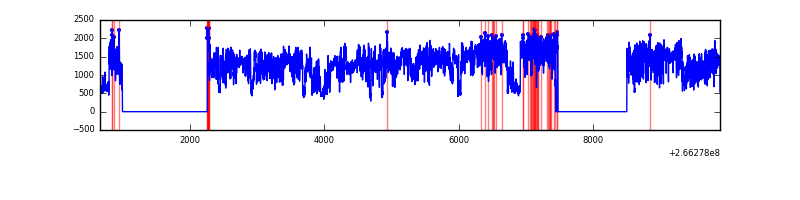 |
| B | 9232 | 6925 | 0 | 0 | 0.00% | 0.00% | 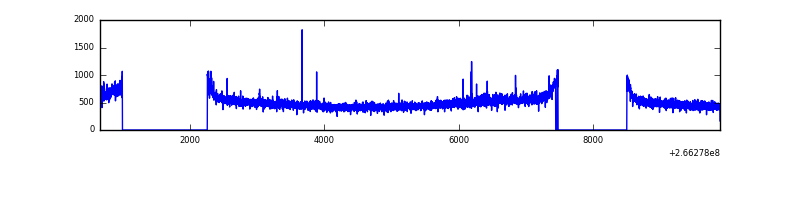 |
| C | 9232 | 6925 | 0 | 0 | 0.00% | 0.00% | 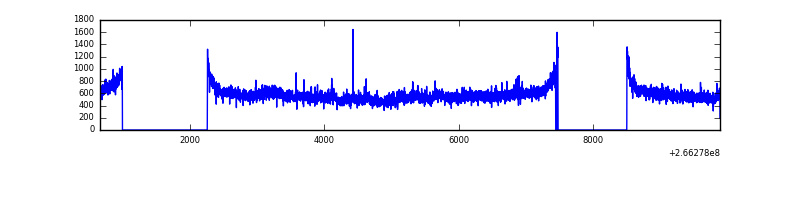 |
| D | 9232 | 6924 | 302 | 302 | 3.27% | 4.36% | 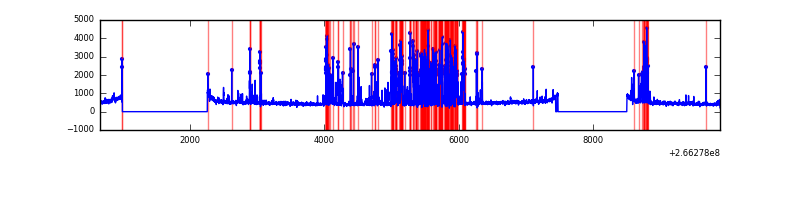 |
Top three noisy pixels from each quadrant. If the there are fewer than three noisy pixels in the level2.evt file, extra rows are filled as -1
| Pixel properties | Quadrant properties | ||||||
|---|---|---|---|---|---|---|---|
| Quadrant | DetID | PixID | Counts | Sigma | Mean | Median | Sigma |
| A | 0 | 23 | 5415211 | 31706.8 | 841 | 824 | 170.8 |
| A | 0 | 226 | 328478 | 1918.75 | 841 | 824 | 170.8 |
| A | 1 | 162 | 33218 | 189.7 | 841 | 824 | 170.8 |
| B | 0 | 189 | 22187 | 128.65 | 869 | 848 | 165.9 |
| B | 12 | 111 | 19886 | 114.78 | 869 | 848 | 165.9 |
| B | 11 | 111 | 16681 | 95.46 | 869 | 848 | 165.9 |
| C | 3 | 233 | 688065 | 3471.22 | 849 | 856 | 198.0 |
| C | 13 | 61 | 6016 | 26.06 | 849 | 856 | 198.0 |
| C | 8 | 222 | 4207 | 16.93 | 849 | 856 | 198.0 |
| D | 10 | 199 | 1314363 | 6774.35 | 814 | 794 | 193.9 |
| D | 2 | 136 | 43440 | 219.93 | 814 | 794 | 193.9 |
| D | 2 | 152 | 26080 | 130.41 | 814 | 794 | 193.9 |
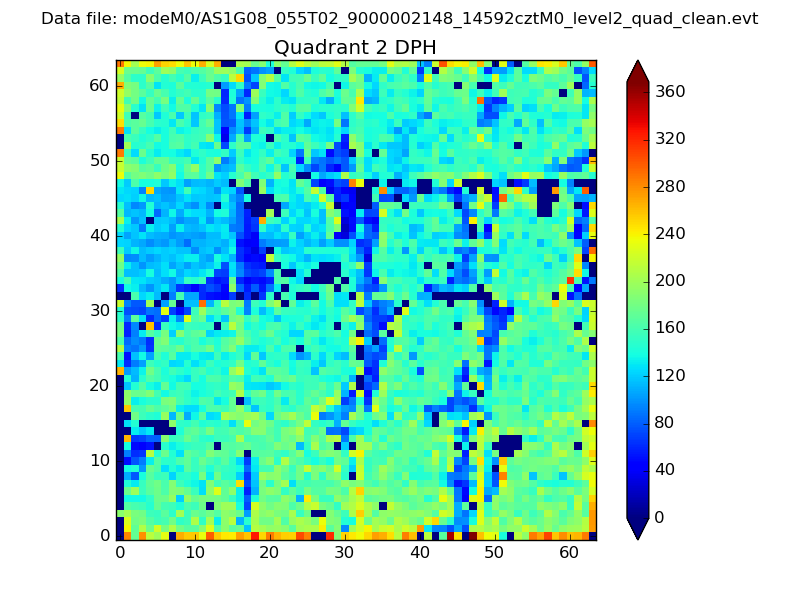
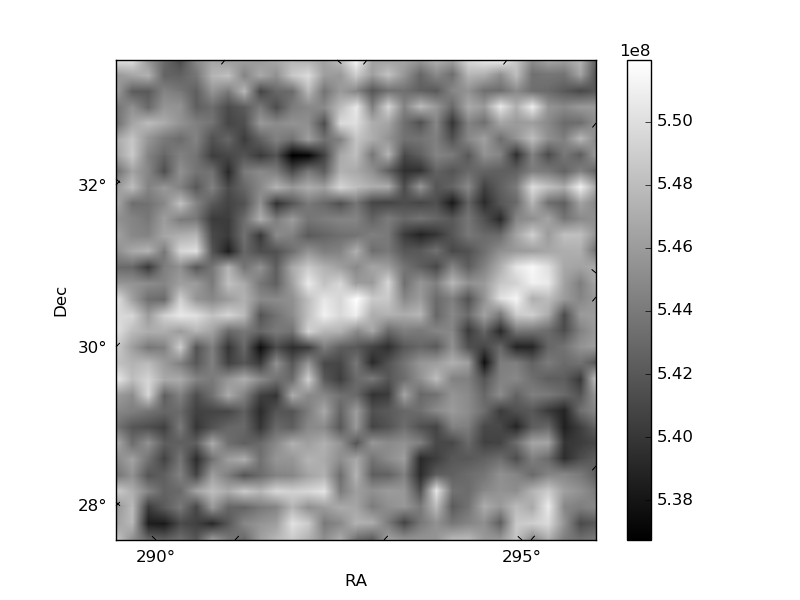
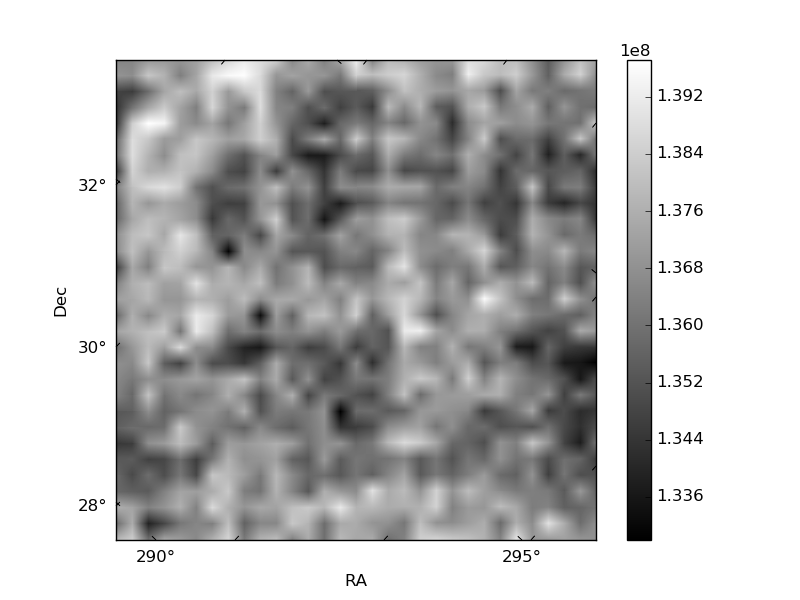
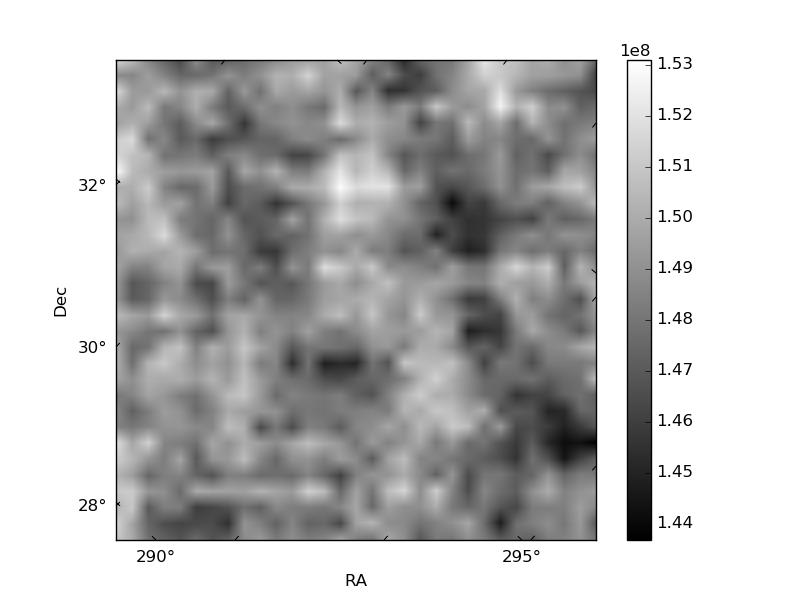
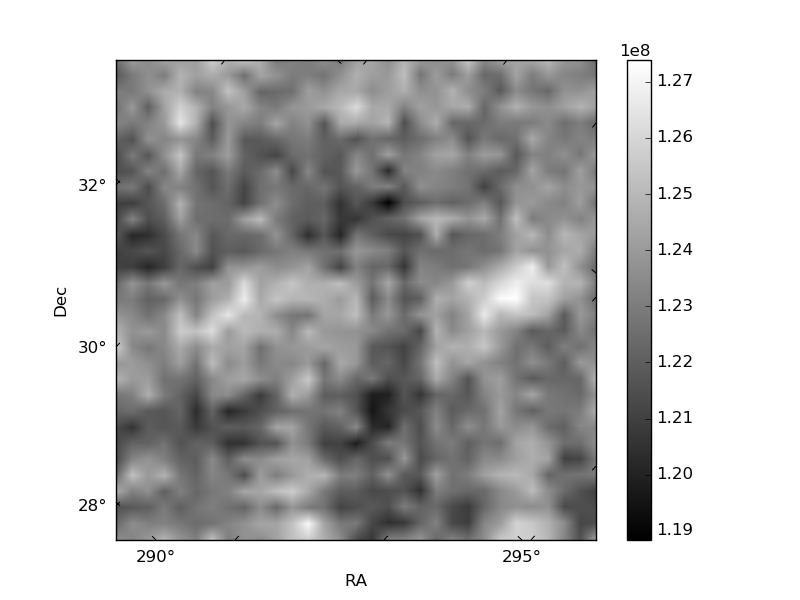
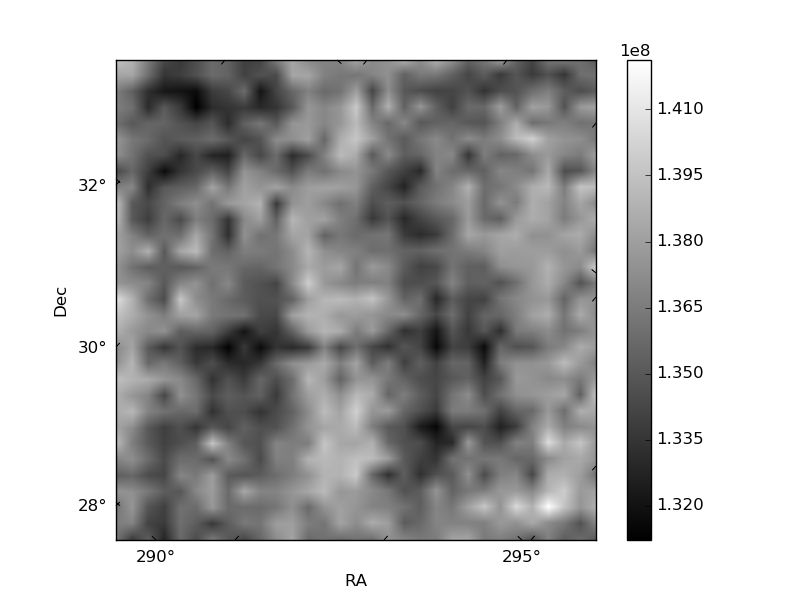
Histogram calculated using DETX and DETY for each event in the final _common_clean file
| Quadrant A | 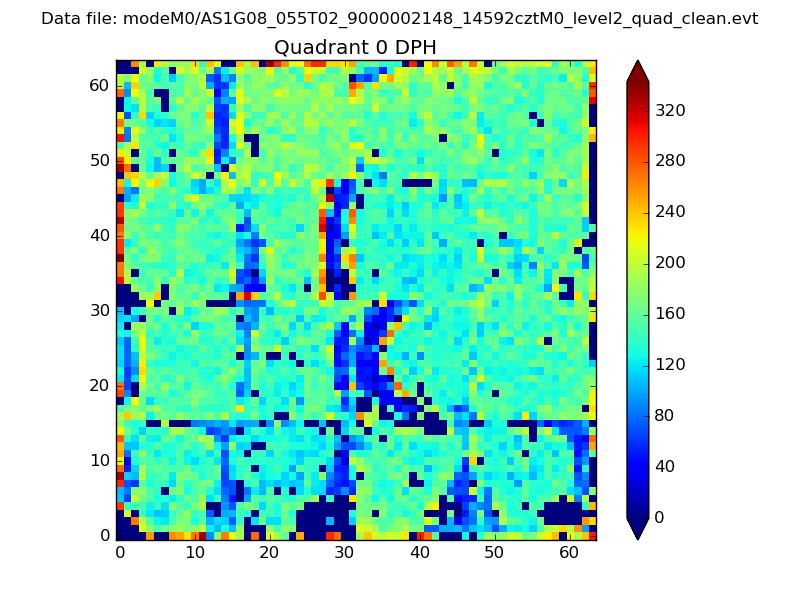 |
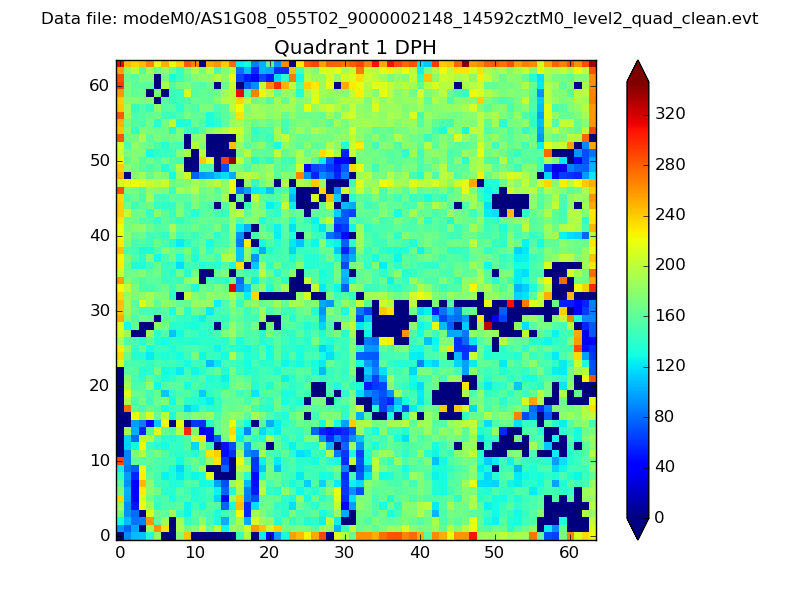 |
Quadrant B |
|---|---|---|---|
| Quadrant D | 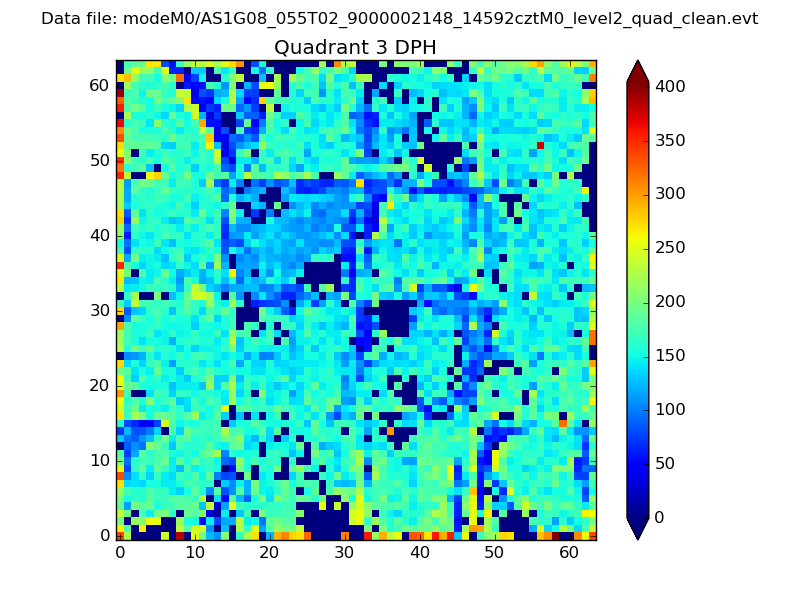 |
 |
Quadrant C |
| Plot type | Count rate plots | Images |
|---|---|---|
| Comparison with Poisson distribution Blue bars denote a histogram of data divided into 1 sec bins. Red curve is a Poisson curve with rate = median count rate of data. |
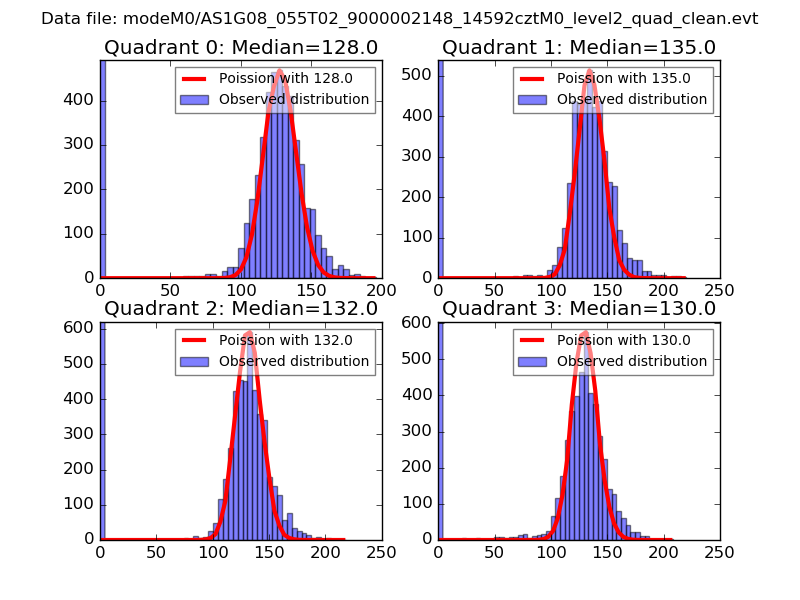 |
 |
| Quadrant-wise count rates Data is divided into 100 sec bins |
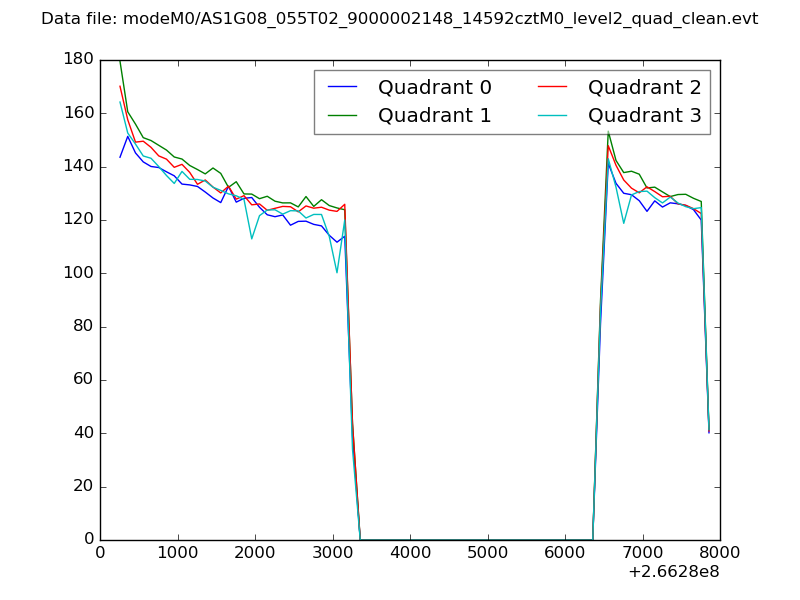 |
|
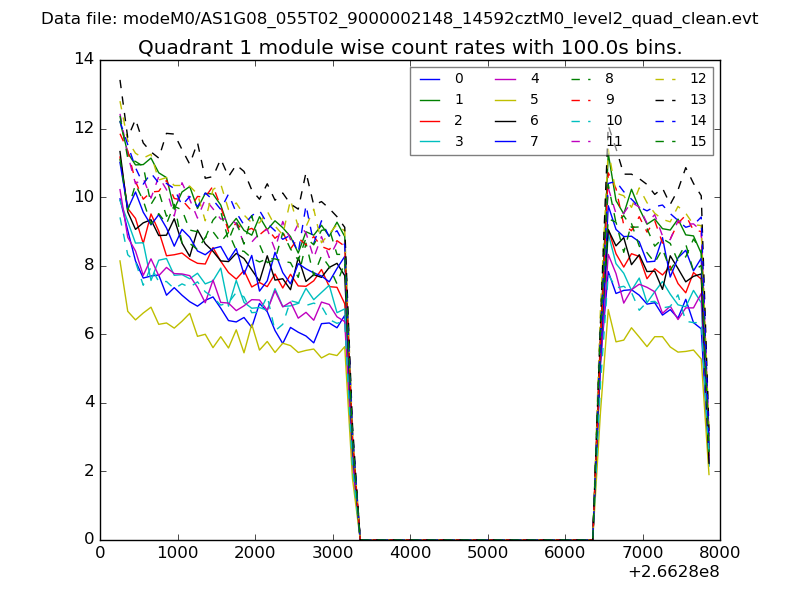
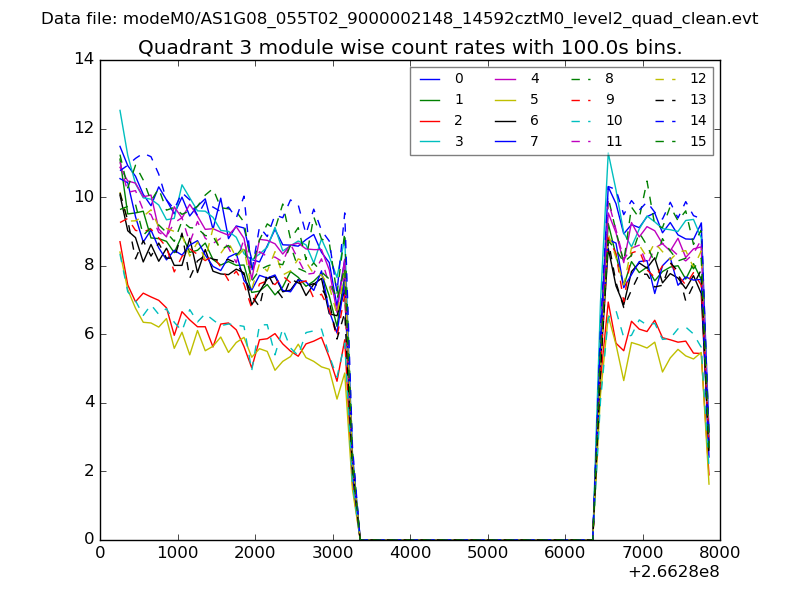
| Module-wise count rates for Quadrant A Data is divided into 100 sec bins |
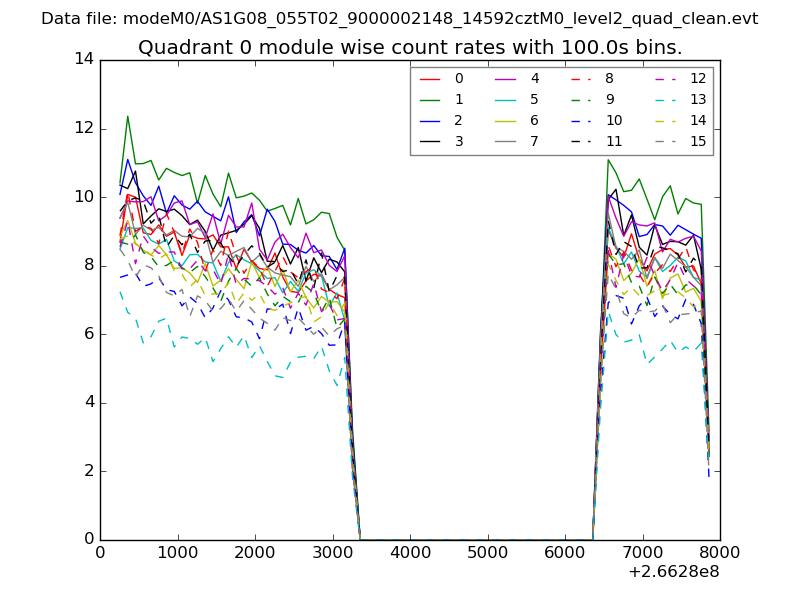 |
 |
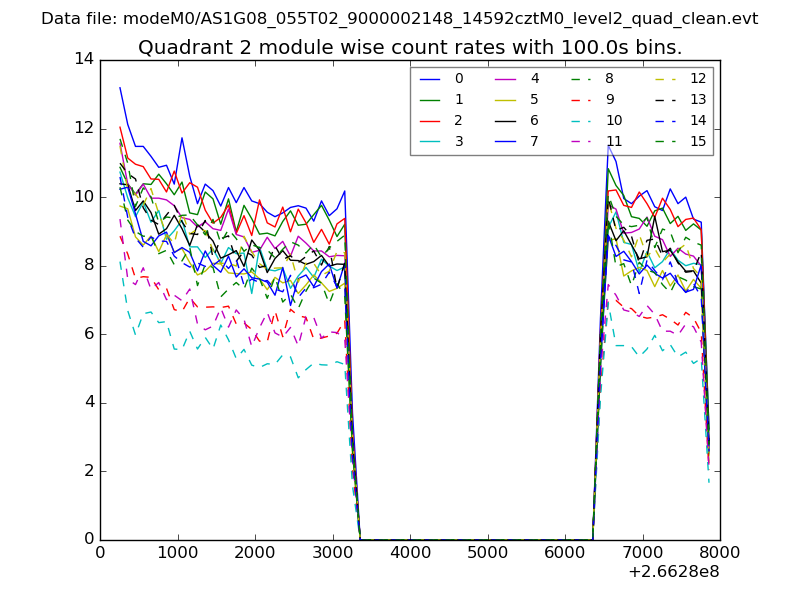
| Module-wise count rates for Quadrant B Data is divided into 100 sec bins |
 |
 |
| Module-wise count rates for Quadrant C Data is divided into 100 sec bins |
 |
 |
| Module-wise count rates for Quadrant D Data is divided into 100 sec bins |
 |
 |
| Parameter | Plot |
|---|---|
| CZT HV Monitor | 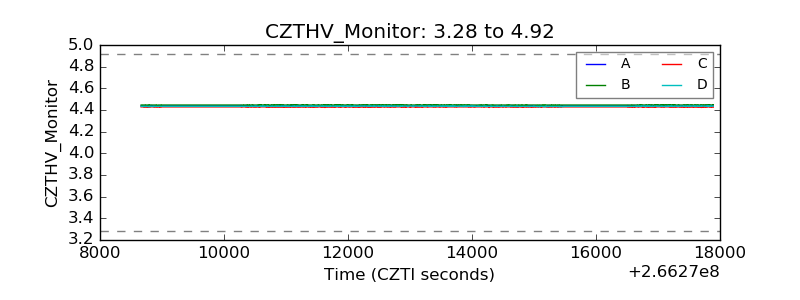 |
| D_VDD | 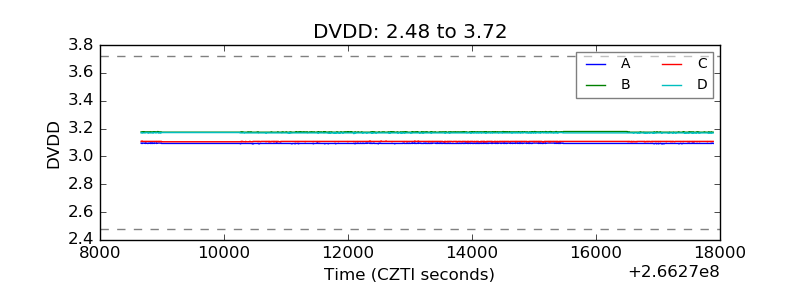 |
| Temperature 1 | 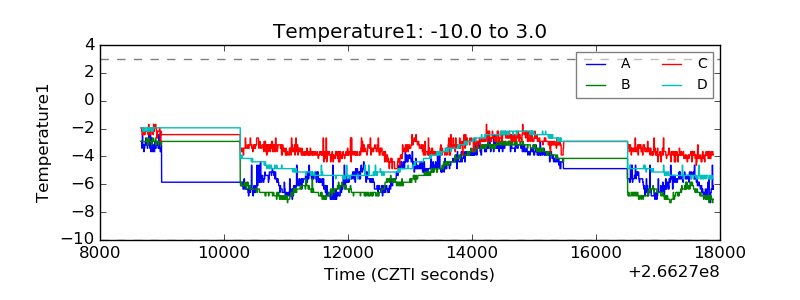 |
| Veto HV Monitor | 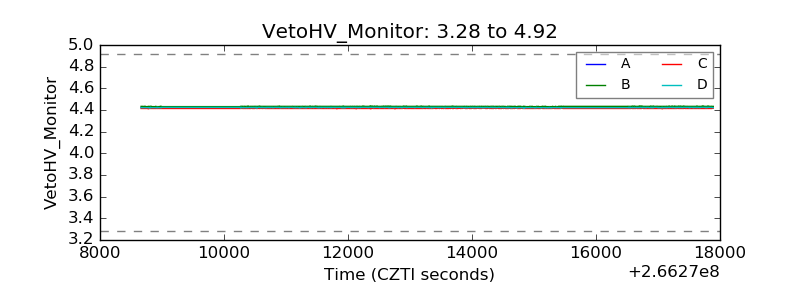 |
| Veto LLD | 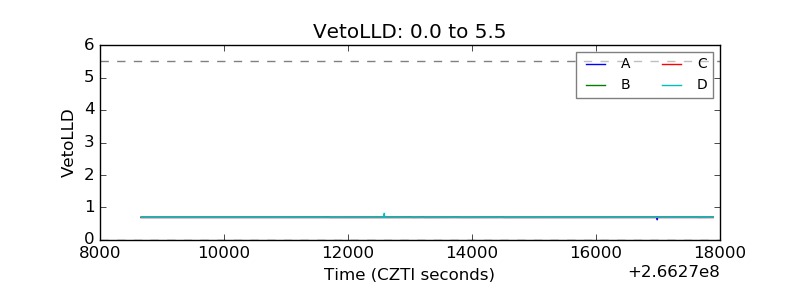 |
| Alpha Counter | 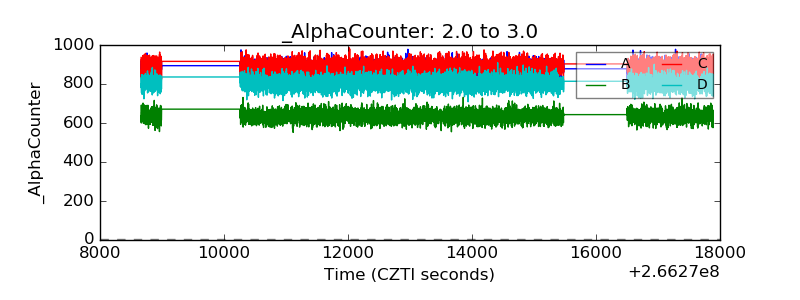 |
| _CPM_Rate | 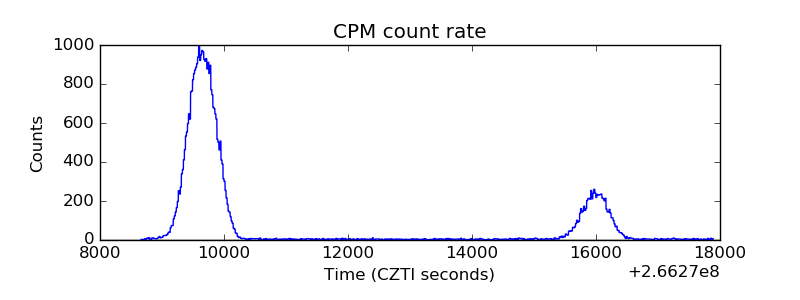 |
| CZT Counter | 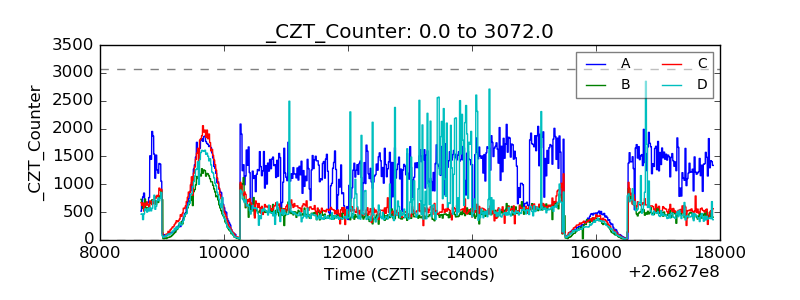 |
| +2.5 Volts monitor |  |
| +5 Volts monitor |  |
| _ROLL_ROT |  |
| _Roll_DEC | 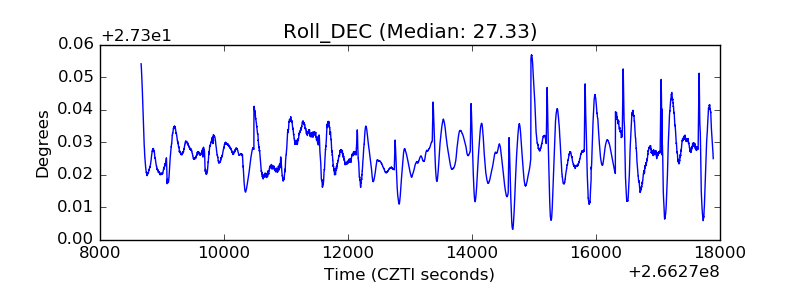 |
| _Roll_RA | 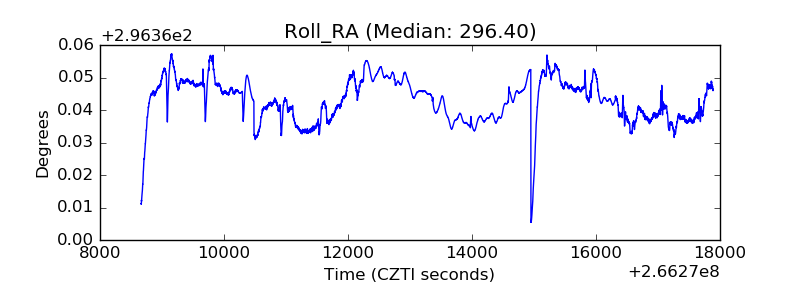 |
| Veto Counter | 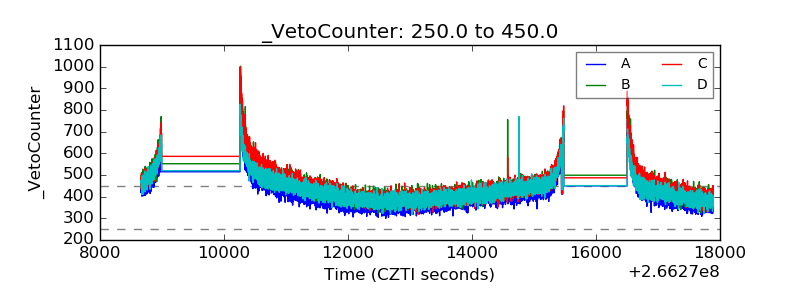 |