| Param | Original file | Final file |
|---|---|---|
| Filename | modeM0/AS1G08_055T02_9000002148_14594cztM0_level2.evt | modeM0/AS1G08_055T02_9000002148_14594cztM0_level2_quad_clean.evt |
| Size (bytes) | 688,055,040 | 103,466,880 |
| Size | 656.2 MB | 98.7 MB |
| Events in quadrant A | 7,677,300 | 645,386 |
| Events in quadrant B | 3,607,944 | 670,699 |
| Events in quadrant C | 4,206,025 | 658,866 |
| Events in quadrant D | 4,841,146 | 637,930 |
| Mode SS | |||
|---|---|---|---|
| Quadrant | BADHDUFLAG | Total packets | Discarded packets |
| A | 0 | 152 | 0 |
| B | 0 | 152 | 0 |
| C | 0 | 152 | 0 |
| D | 0 | 152 | 0 |
| Mode M9 | |||
|---|---|---|---|
| Quadrant | BADHDUFLAG | Total packets | Discarded packets |
| A | 0 | 6 | 0 |
| B | 0 | 6 | 0 |
| C | 0 | 6 | 0 |
| D | 0 | 7 | 0 |
| Mode M0 | |||
|---|---|---|---|
| Quadrant | BADHDUFLAG | Total packets | Discarded packets |
| A | 0 | 28123 | 3 |
| B | 0 | 15702 | 2 |
| C | 0 | 17260 | 2 |
| D | 0 | 19553 | 2 |
| Quadrant | Total seconds | Saturated seconds | Saturation percentage |
|---|---|---|---|
| A | 7477 | 271 | 3.624448% |
| B | 7477 | 108 | 1.444430% |
| C | 7477 | 56 | 0.748963% |
| D | 7477 | 555 | 7.422763% |
Noise dominated data is calculated using 1-second bins in cleaned event files. If a bin has >2000 counts, and if more than 50% of those come from <1% of pixels, then it is considered to be noise-dominated and hence unusable.
| Quadrant | # 1 sec bins | Bins with >0 counts | Bins with >2000 counts | High rate bins dominated by noise | Noise dominated (total time) | Noise dominated (detector-on time) | Marked lightcurve |
|---|---|---|---|---|---|---|---|
| A | 7758 | 7479 | 4 | 4 | 0.05% | 0.05% | 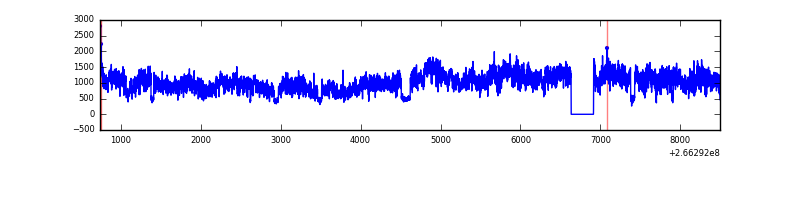 |
| B | 7758 | 7479 | 5 | 5 | 0.06% | 0.07% | 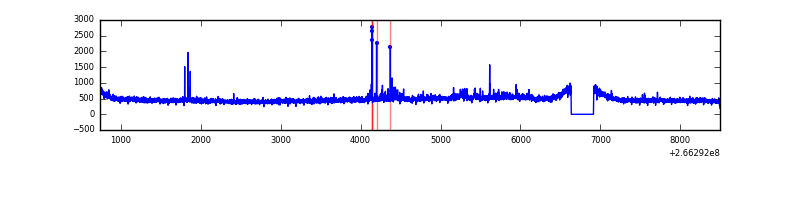 |
| C | 7758 | 7479 | 0 | 0 | 0.00% | 0.00% | 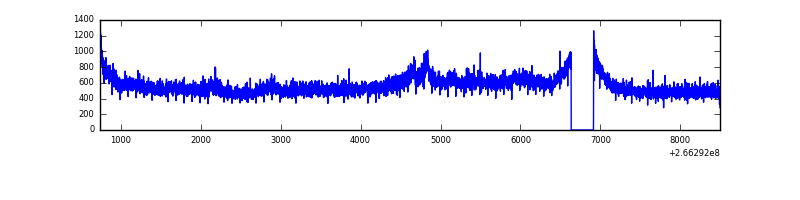 |
| D | 7758 | 7479 | 386 | 386 | 4.98% | 5.16% | 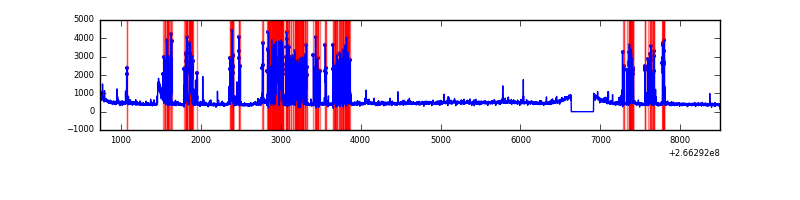 |
Top three noisy pixels from each quadrant. If the there are fewer than three noisy pixels in the level2.evt file, extra rows are filled as -1
| Pixel properties | Quadrant properties | ||||||
|---|---|---|---|---|---|---|---|
| Quadrant | DetID | PixID | Counts | Sigma | Mean | Median | Sigma |
| A | 0 | 23 | 3876750 | 21703.33 | 885 | 866 | 178.6 |
| A | 0 | 226 | 233681 | 1303.67 | 885 | 866 | 178.6 |
| A | 1 | 162 | 76841 | 425.43 | 885 | 866 | 178.6 |
| B | 0 | 189 | 46137 | 263.05 | 893 | 870 | 172.1 |
| B | 0 | 214 | 21404 | 119.32 | 893 | 870 | 172.1 |
| B | 12 | 111 | 20886 | 116.31 | 893 | 870 | 172.1 |
| C | 3 | 233 | 793597 | 3912.32 | 872 | 877 | 202.6 |
| C | 13 | 61 | 6246 | 26.5 | 872 | 877 | 202.6 |
| C | 8 | 128 | 5273 | 21.7 | 872 | 877 | 202.6 |
| D | 10 | 199 | 1550155 | 7723.62 | 840 | 820 | 200.6 |
| D | 12 | 110 | 57643 | 283.27 | 840 | 820 | 200.6 |
| D | 2 | 234 | 24787 | 119.48 | 840 | 820 | 200.6 |
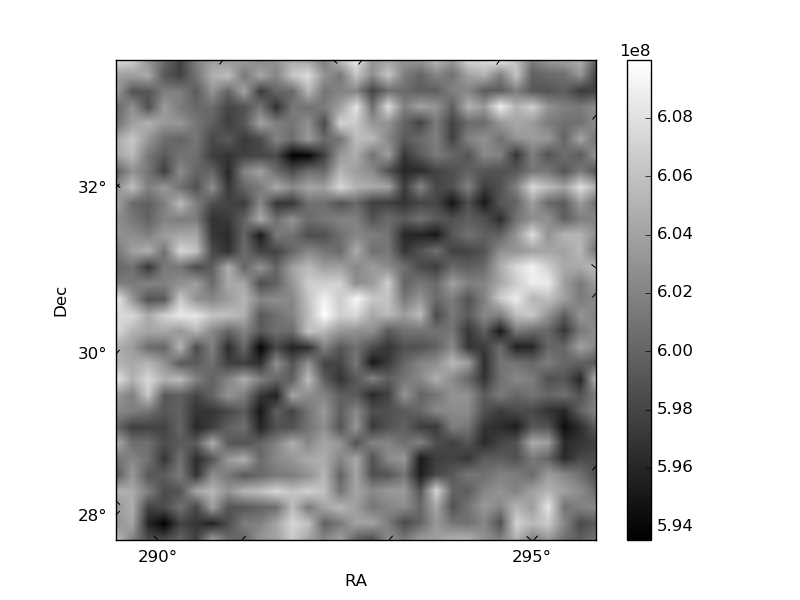
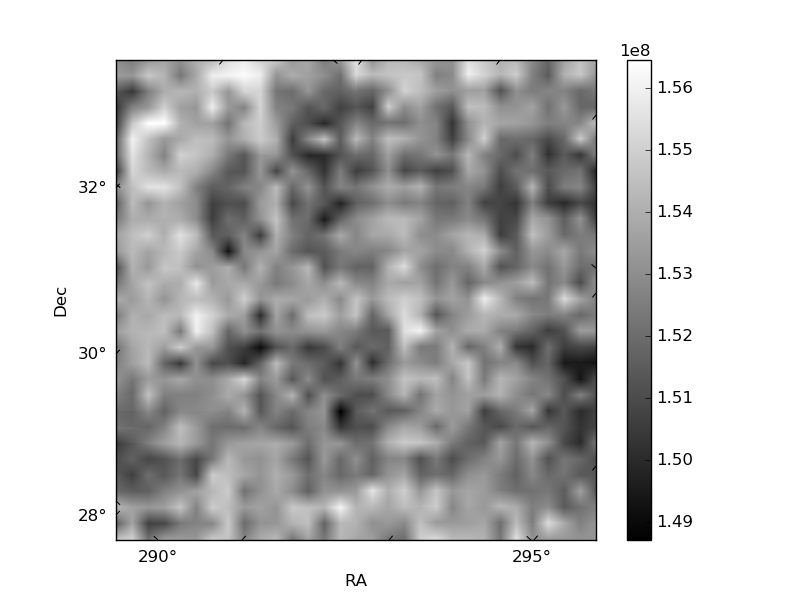
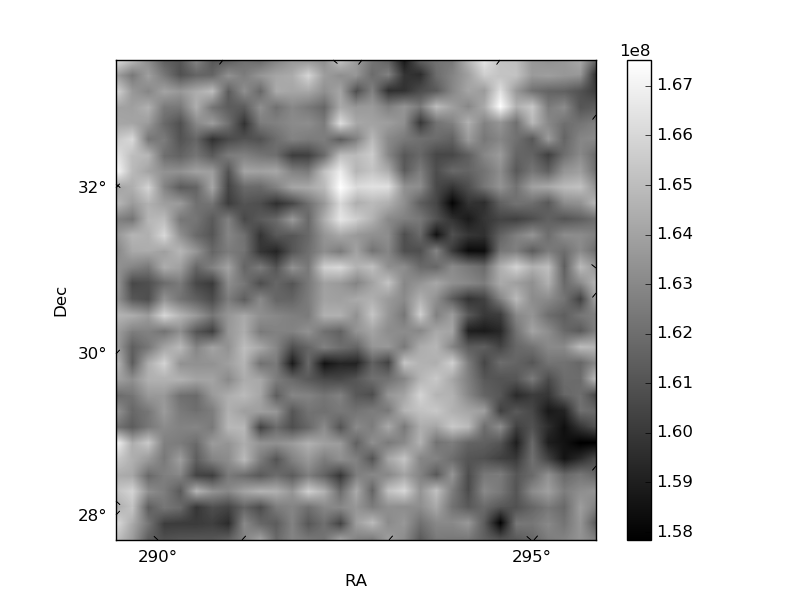
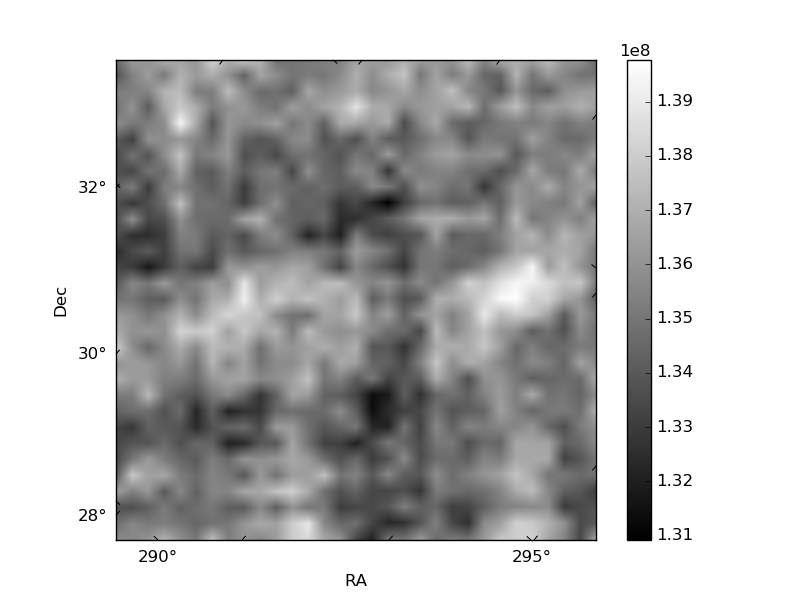
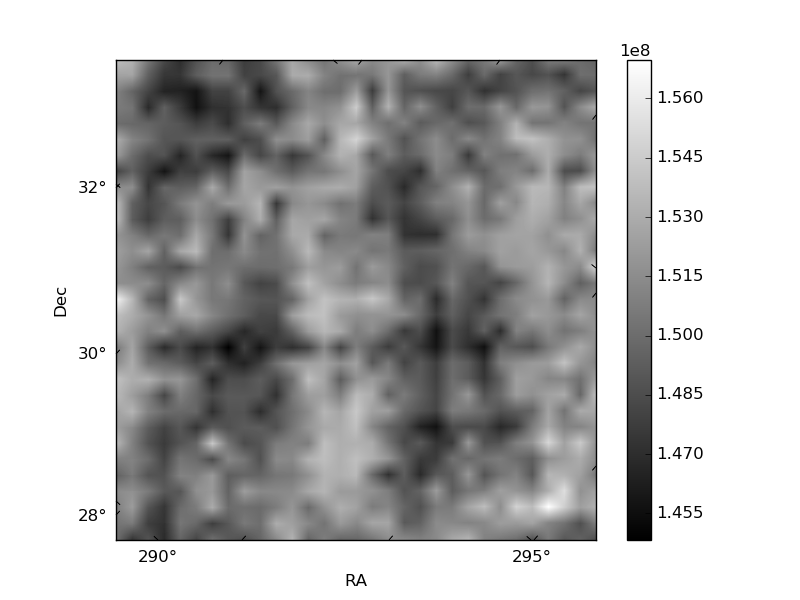
Histogram calculated using DETX and DETY for each event in the final _common_clean file
| Quadrant A | 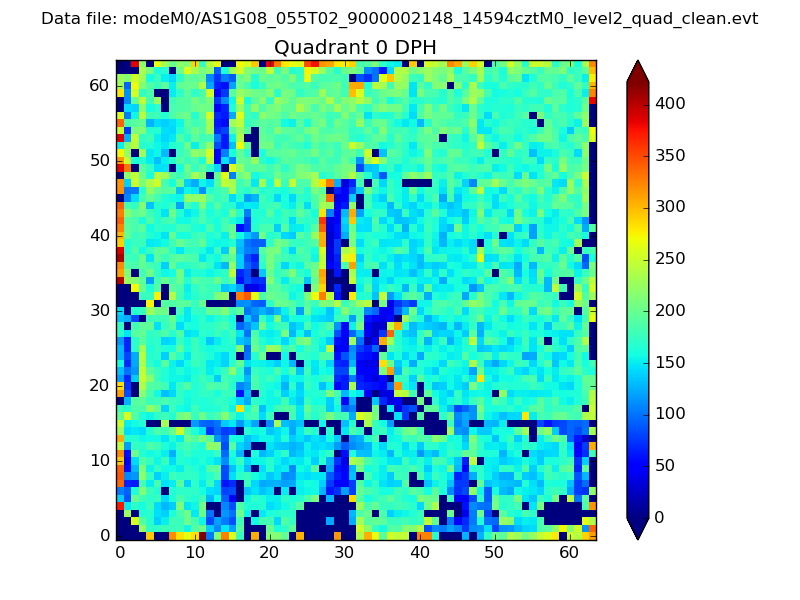 |
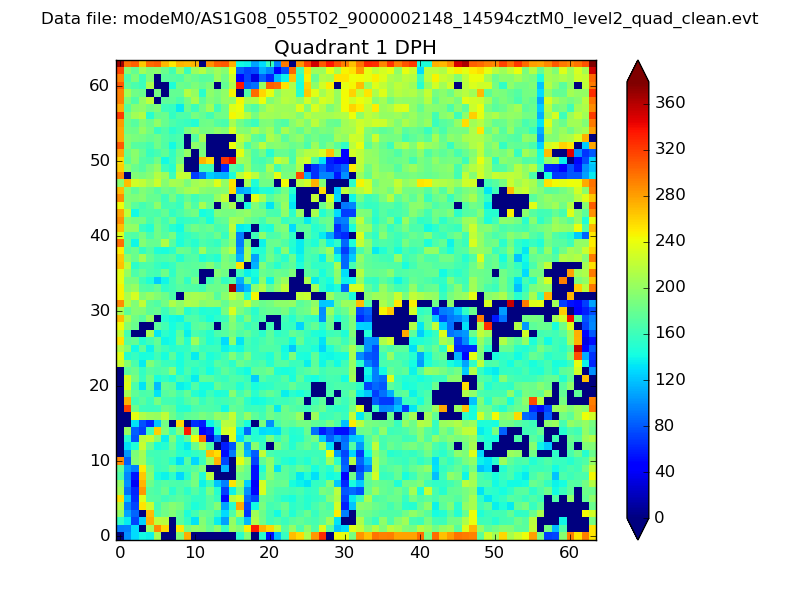 |
Quadrant B |
|---|---|---|---|
| Quadrant D | 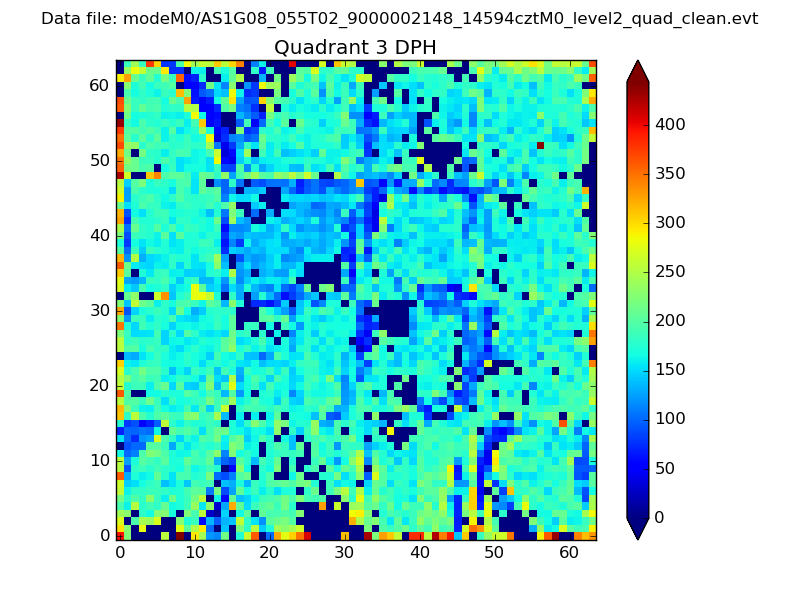 |
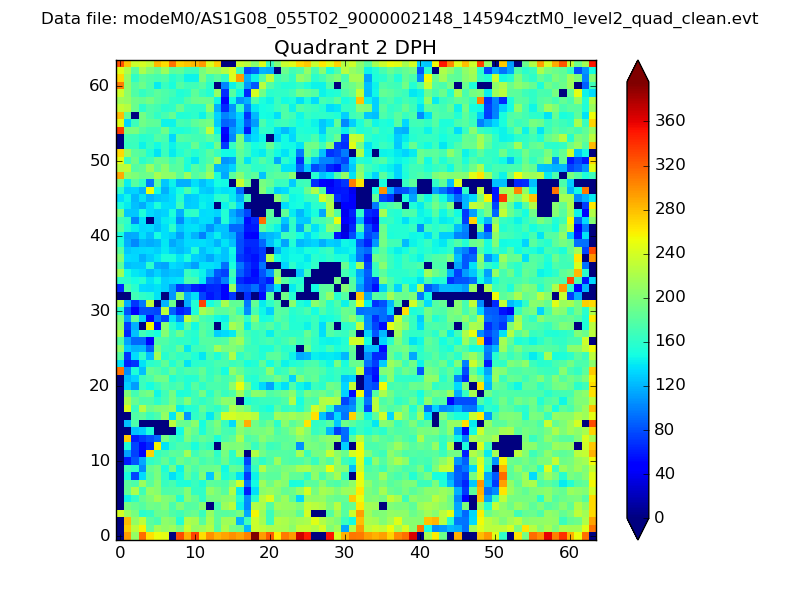 |
Quadrant C |
| Plot type | Count rate plots | Images |
|---|---|---|
| Comparison with Poisson distribution Blue bars denote a histogram of data divided into 1 sec bins. Red curve is a Poisson curve with rate = median count rate of data. |
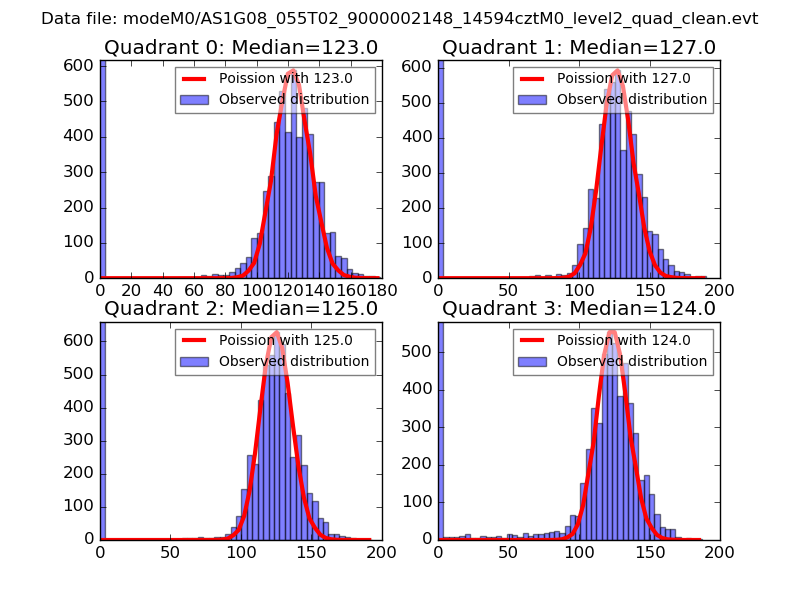 |
 |
| Quadrant-wise count rates Data is divided into 100 sec bins |
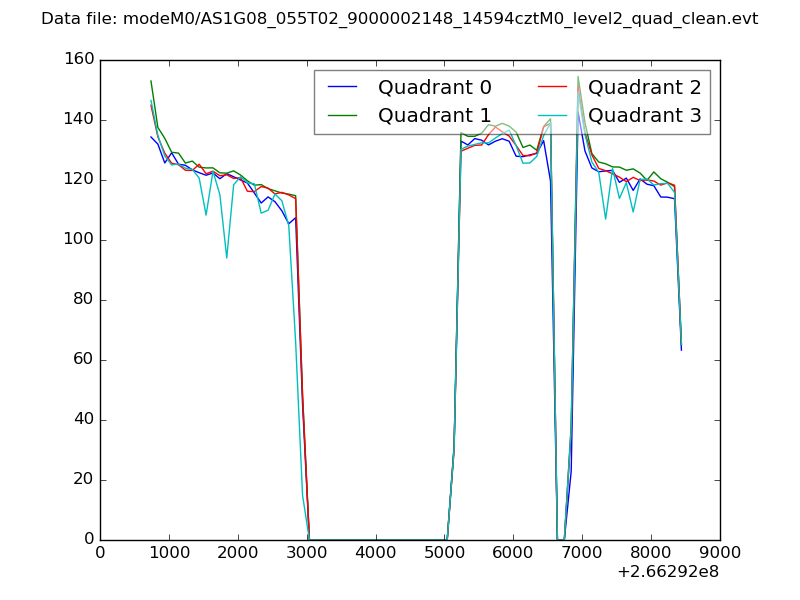 |
|
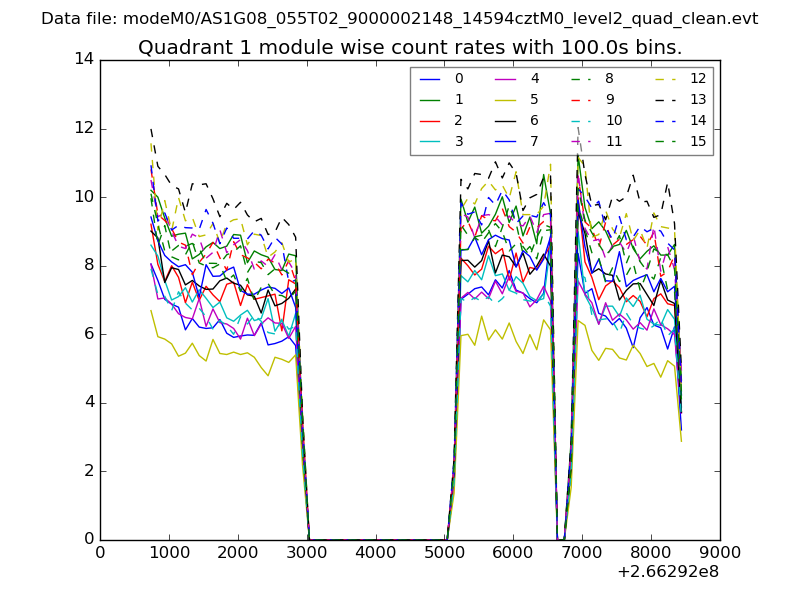
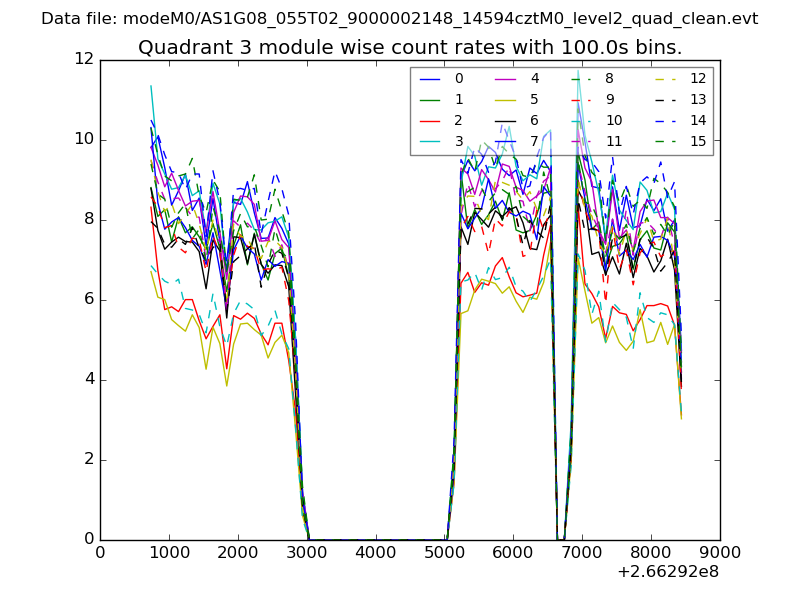
| Module-wise count rates for Quadrant A Data is divided into 100 sec bins |
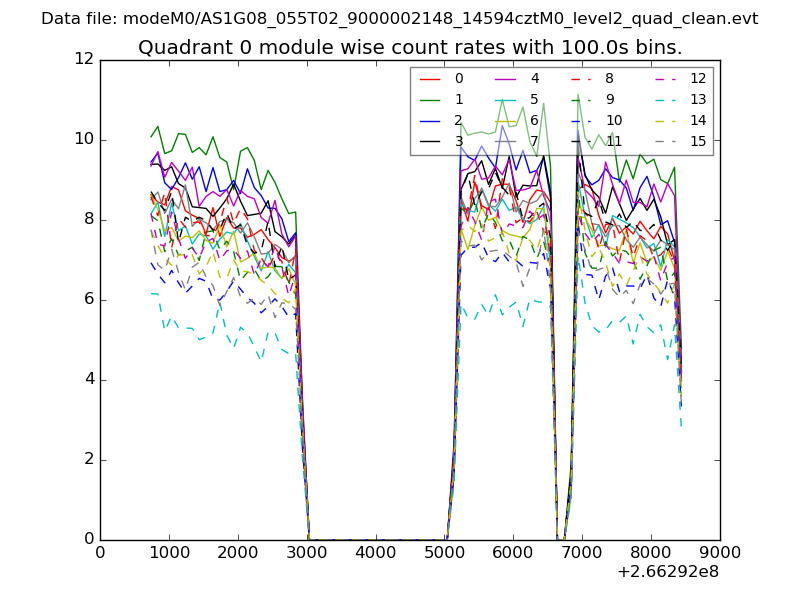 |
 |
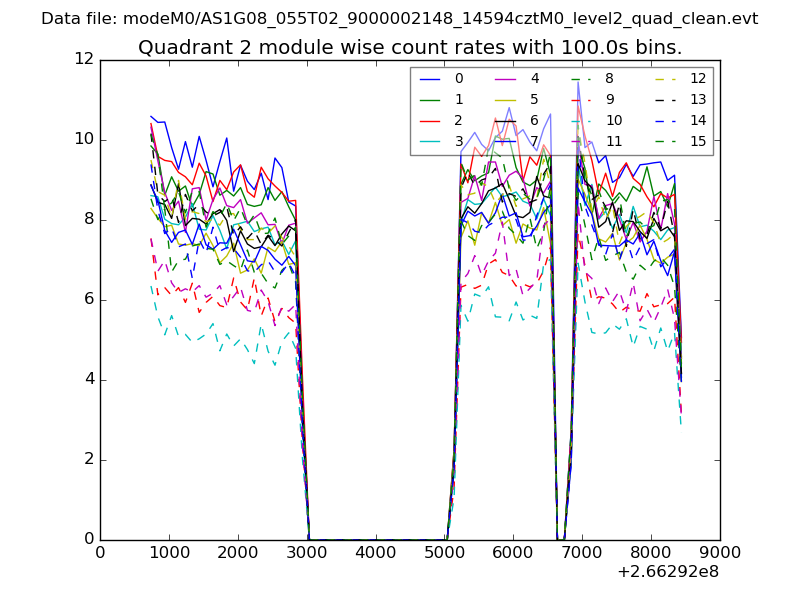
| Module-wise count rates for Quadrant B Data is divided into 100 sec bins |
 |
 |
| Module-wise count rates for Quadrant C Data is divided into 100 sec bins |
 |
 |
| Module-wise count rates for Quadrant D Data is divided into 100 sec bins |
 |
 |
| Parameter | Plot |
|---|---|
| CZT HV Monitor | 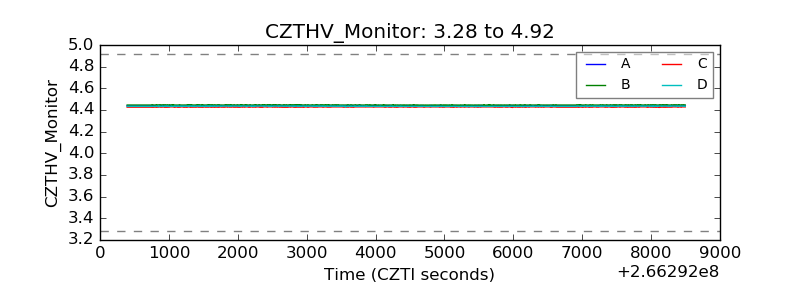 |
| D_VDD |  |
| Temperature 1 | 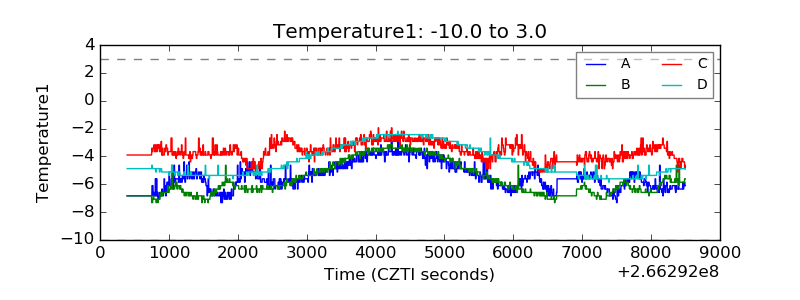 |
| Veto HV Monitor | 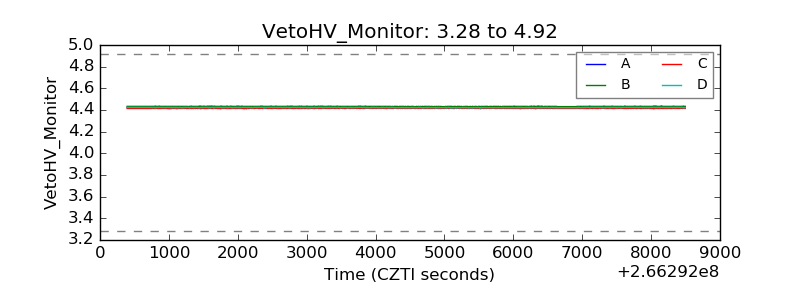 |
| Veto LLD | 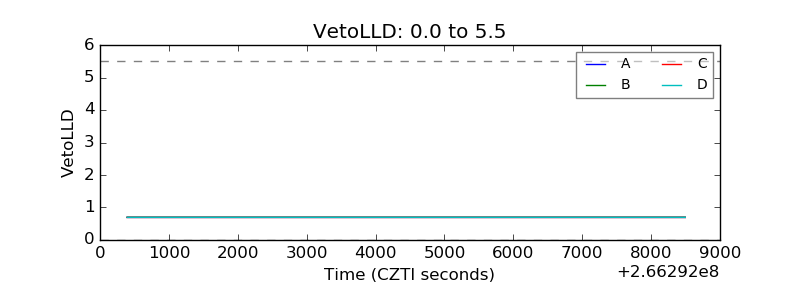 |
| Alpha Counter | 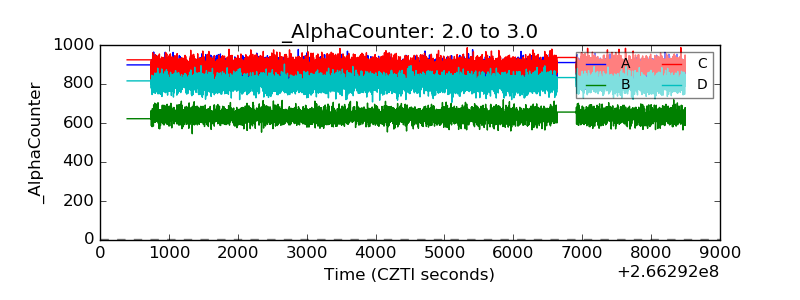 |
| _CPM_Rate | 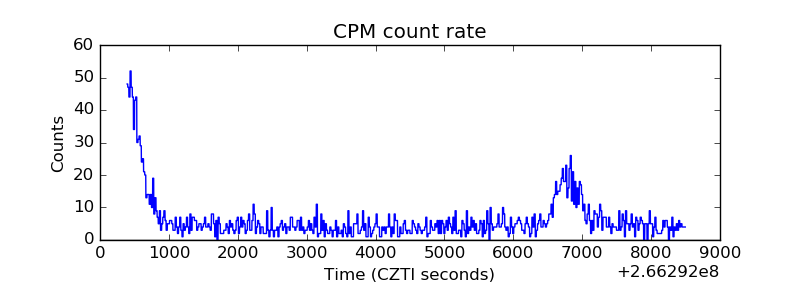 |
| CZT Counter | 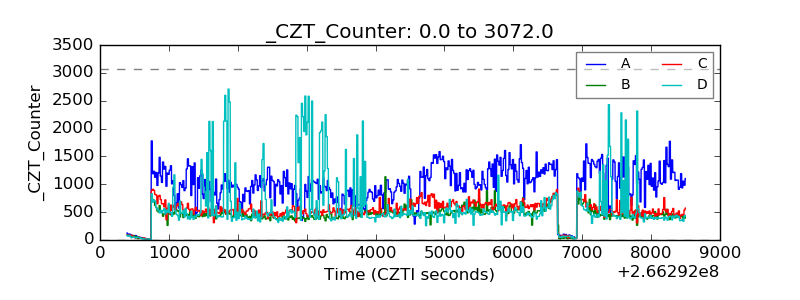 |
| +2.5 Volts monitor | 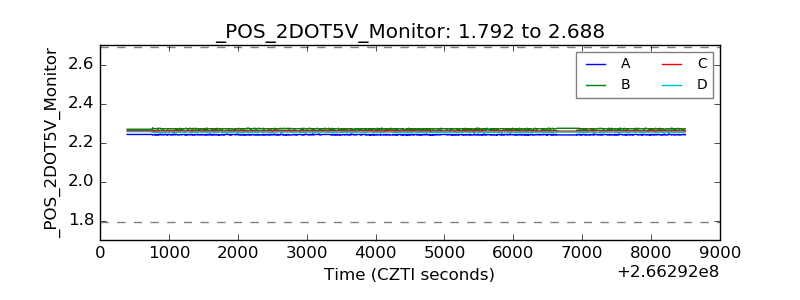 |
| +5 Volts monitor |  |
| _ROLL_ROT | 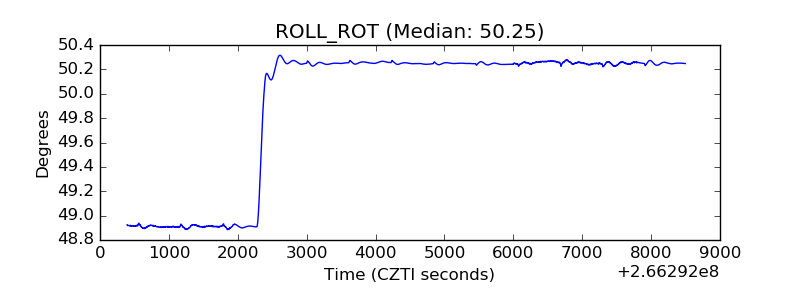 |
| _Roll_DEC | 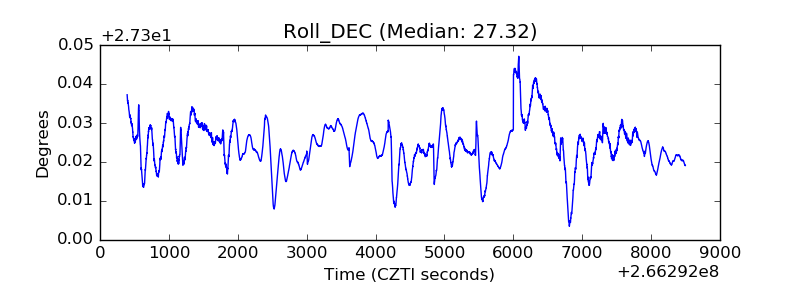 |
| _Roll_RA | 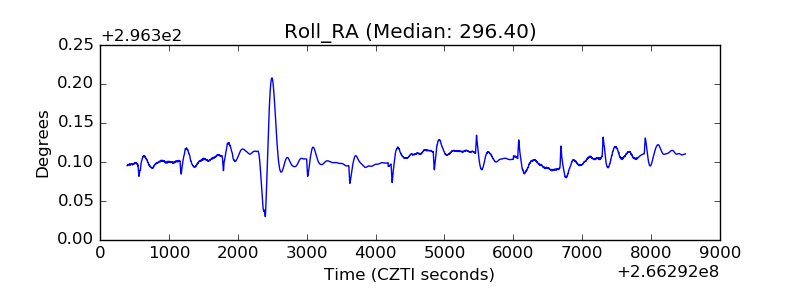 |
| Veto Counter | 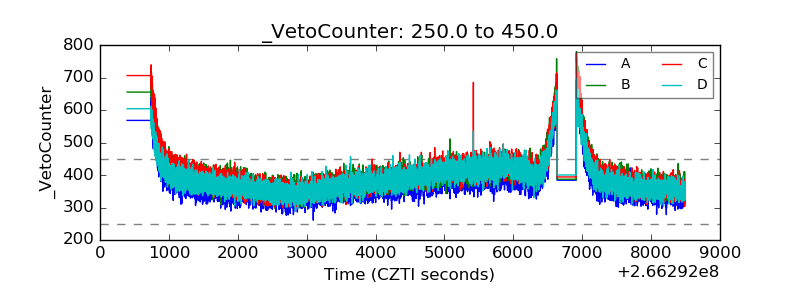 |