| Param | Original file | Final file |
|---|---|---|
| Filename | modeM0/AS1G08_055T02_9000002148_14595cztM0_level2.evt | modeM0/AS1G08_055T02_9000002148_14595cztM0_level2_quad_clean.evt |
| Size (bytes) | 743,253,120 | 107,314,560 |
| Size | 708.8 MB | 102.3 MB |
| Events in quadrant A | 9,682,209 | 655,435 |
| Events in quadrant B | 3,769,065 | 695,638 |
| Events in quadrant C | 4,151,916 | 686,499 |
| Events in quadrant D | 4,380,085 | 669,918 |
| Mode SS | |||
|---|---|---|---|
| Quadrant | BADHDUFLAG | Total packets | Discarded packets |
| A | 0 | 160 | 0 |
| B | 0 | 160 | 0 |
| C | 0 | 160 | 0 |
| D | 0 | 160 | 0 |
| Mode M9 | |||
|---|---|---|---|
| Quadrant | BADHDUFLAG | Total packets | Discarded packets |
| A | 0 | 5 | 0 |
| B | 0 | 5 | 0 |
| C | 0 | 5 | 0 |
| D | 0 | 5 | 0 |
| Mode M0 | |||
|---|---|---|---|
| Quadrant | BADHDUFLAG | Total packets | Discarded packets |
| A | 0 | 34224 | 4 |
| B | 0 | 16329 | 3 |
| C | 0 | 17004 | 3 |
| D | 0 | 18544 | 3 |
| Quadrant | Total seconds | Saturated seconds | Saturation percentage |
|---|---|---|---|
| A | 7795 | 579 | 7.427838% |
| B | 7795 | 205 | 2.629891% |
| C | 7795 | 125 | 1.603592% |
| D | 7795 | 318 | 4.079538% |
Noise dominated data is calculated using 1-second bins in cleaned event files. If a bin has >2000 counts, and if more than 50% of those come from <1% of pixels, then it is considered to be noise-dominated and hence unusable.
| Quadrant | # 1 sec bins | Bins with >0 counts | Bins with >2000 counts | High rate bins dominated by noise | Noise dominated (total time) | Noise dominated (detector-on time) | Marked lightcurve |
|---|---|---|---|---|---|---|---|
| A | 8341 | 7799 | 8 | 8 | 0.10% | 0.10% | 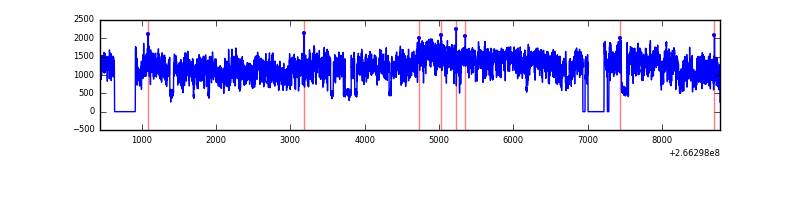 |
| B | 8341 | 7800 | 1 | 1 | 0.01% | 0.01% | 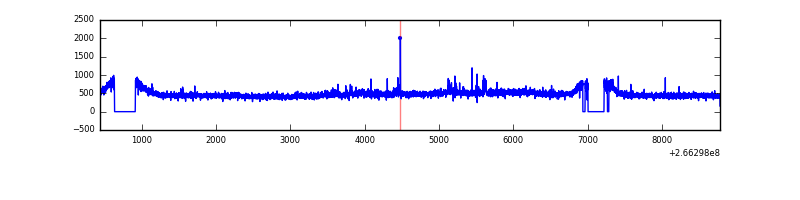 |
| C | 8341 | 7800 | 1 | 1 | 0.01% | 0.01% | 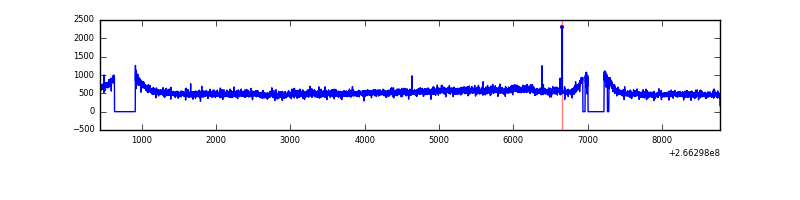 |
| D | 8341 | 7799 | 162 | 162 | 1.94% | 2.08% | 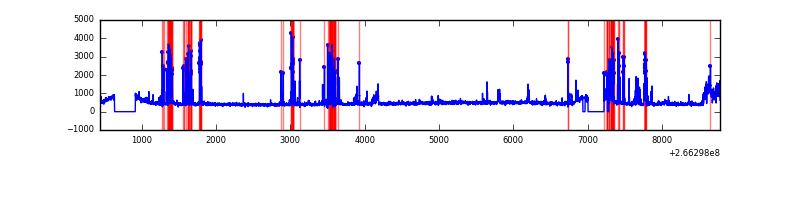 |
Top three noisy pixels from each quadrant. If the there are fewer than three noisy pixels in the level2.evt file, extra rows are filled as -1
| Pixel properties | Quadrant properties | ||||||
|---|---|---|---|---|---|---|---|
| Quadrant | DetID | PixID | Counts | Sigma | Mean | Median | Sigma |
| A | 0 | 23 | 5628846 | 29839.7 | 922 | 900 | 188.6 |
| A | 0 | 226 | 339918 | 1797.49 | 922 | 900 | 188.6 |
| A | 1 | 162 | 88373 | 463.79 | 922 | 900 | 188.6 |
| B | 0 | 214 | 27576 | 146.25 | 940 | 917 | 182.3 |
| B | 0 | 230 | 25037 | 132.32 | 940 | 917 | 182.3 |
| B | 12 | 111 | 22647 | 119.21 | 940 | 917 | 182.3 |
| C | 3 | 233 | 535613 | 2495.2 | 918 | 921 | 214.3 |
| C | 8 | 128 | 19795 | 88.08 | 918 | 921 | 214.3 |
| C | 8 | 112 | 8415 | 34.97 | 918 | 921 | 214.3 |
| D | 10 | 199 | 667704 | 3095.94 | 903 | 880 | 215.4 |
| D | 12 | 110 | 211741 | 978.99 | 903 | 880 | 215.4 |
| D | 2 | 234 | 29622 | 133.44 | 903 | 880 | 215.4 |
Histogram calculated using DETX and DETY for each event in the final _common_clean file
| Quadrant A |  |
 |
Quadrant B |
|---|---|---|---|
| Quadrant D |  |
 |
Quadrant C |
| Plot type | Count rate plots | Images |
|---|---|---|
| Comparison with Poisson distribution Blue bars denote a histogram of data divided into 1 sec bins. Red curve is a Poisson curve with rate = median count rate of data. |
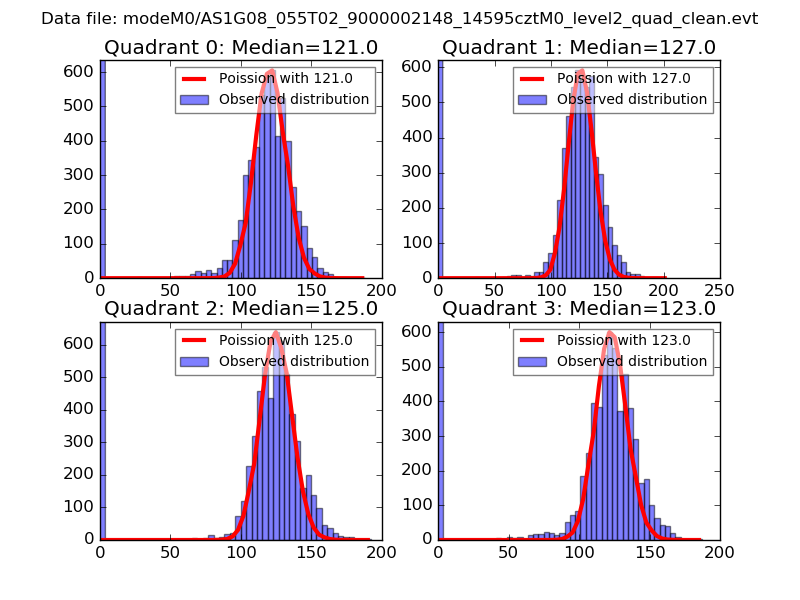 |
 |
| Quadrant-wise count rates Data is divided into 100 sec bins |
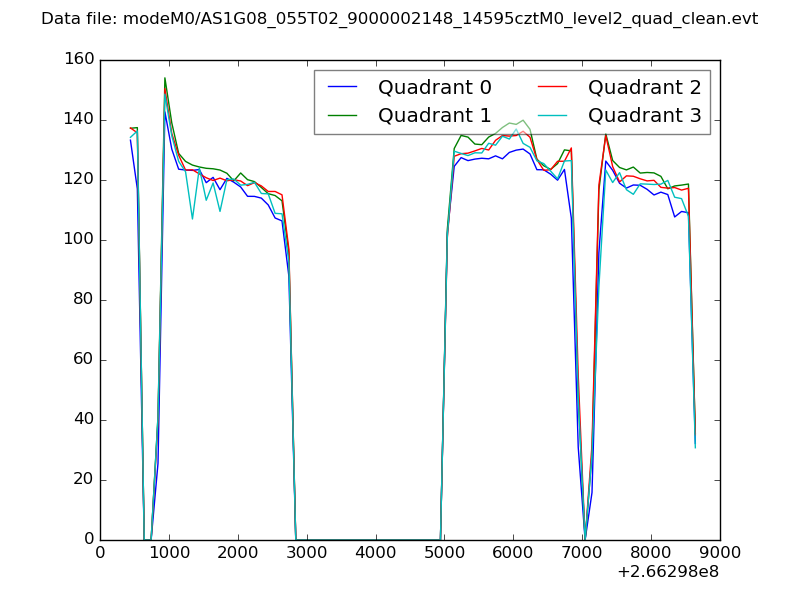 |
|
| Module-wise count rates for Quadrant A Data is divided into 100 sec bins |
 |
 |
| Module-wise count rates for Quadrant B Data is divided into 100 sec bins |
 |
 |
| Module-wise count rates for Quadrant C Data is divided into 100 sec bins |
 |
 |
| Module-wise count rates for Quadrant D Data is divided into 100 sec bins |
 |
 |
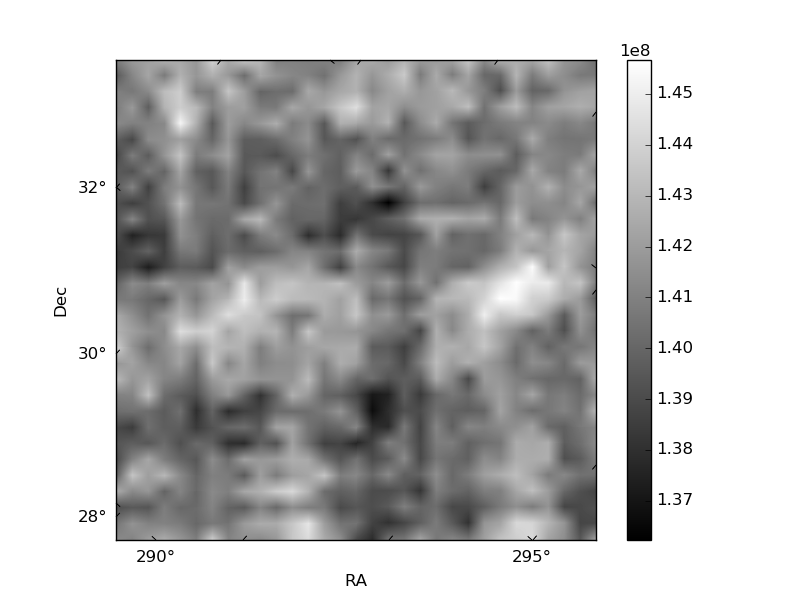
| Parameter | Plot |
|---|---|
| CZT HV Monitor |  |
| D_VDD | 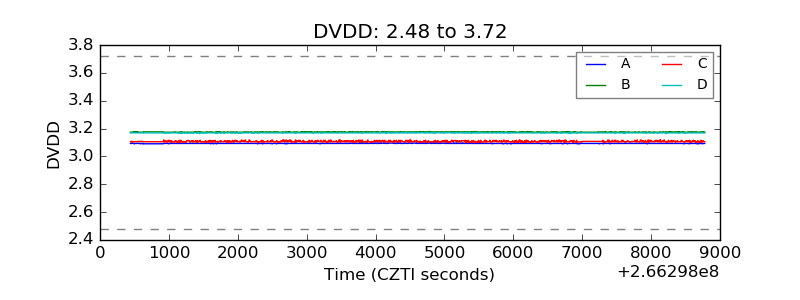 |
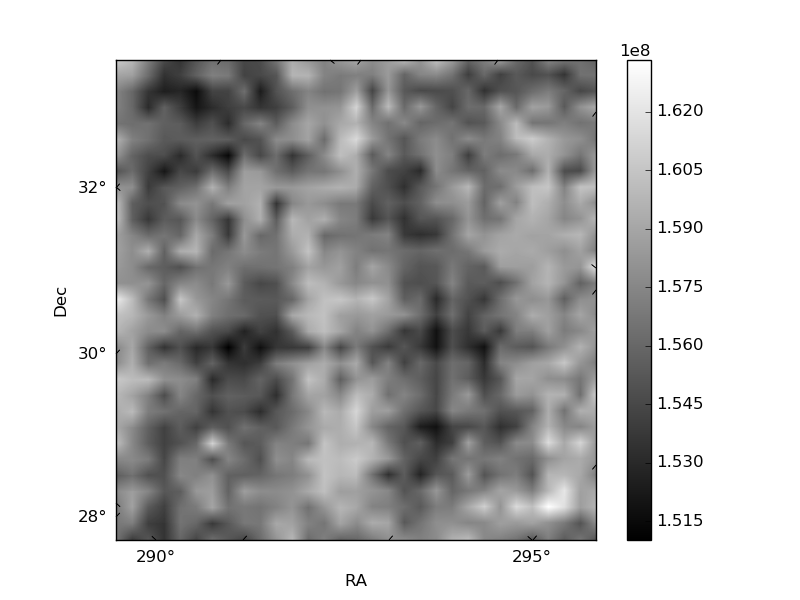
| Temperature 1 |  |
| Veto HV Monitor |  |
| Veto LLD |  |
| Alpha Counter | 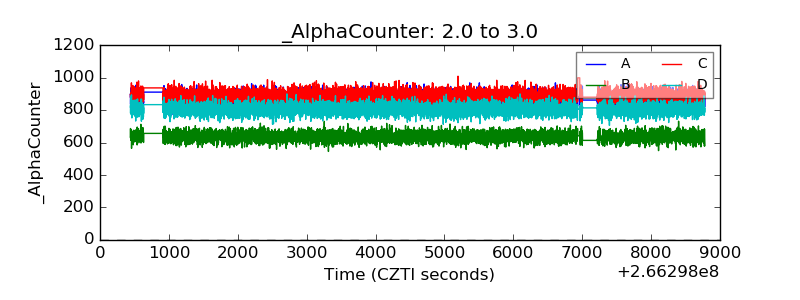 |
| _CPM_Rate | 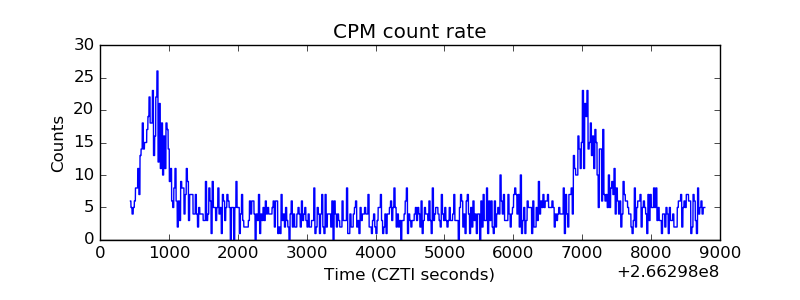 |
| CZT Counter |  |
| +2.5 Volts monitor |  |
| +5 Volts monitor |  |
| _ROLL_ROT |  |
| _Roll_DEC |  |
| _Roll_RA |  |
| Veto Counter |  |