| Param | Original file | Final file |
|---|---|---|
| Filename | modeM0/AS1G08_055T02_9000002148_14598cztM0_level2.evt | modeM0/AS1G08_055T02_9000002148_14598cztM0_level2_quad_clean.evt |
| Size (bytes) | 1,671,975,360 | 203,578,560 |
| Size | 1.6 GB | 194.1 MB |
| Events in quadrant A | 19,344,111 | 1,223,345 |
| Events in quadrant B | 8,687,556 | 1,270,003 |
| Events in quadrant C | 9,459,258 | 1,244,676 |
| Events in quadrant D | 11,934,281 | 1,186,361 |
| Mode SS | |||
|---|---|---|---|
| Quadrant | BADHDUFLAG | Total packets | Discarded packets |
| A | 0 | 368 | 0 |
| B | 0 | 368 | 0 |
| C | 0 | 368 | 0 |
| D | 0 | 368 | 0 |
| Mode M9 | |||
|---|---|---|---|
| Quadrant | BADHDUFLAG | Total packets | Discarded packets |
| A | 0 | 16 | 0 |
| B | 0 | 16 | 0 |
| C | 0 | 16 | 0 |
| D | 0 | 16 | 0 |
| Mode M0 | |||
|---|---|---|---|
| Quadrant | BADHDUFLAG | Total packets | Discarded packets |
| A | 0 | 70233 | 4 |
| B | 0 | 37048 | 3 |
| C | 0 | 38307 | 3 |
| D | 0 | 47676 | 3 |
| Quadrant | Total seconds | Saturated seconds | Saturation percentage |
|---|---|---|---|
| A | 17992 | 884 | 4.913295% |
| B | 17992 | 280 | 1.556247% |
| C | 17992 | 199 | 1.106047% |
| D | 17992 | 1267 | 7.042019% |
Noise dominated data is calculated using 1-second bins in cleaned event files. If a bin has >2000 counts, and if more than 50% of those come from <1% of pixels, then it is considered to be noise-dominated and hence unusable.
| Quadrant | # 1 sec bins | Bins with >0 counts | Bins with >2000 counts | High rate bins dominated by noise | Noise dominated (total time) | Noise dominated (detector-on time) | Marked lightcurve |
|---|---|---|---|---|---|---|---|
| A | 19718 | 17993 | 253 | 253 | 1.28% | 1.41% | 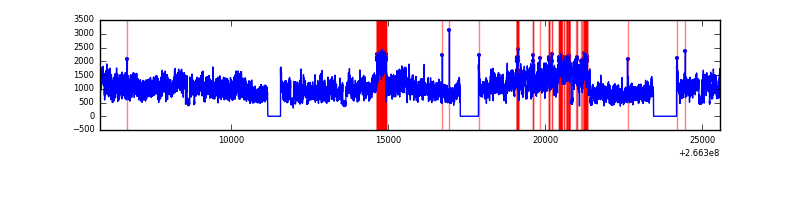 |
| B | 19718 | 17993 | 4 | 4 | 0.02% | 0.02% | 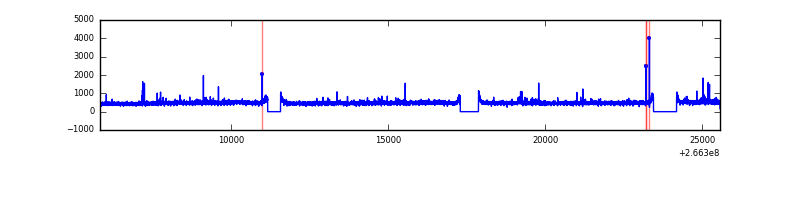 |
| C | 19718 | 17995 | 0 | 0 | 0.00% | 0.00% | 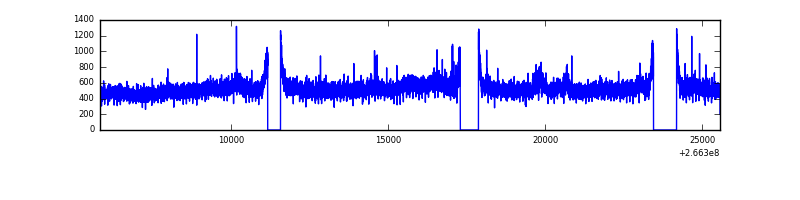 |
| D | 19718 | 17993 | 831 | 831 | 4.21% | 4.62% | 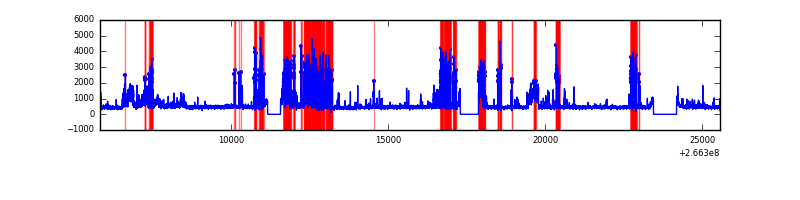 |
Top three noisy pixels from each quadrant. If the there are fewer than three noisy pixels in the level2.evt file, extra rows are filled as -1
| Pixel properties | Quadrant properties | ||||||
|---|---|---|---|---|---|---|---|
| Quadrant | DetID | PixID | Counts | Sigma | Mean | Median | Sigma |
| A | 0 | 23 | 9747335 | 22430.98 | 2137 | 2087 | 434.5 |
| A | 0 | 226 | 598881 | 1373.66 | 2137 | 2087 | 434.5 |
| A | 12 | 189 | 275659 | 629.69 | 2137 | 2087 | 434.5 |
| B | 0 | 189 | 82722 | 192.74 | 2158 | 2100 | 418.3 |
| B | 12 | 111 | 50825 | 116.48 | 2158 | 2100 | 418.3 |
| B | 11 | 111 | 43348 | 98.61 | 2158 | 2100 | 418.3 |
| C | 3 | 233 | 1261625 | 2579.39 | 2098 | 2108 | 488.3 |
| C | 13 | 61 | 14831 | 26.05 | 2098 | 2108 | 488.3 |
| C | 10 | 22 | 8760 | 13.62 | 2098 | 2108 | 488.3 |
| D | 10 | 199 | 2422459 | 5034.36 | 2033 | 1984 | 480.8 |
| D | 12 | 110 | 1245807 | 2587.03 | 2033 | 1984 | 480.8 |
| D | 2 | 14 | 211499 | 435.77 | 2033 | 1984 | 480.8 |
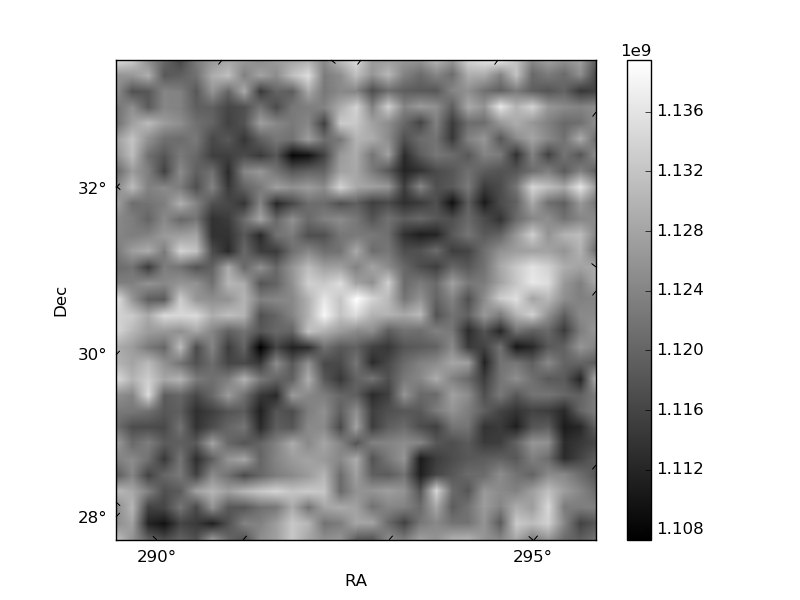
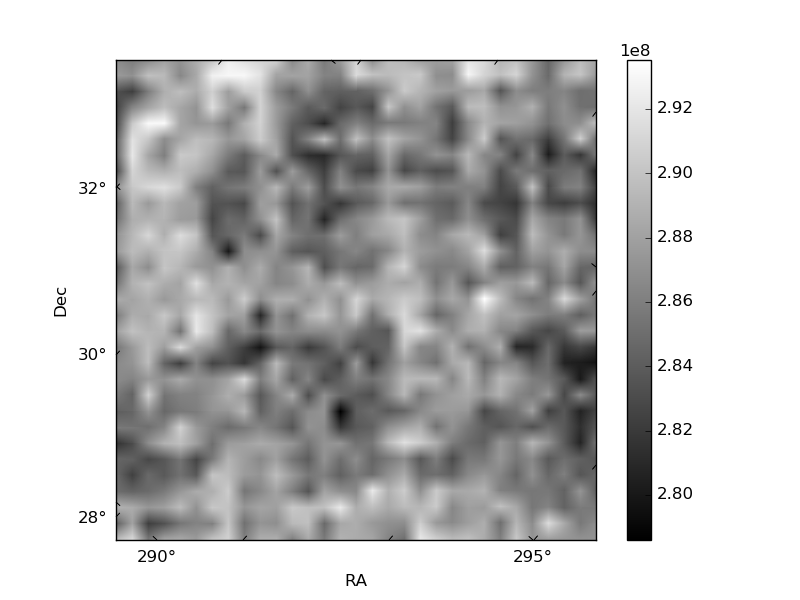
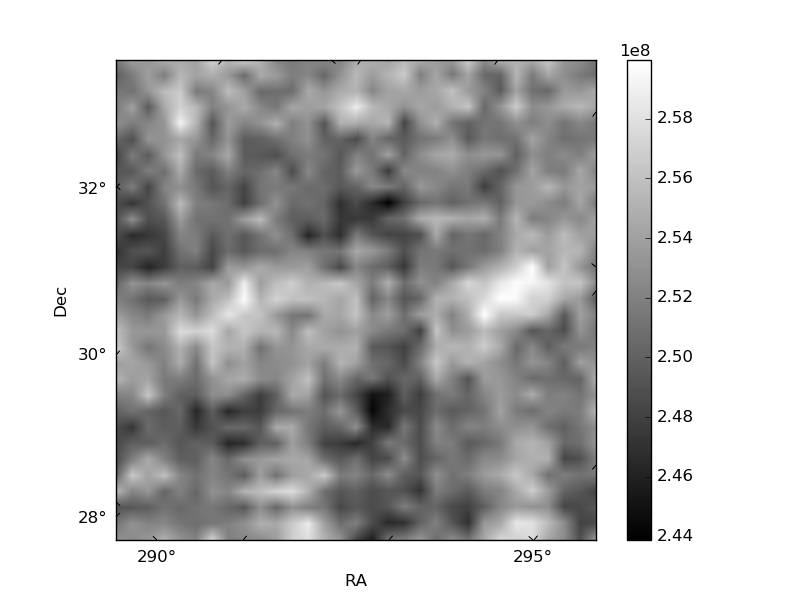
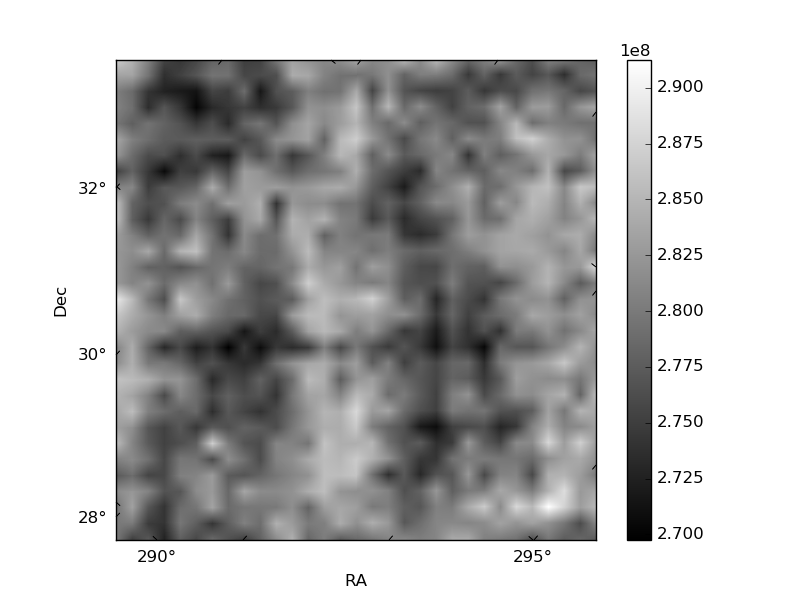
Histogram calculated using DETX and DETY for each event in the final _common_clean file
| Quadrant A | 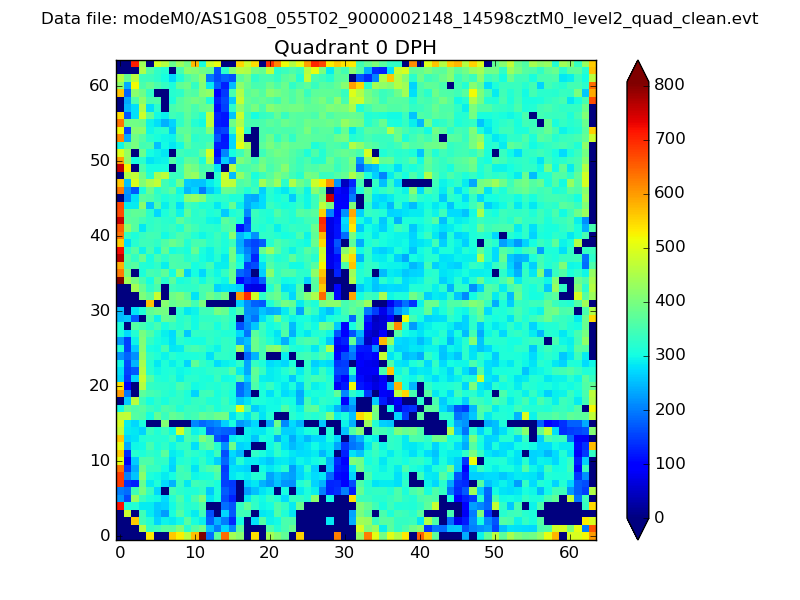 |
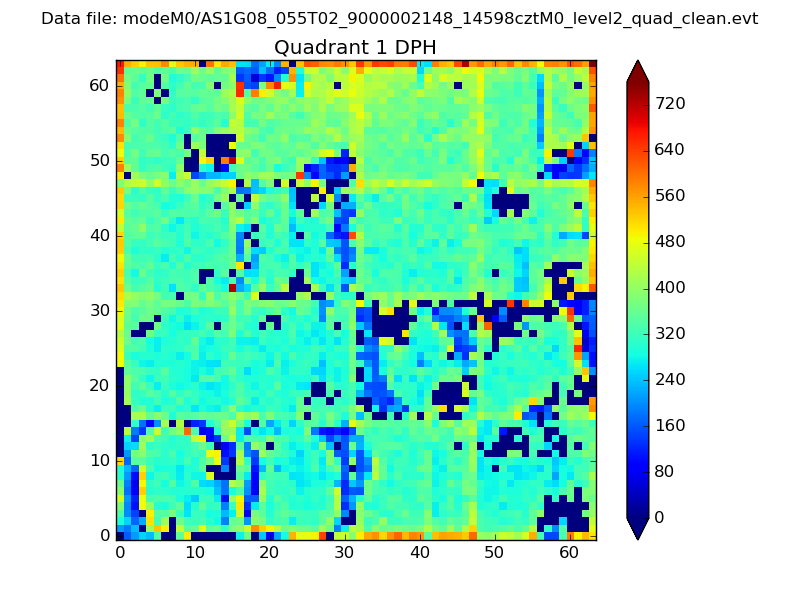 |
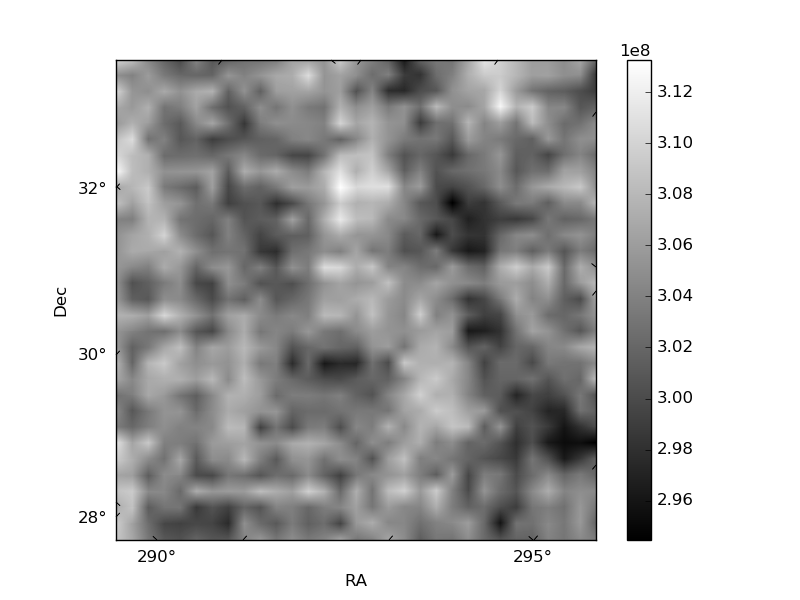
Quadrant B |
|---|---|---|---|
| Quadrant D | 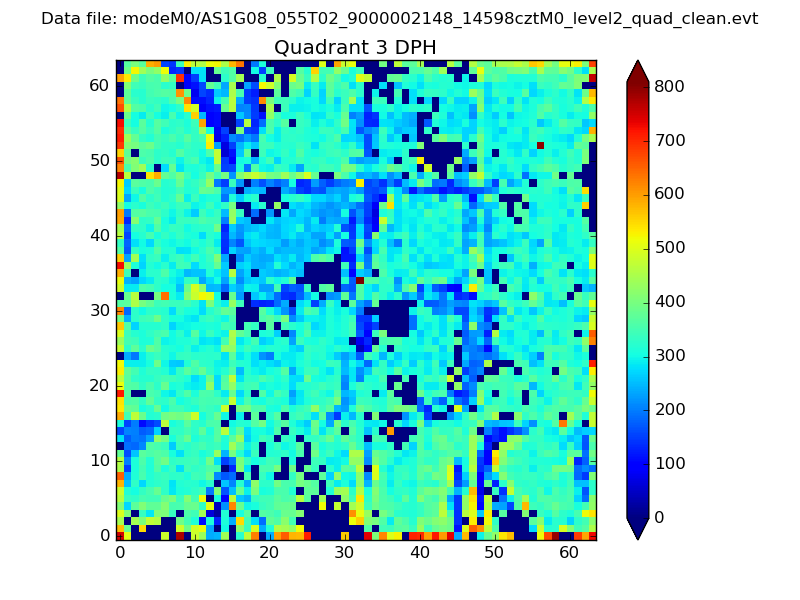 |
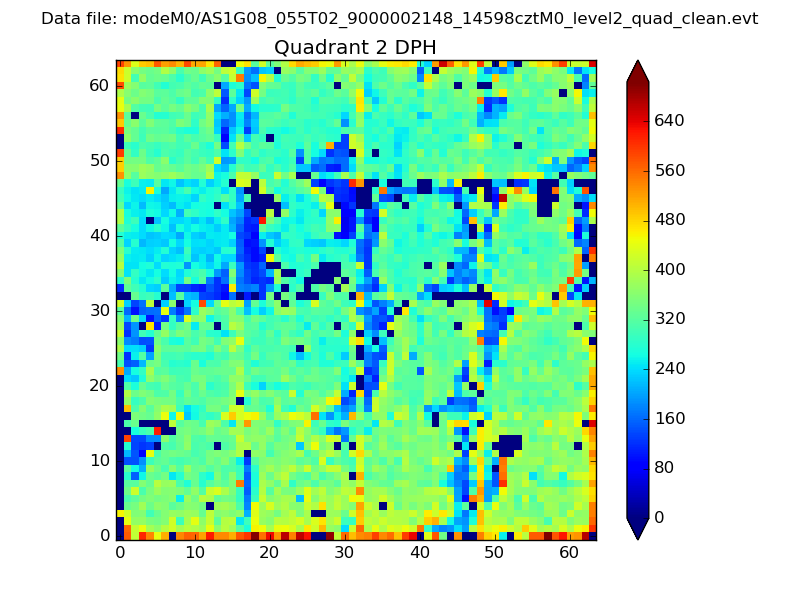 |
Quadrant C |
| Plot type | Count rate plots | Images |
|---|---|---|
| Comparison with Poisson distribution Blue bars denote a histogram of data divided into 1 sec bins. Red curve is a Poisson curve with rate = median count rate of data. |
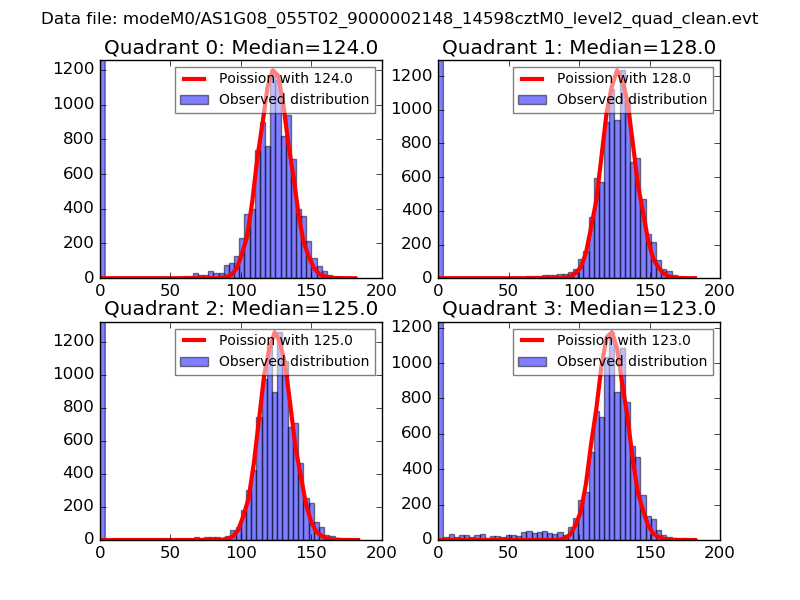 |
 |
| Quadrant-wise count rates Data is divided into 100 sec bins |
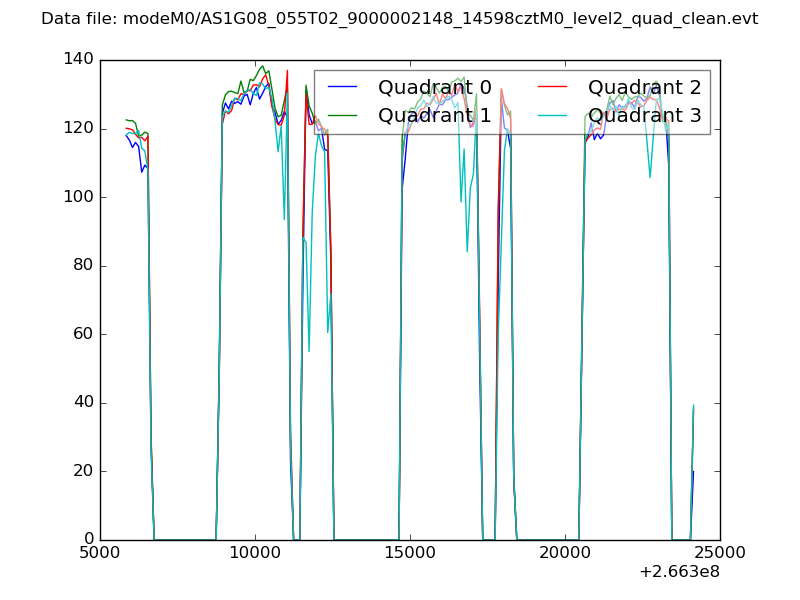 |
|
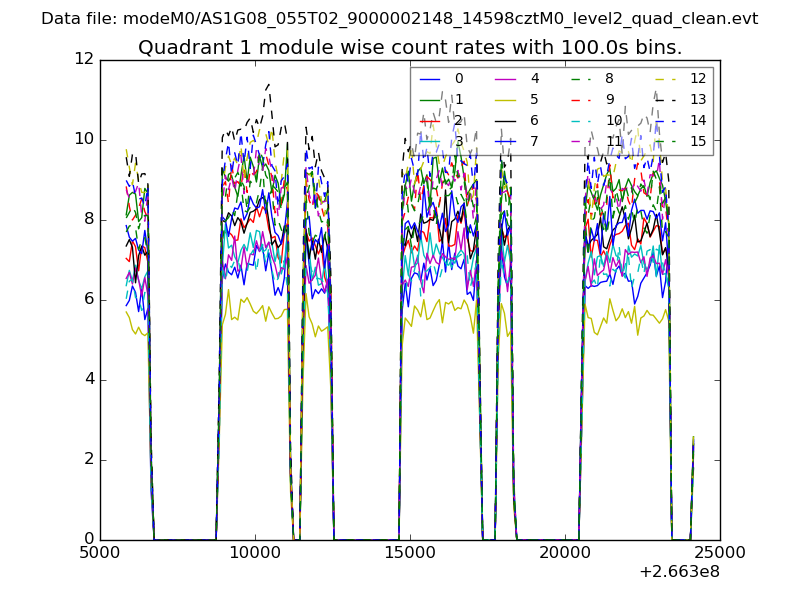
| Module-wise count rates for Quadrant A Data is divided into 100 sec bins |
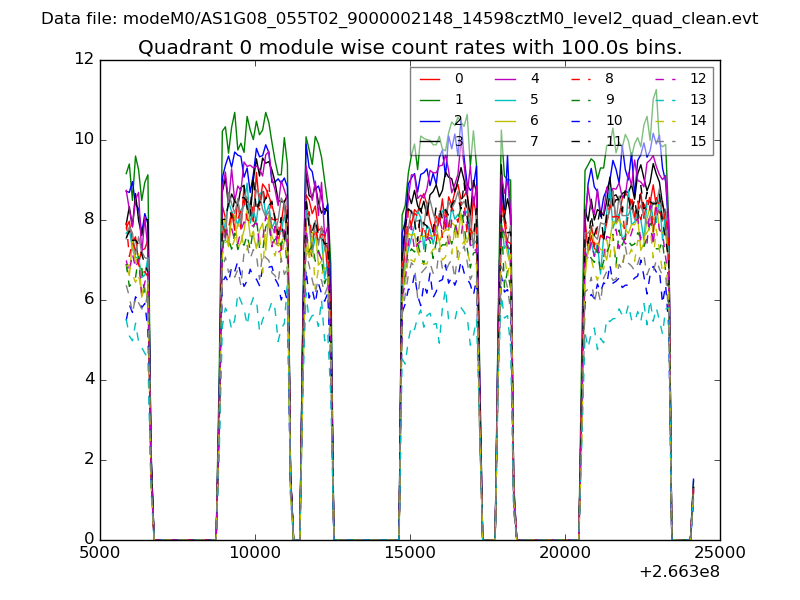 |
 |
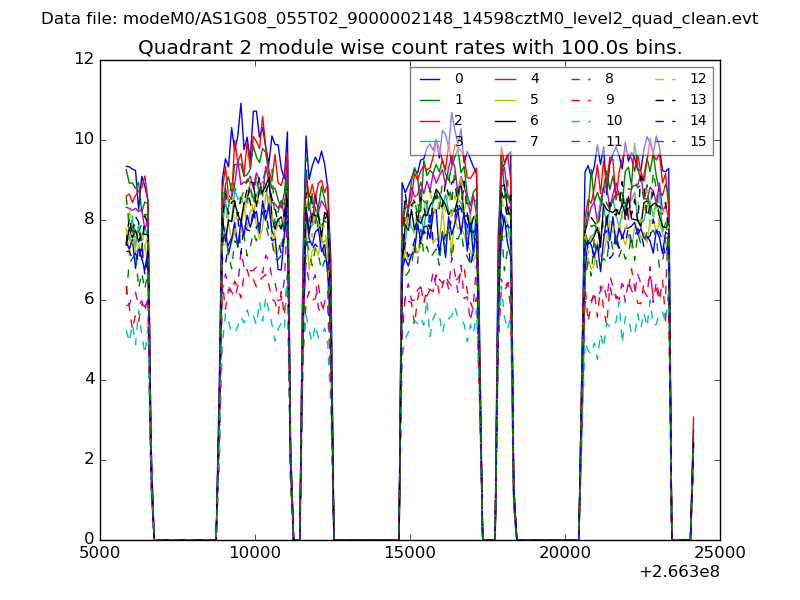
| Module-wise count rates for Quadrant B Data is divided into 100 sec bins |
 |
 |
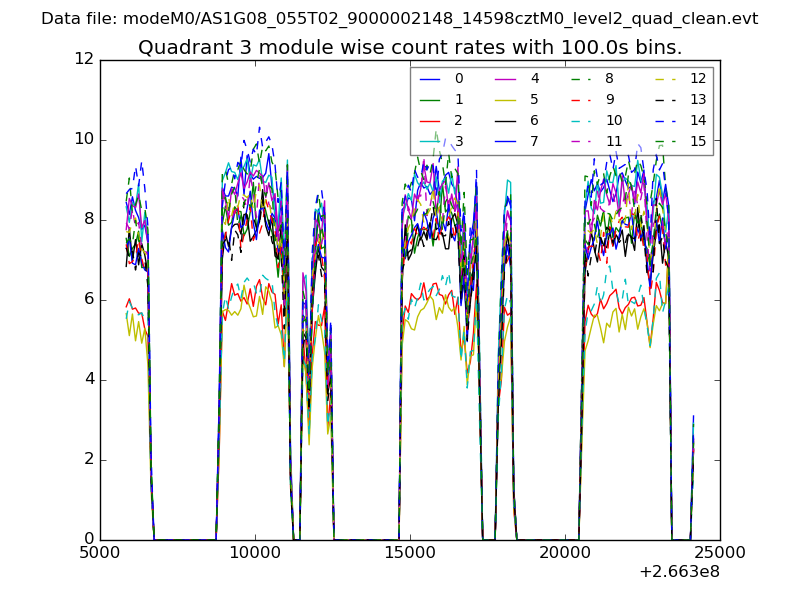
| Module-wise count rates for Quadrant C Data is divided into 100 sec bins |
 |
 |
| Module-wise count rates for Quadrant D Data is divided into 100 sec bins |
 |
 |
| Parameter | Plot |
|---|---|
| CZT HV Monitor | 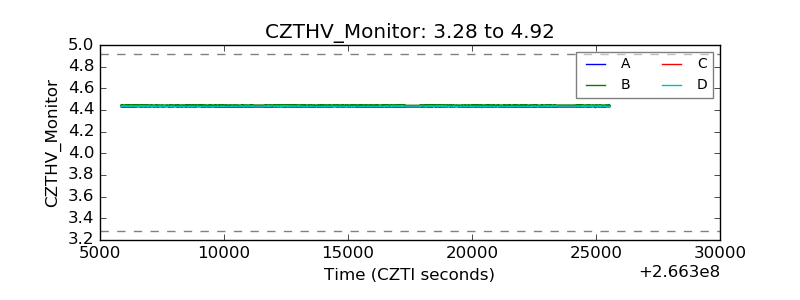 |
| D_VDD | 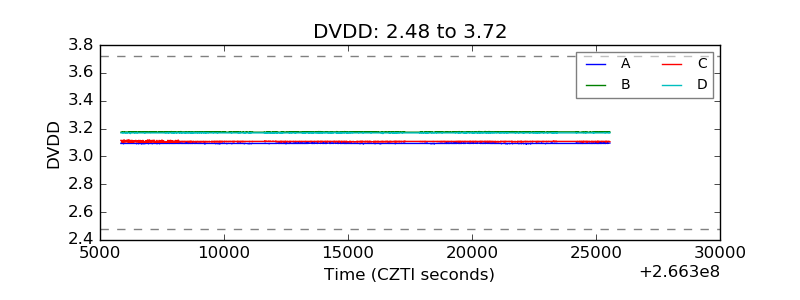 |
| Temperature 1 |  |
| Veto HV Monitor | 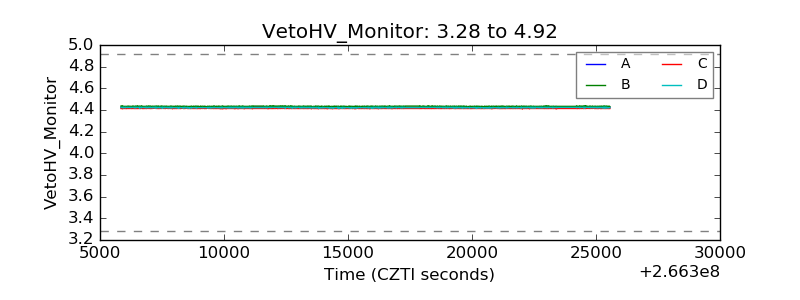 |
| Veto LLD | 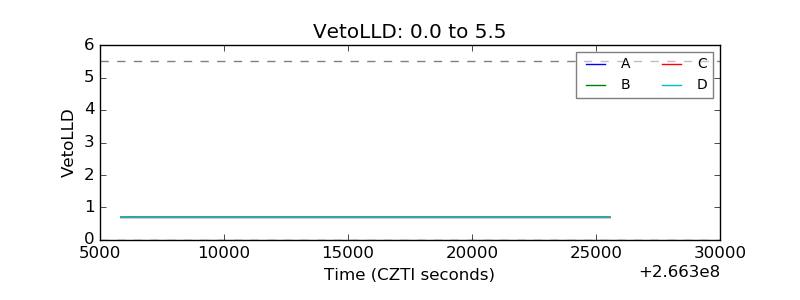 |
| Alpha Counter | 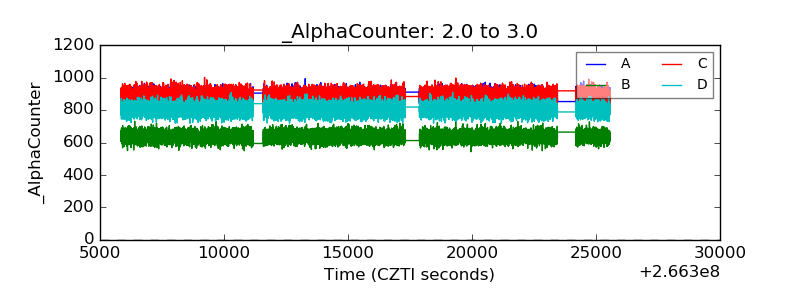 |
| _CPM_Rate | 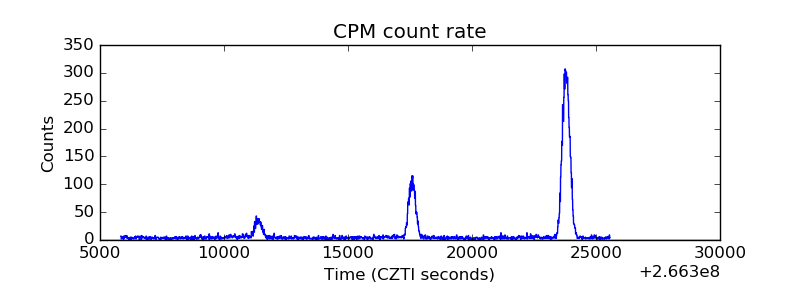 |
| CZT Counter | 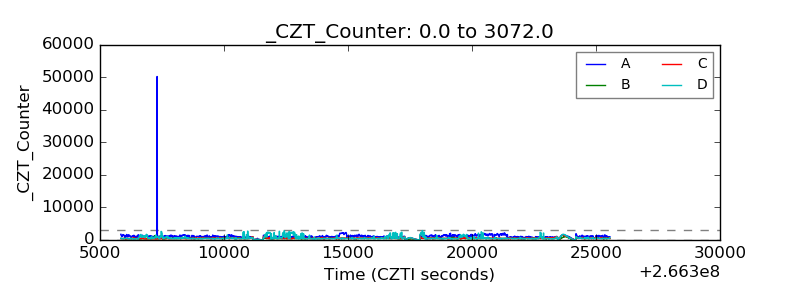 |
| +2.5 Volts monitor | 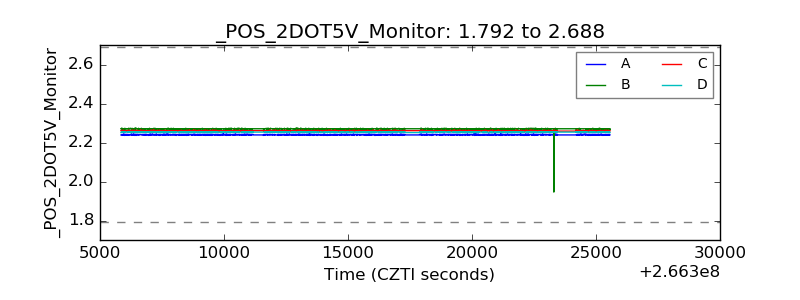 |
| +5 Volts monitor | 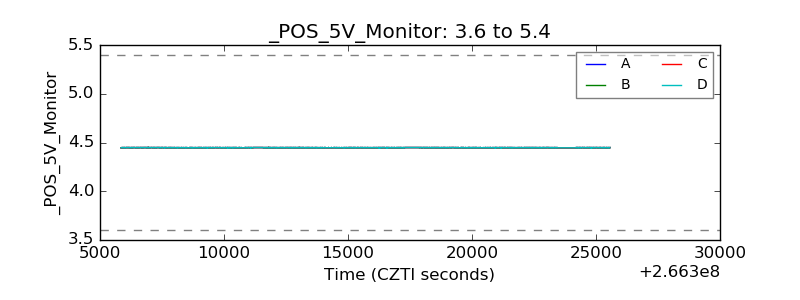 |
| _ROLL_ROT | 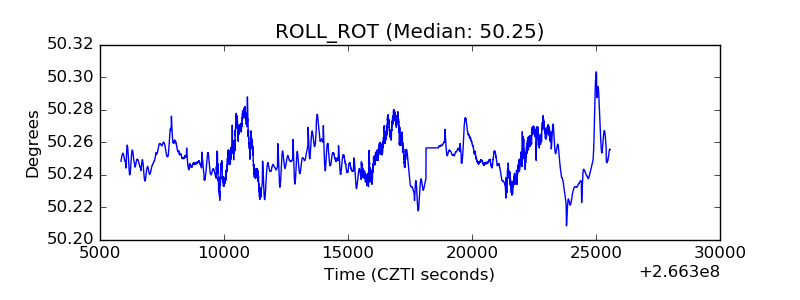 |
| _Roll_DEC |  |
| _Roll_RA | 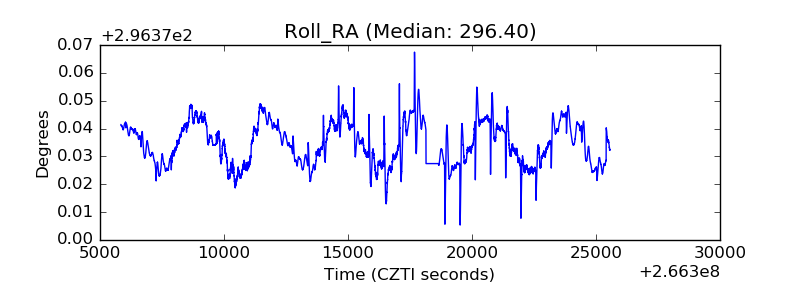 |
| Veto Counter | 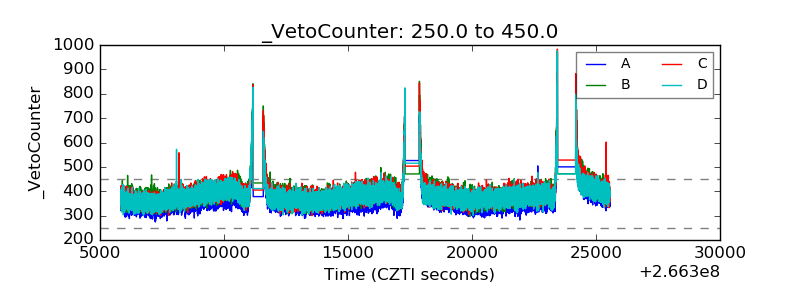 |