| Param | Original file | Final file |
|---|---|---|
| Filename | modeM0/AS1G08_055T02_9000002148_14599cztM0_level2.evt | modeM0/AS1G08_055T02_9000002148_14599cztM0_level2_quad_clean.evt |
| Size (bytes) | 655,660,800 | 66,608,640 |
| Size | 625.3 MB | 63.5 MB |
| Events in quadrant A | 7,637,098 | 388,866 |
| Events in quadrant B | 3,444,908 | 402,579 |
| Events in quadrant C | 3,666,217 | 393,256 |
| Events in quadrant D | 4,649,602 | 358,170 |
| Mode SS | |||
|---|---|---|---|
| Quadrant | BADHDUFLAG | Total packets | Discarded packets |
| A | 0 | 138 | 0 |
| B | 0 | 138 | 0 |
| C | 0 | 138 | 0 |
| D | 0 | 138 | 0 |
| Mode M9 | |||
|---|---|---|---|
| Quadrant | BADHDUFLAG | Total packets | Discarded packets |
| A | 0 | 10 | 0 |
| B | 0 | 10 | 0 |
| C | 0 | 10 | 0 |
| D | 0 | 11 | 0 |
| Mode M0 | |||
|---|---|---|---|
| Quadrant | BADHDUFLAG | Total packets | Discarded packets |
| A | 0 | 27520 | 3 |
| B | 0 | 14379 | 2 |
| C | 0 | 14715 | 2 |
| D | 0 | 18297 | 2 |
| Quadrant | Total seconds | Saturated seconds | Saturation percentage |
|---|---|---|---|
| A | 6795 | 310 | 4.562178% |
| B | 6795 | 87 | 1.280353% |
| C | 6795 | 77 | 1.133186% |
| D | 6795 | 500 | 7.358352% |
Noise dominated data is calculated using 1-second bins in cleaned event files. If a bin has >2000 counts, and if more than 50% of those come from <1% of pixels, then it is considered to be noise-dominated and hence unusable.
| Quadrant | # 1 sec bins | Bins with >0 counts | Bins with >2000 counts | High rate bins dominated by noise | Noise dominated (total time) | Noise dominated (detector-on time) | Marked lightcurve |
|---|---|---|---|---|---|---|---|
| A | 7726 | 6796 | 17 | 17 | 0.22% | 0.25% | 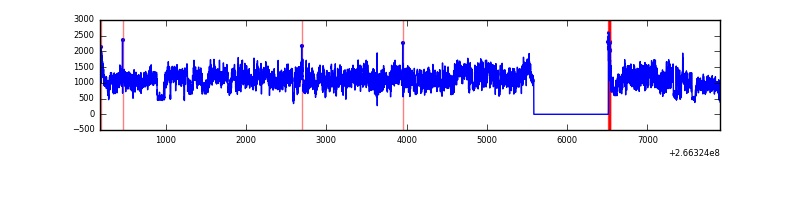 |
| B | 7726 | 6796 | 2 | 2 | 0.03% | 0.03% | 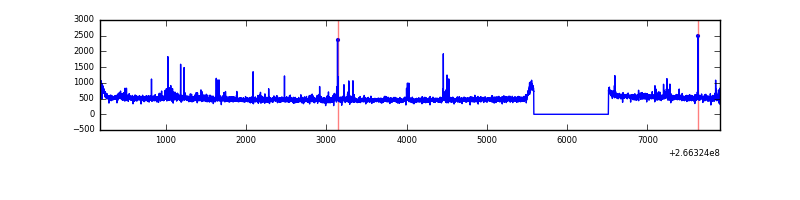 |
| C | 7726 | 6796 | 0 | 0 | 0.00% | 0.00% | 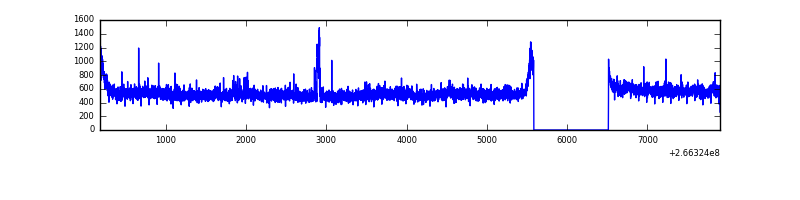 |
| D | 7726 | 6796 | 352 | 352 | 4.56% | 5.18% | 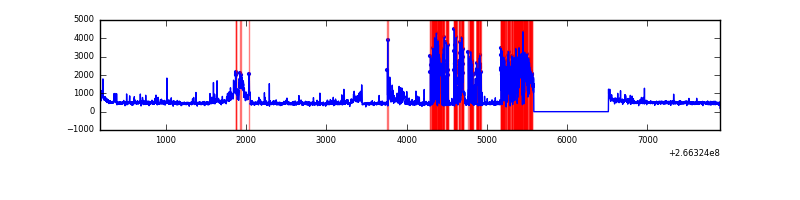 |
Top three noisy pixels from each quadrant. If the there are fewer than three noisy pixels in the level2.evt file, extra rows are filled as -1
| Pixel properties | Quadrant properties | ||||||
|---|---|---|---|---|---|---|---|
| Quadrant | DetID | PixID | Counts | Sigma | Mean | Median | Sigma |
| A | 0 | 23 | 3849020 | 22829.66 | 835 | 815 | 168.6 |
| A | 0 | 226 | 235986 | 1395.16 | 835 | 815 | 168.6 |
| A | 8 | 15 | 121744 | 717.41 | 835 | 815 | 168.6 |
| B | 0 | 189 | 38166 | 228.42 | 843 | 821 | 163.5 |
| B | 0 | 205 | 26870 | 159.33 | 843 | 821 | 163.5 |
| B | 0 | 214 | 21459 | 126.23 | 843 | 821 | 163.5 |
| C | 3 | 233 | 450524 | 2359.45 | 818 | 822 | 190.6 |
| C | 10 | 22 | 26478 | 134.61 | 818 | 822 | 190.6 |
| C | 13 | 61 | 5760 | 25.91 | 818 | 822 | 190.6 |
| D | 10 | 199 | 1116967 | 5948.66 | 787 | 767 | 187.6 |
| D | 12 | 110 | 461082 | 2453.2 | 787 | 767 | 187.6 |
| D | 2 | 152 | 34089 | 177.58 | 787 | 767 | 187.6 |
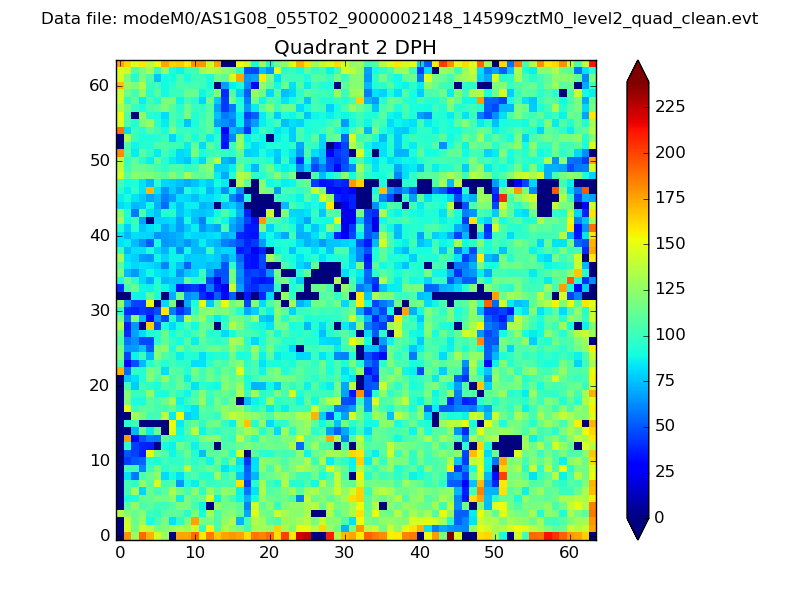
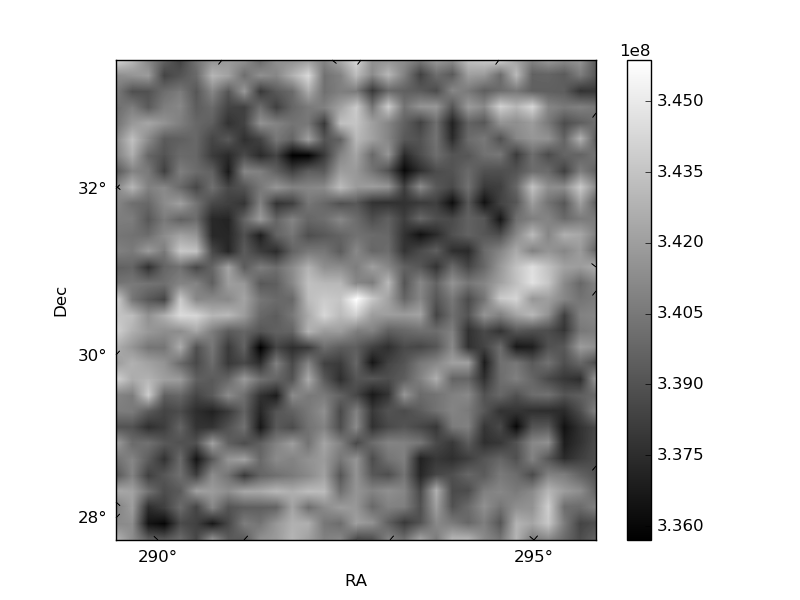
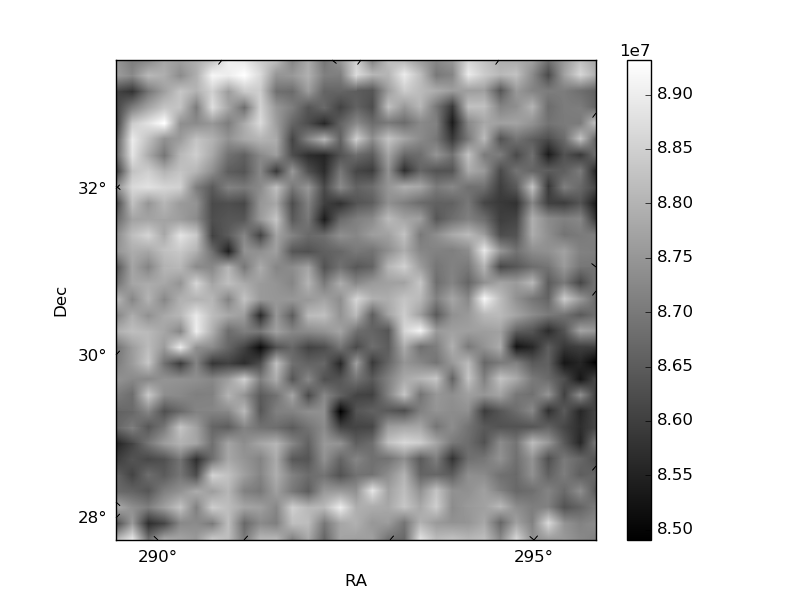
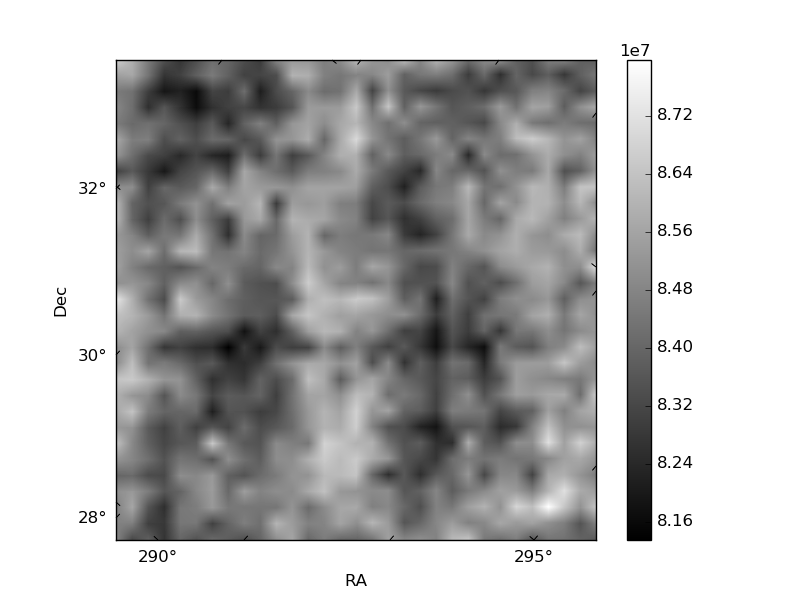
Histogram calculated using DETX and DETY for each event in the final _common_clean file
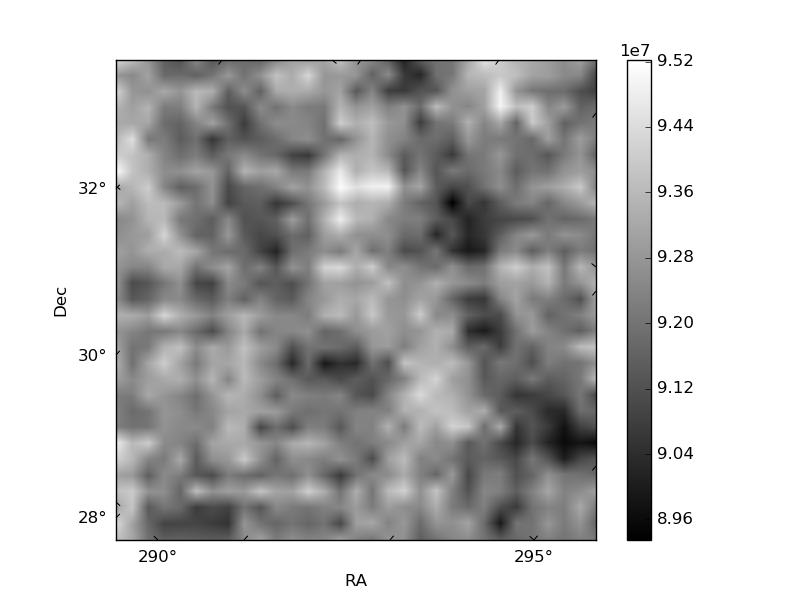
| Quadrant A | 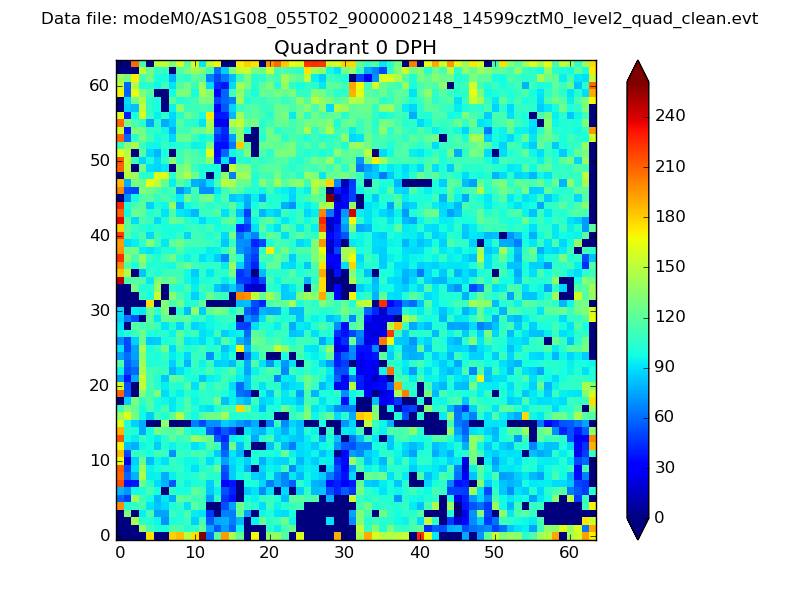 |
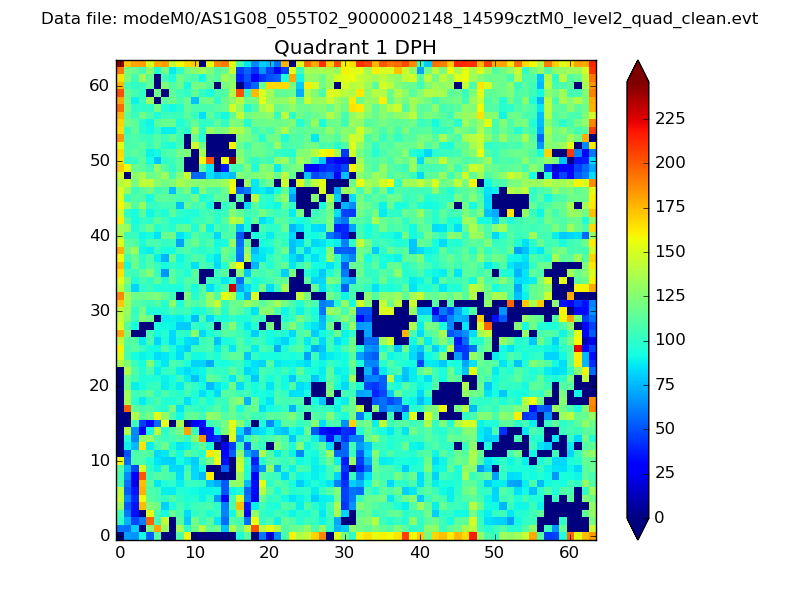 |
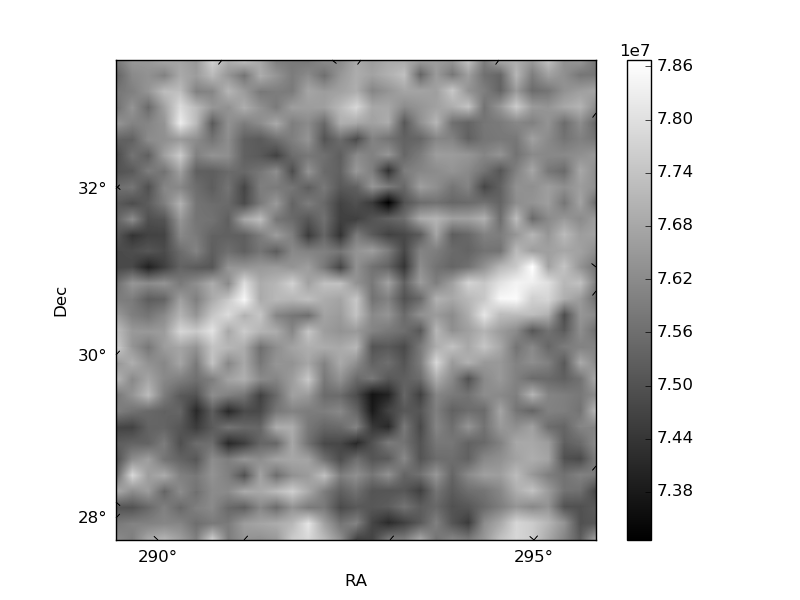
Quadrant B |
|---|---|---|---|
| Quadrant D | 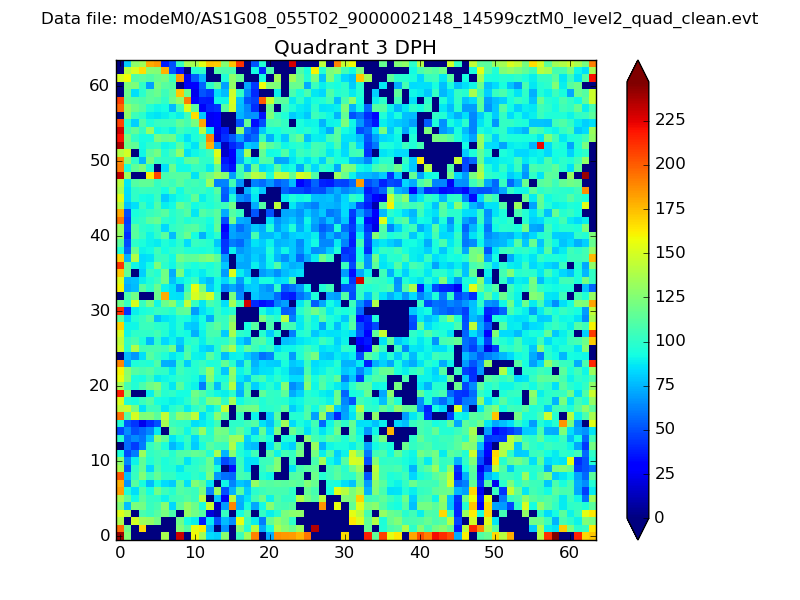 |
 |
Quadrant C |
| Plot type | Count rate plots | Images |
|---|---|---|
| Comparison with Poisson distribution Blue bars denote a histogram of data divided into 1 sec bins. Red curve is a Poisson curve with rate = median count rate of data. |
 |
 |
| Quadrant-wise count rates Data is divided into 100 sec bins |
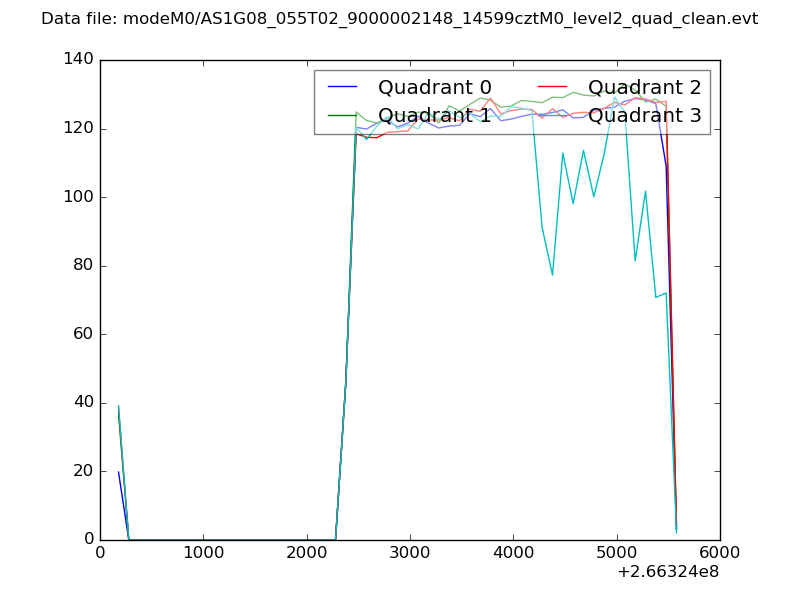 |
|
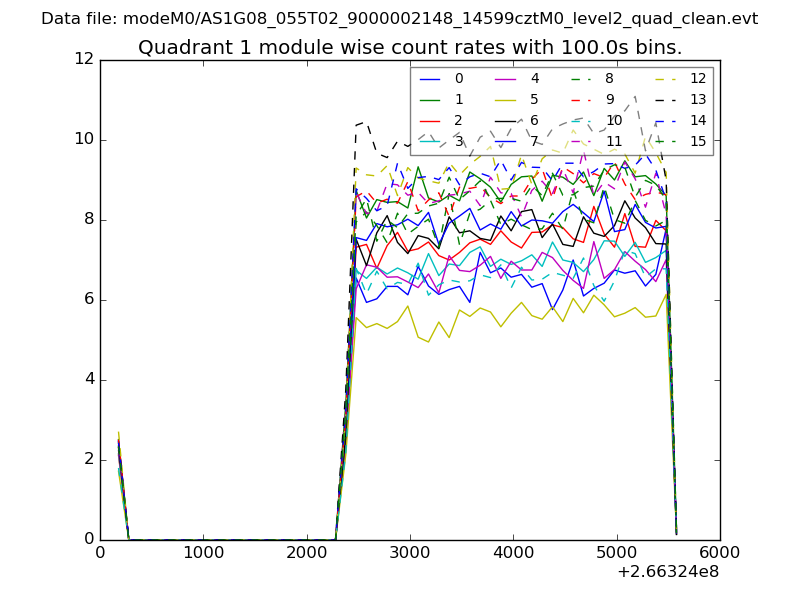
| Module-wise count rates for Quadrant A Data is divided into 100 sec bins |
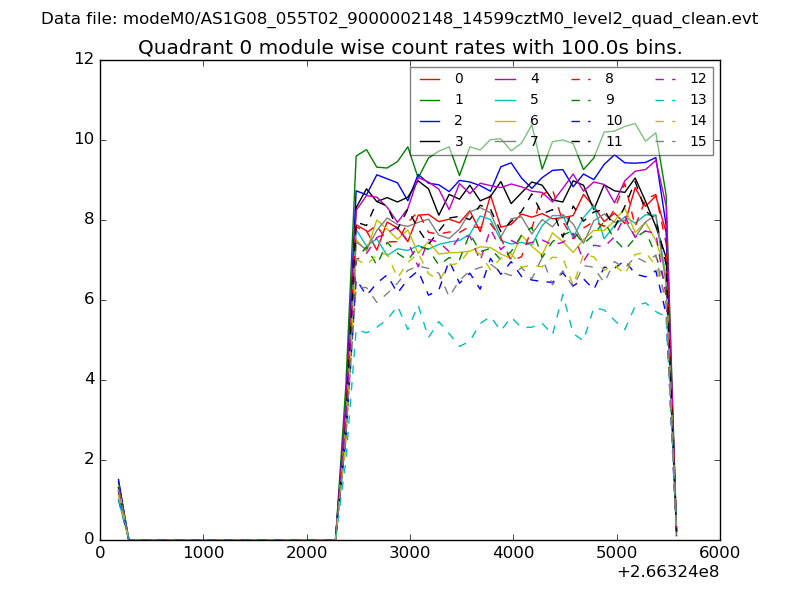 |
 |
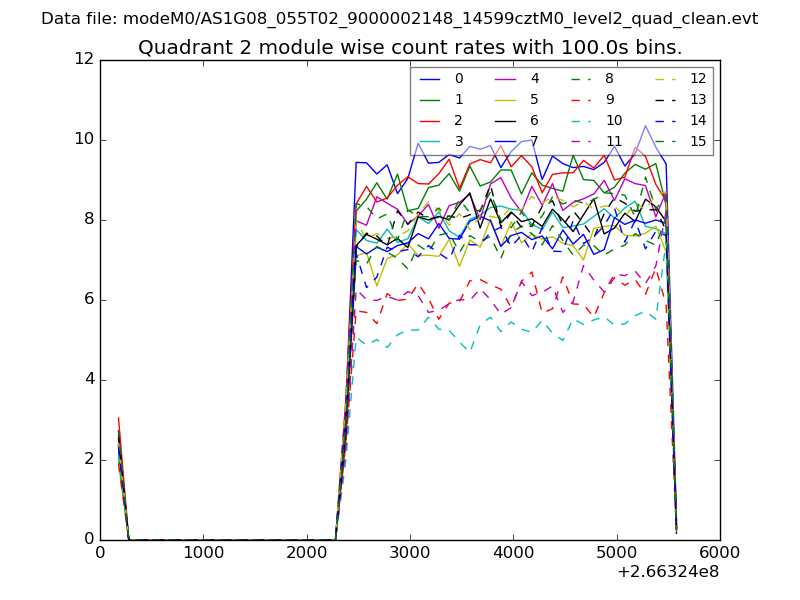
| Module-wise count rates for Quadrant B Data is divided into 100 sec bins |
 |
 |
| Module-wise count rates for Quadrant C Data is divided into 100 sec bins |
 |
 |
| Module-wise count rates for Quadrant D Data is divided into 100 sec bins |
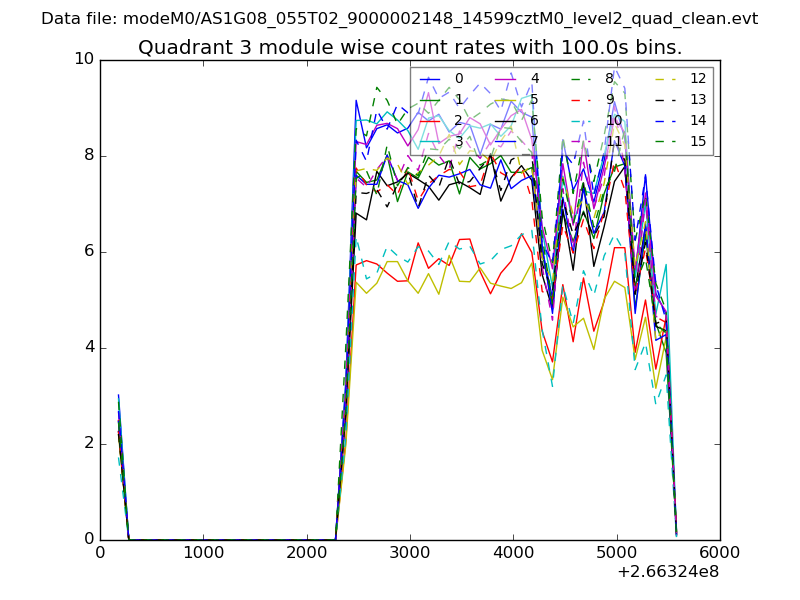 |
 |
| Parameter | Plot |
|---|---|
| CZT HV Monitor | 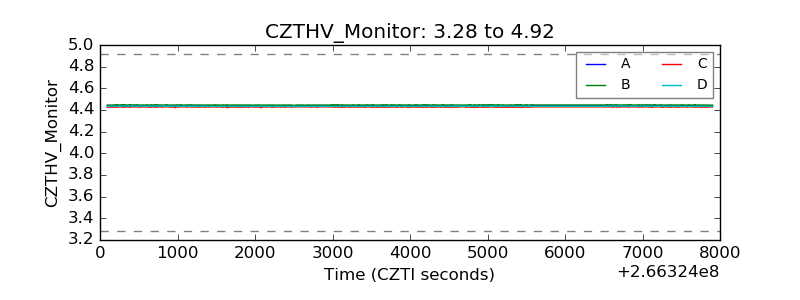 |
| D_VDD | 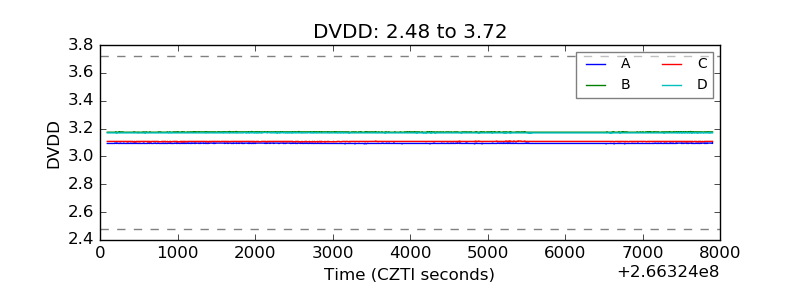 |
| Temperature 1 | 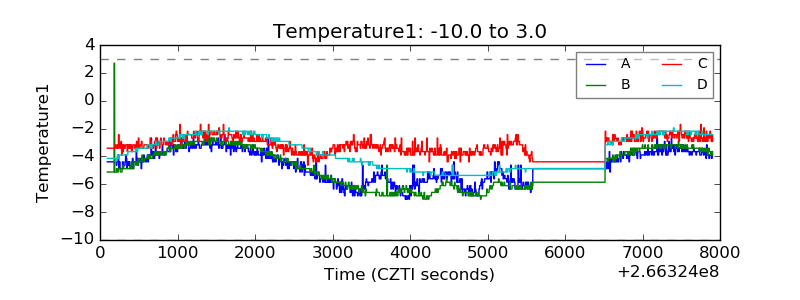 |
| Veto HV Monitor | 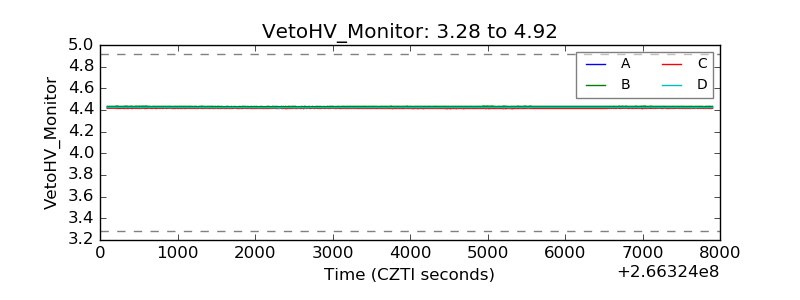 |
| Veto LLD | 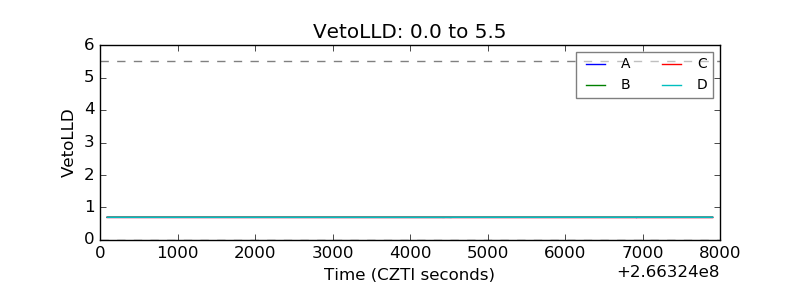 |
| Alpha Counter | 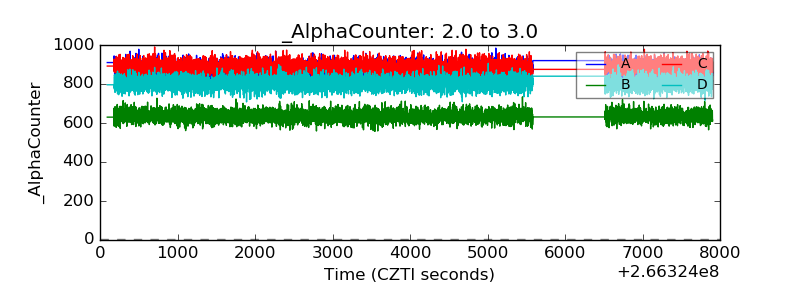 |
| _CPM_Rate | 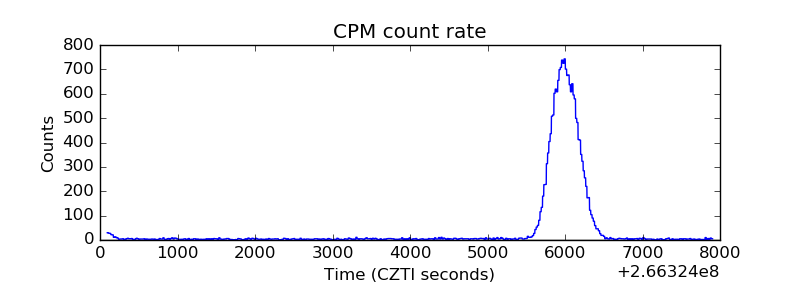 |
| CZT Counter | 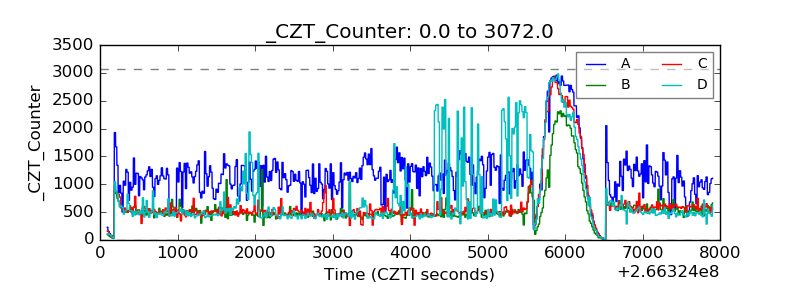 |
| +2.5 Volts monitor |  |
| +5 Volts monitor |  |
| _ROLL_ROT | 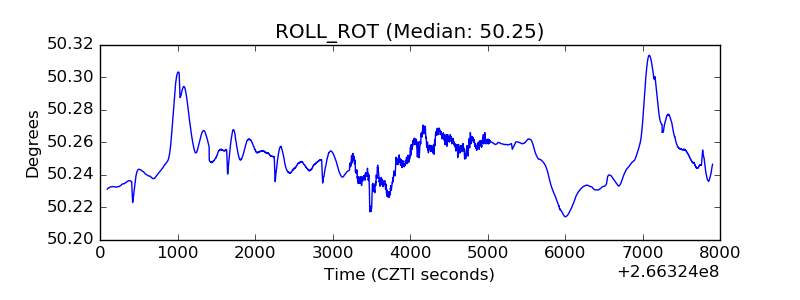 |
| _Roll_DEC | 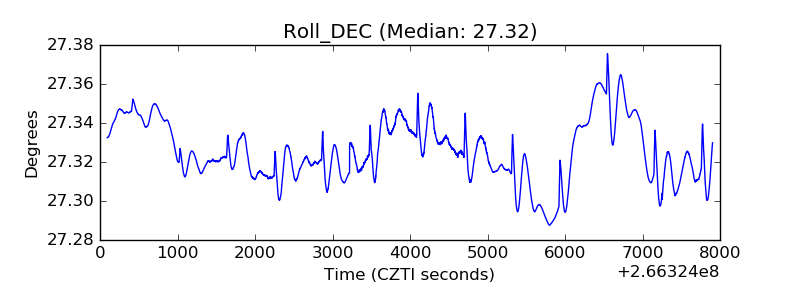 |
| _Roll_RA | 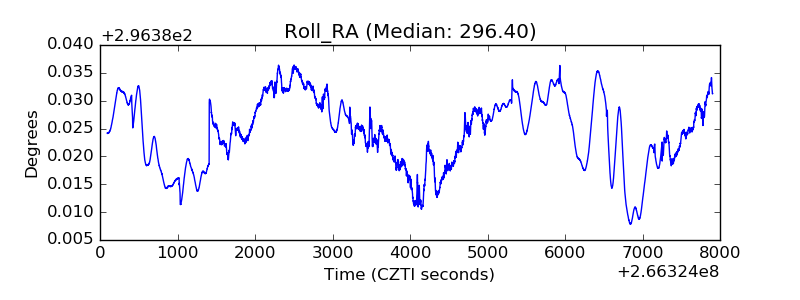 |
| Veto Counter | 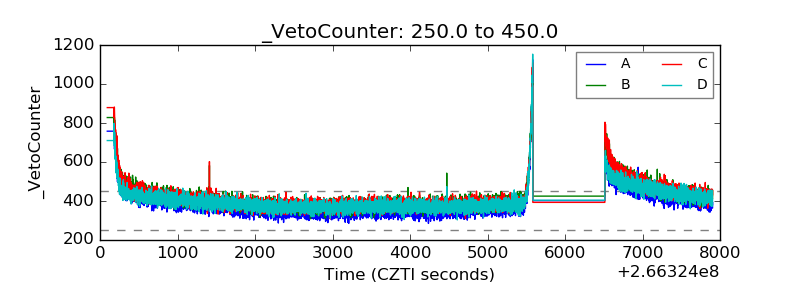 |