| Param | Original file | Final file |
|---|---|---|
| Filename | modeM0/AS1G08_055T02_9000002148_14600cztM0_level2.evt | modeM0/AS1G08_055T02_9000002148_14600cztM0_level2_quad_clean.evt |
| Size (bytes) | 2,610,616,320 | 321,526,080 |
| Size | 2.4 GB | 306.6 MB |
| Events in quadrant A | 30,096,593 | 1,957,884 |
| Events in quadrant B | 13,666,270 | 2,021,022 |
| Events in quadrant C | 15,007,010 | 1,977,455 |
| Events in quadrant D | 18,428,183 | 1,872,216 |
| Mode SS | |||
|---|---|---|---|
| Quadrant | BADHDUFLAG | Total packets | Discarded packets |
| A | 0 | 566 | 0 |
| B | 0 | 566 | 0 |
| C | 0 | 566 | 0 |
| D | 0 | 566 | 0 |
| Mode M9 | |||
|---|---|---|---|
| Quadrant | BADHDUFLAG | Total packets | Discarded packets |
| A | 0 | 37 | 0 |
| B | 0 | 37 | 0 |
| C | 0 | 37 | 0 |
| D | 0 | 37 | 0 |
| Mode M0 | |||
|---|---|---|---|
| Quadrant | BADHDUFLAG | Total packets | Discarded packets |
| A | 0 | 109065 | 6 |
| B | 0 | 58030 | 5 |
| C | 0 | 60726 | 5 |
| D | 0 | 73409 | 5 |
| Quadrant | Total seconds | Saturated seconds | Saturation percentage |
|---|---|---|---|
| A | 27755 | 1305 | 4.701856% |
| B | 27755 | 401 | 1.444785% |
| C | 27755 | 297 | 1.070077% |
| D | 27755 | 1970 | 7.097820% |
Noise dominated data is calculated using 1-second bins in cleaned event files. If a bin has >2000 counts, and if more than 50% of those come from <1% of pixels, then it is considered to be noise-dominated and hence unusable.
| Quadrant | # 1 sec bins | Bins with >0 counts | Bins with >2000 counts | High rate bins dominated by noise | Noise dominated (total time) | Noise dominated (detector-on time) | Marked lightcurve |
|---|---|---|---|---|---|---|---|
| A | 31491 | 27756 | 283 | 283 | 0.90% | 1.02% | 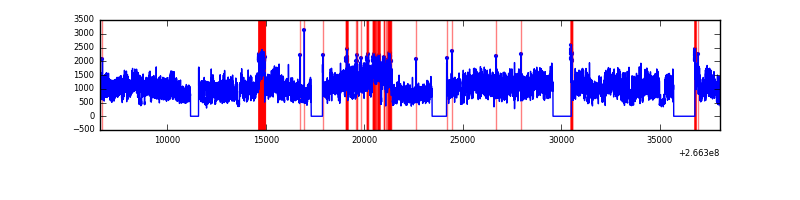 |
| B | 31491 | 27756 | 7 | 7 | 0.02% | 0.03% | 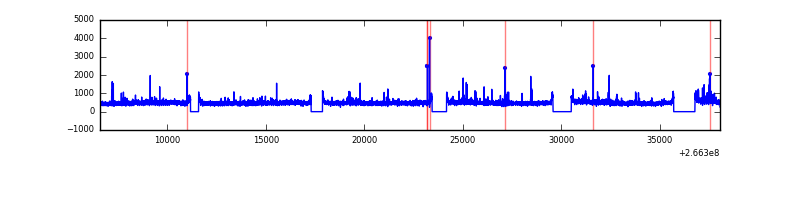 |
| C | 31491 | 27758 | 0 | 0 | 0.00% | 0.00% | 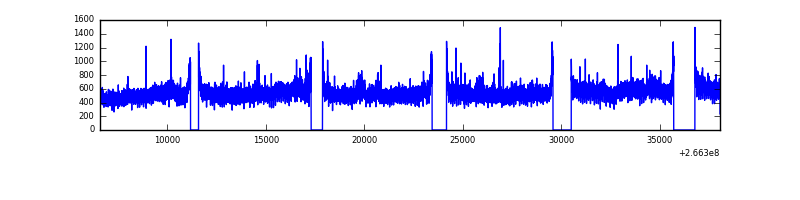 |
| D | 31491 | 27756 | 1325 | 1325 | 4.21% | 4.77% | 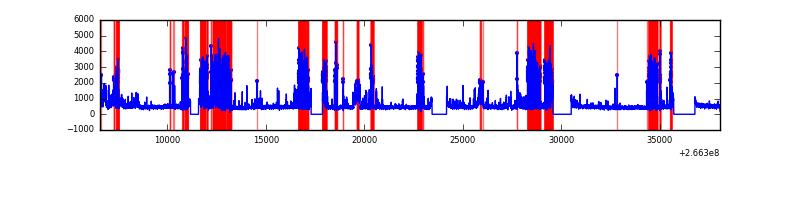 |
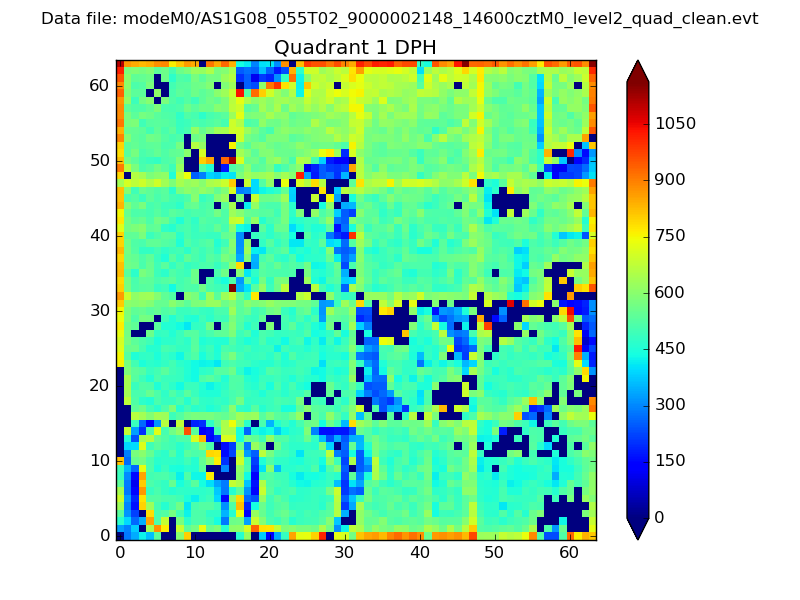
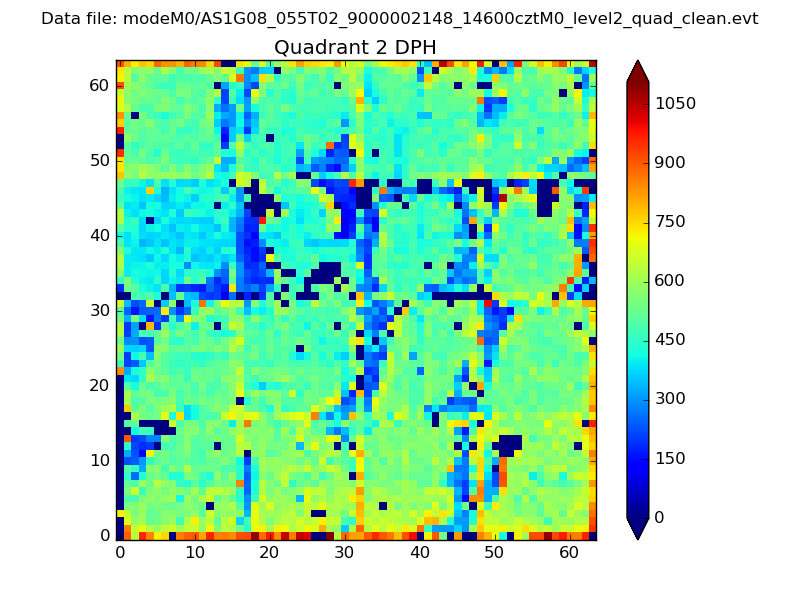
Top three noisy pixels from each quadrant. If the there are fewer than three noisy pixels in the level2.evt file, extra rows are filled as -1
| Pixel properties | Quadrant properties | ||||||
|---|---|---|---|---|---|---|---|
| Quadrant | DetID | PixID | Counts | Sigma | Mean | Median | Sigma |
| A | 0 | 23 | 15096458 | 22418.95 | 3341 | 3268 | 673.2 |
| A | 0 | 226 | 927896 | 1373.41 | 3341 | 3268 | 673.2 |
| A | 1 | 162 | 379187 | 558.38 | 3341 | 3268 | 673.2 |
| B | 0 | 189 | 130243 | 196.54 | 3371 | 3287 | 646.0 |
| B | 12 | 111 | 78670 | 116.7 | 3371 | 3287 | 646.0 |
| B | 0 | 205 | 77096 | 114.26 | 3371 | 3287 | 646.0 |
| C | 3 | 233 | 2158569 | 2842.98 | 3285 | 3304 | 758.1 |
| C | 10 | 22 | 32868 | 39.0 | 3285 | 3304 | 758.1 |
| C | 13 | 61 | 23302 | 26.38 | 3285 | 3304 | 758.1 |
| D | 10 | 199 | 3956289 | 5280.89 | 3179 | 3104 | 748.6 |
| D | 12 | 110 | 1693368 | 2257.95 | 3179 | 3104 | 748.6 |
| D | 2 | 14 | 220745 | 290.74 | 3179 | 3104 | 748.6 |
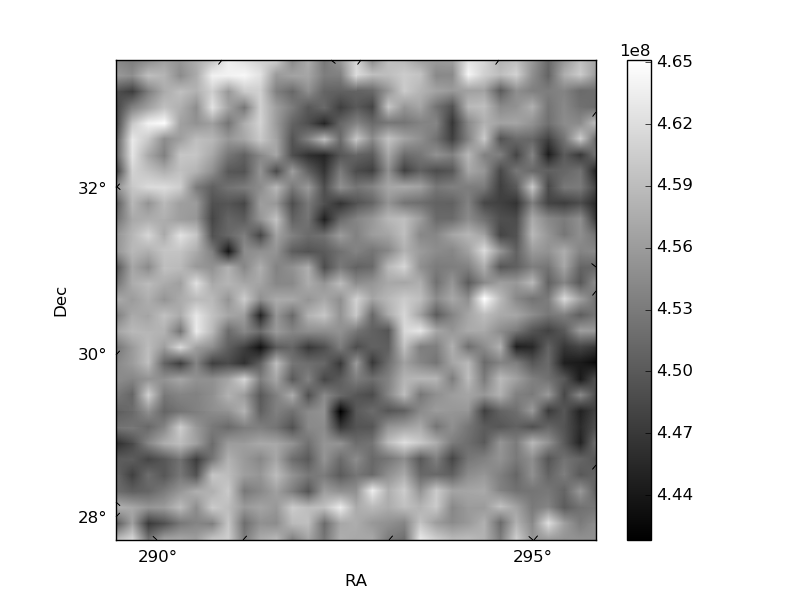
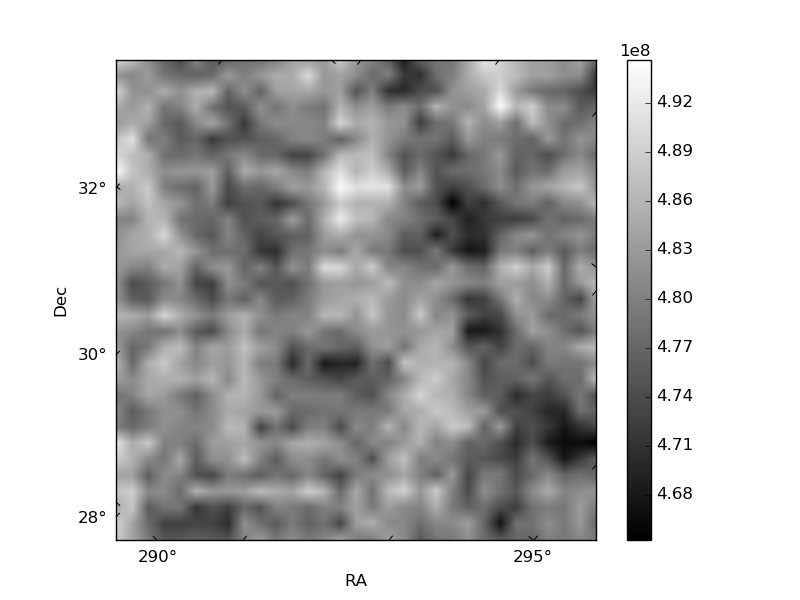
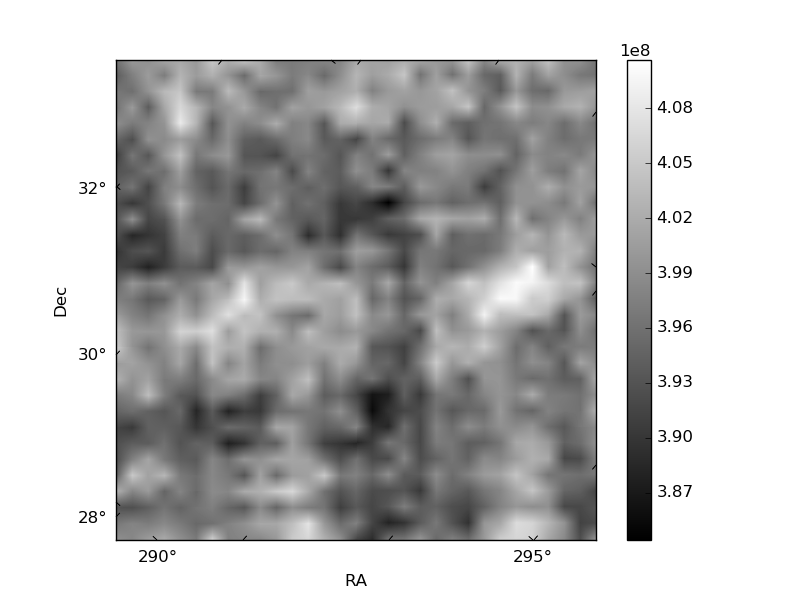
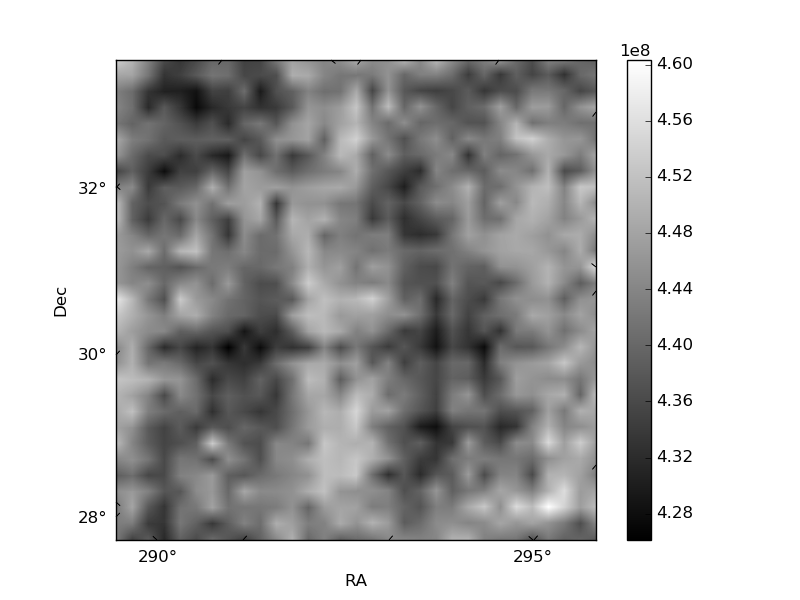
Histogram calculated using DETX and DETY for each event in the final _common_clean file
| Quadrant A | 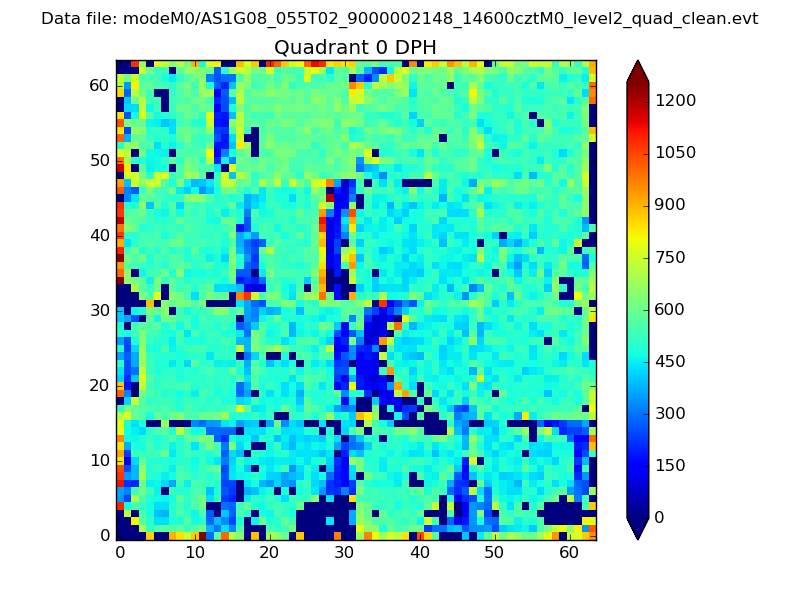 |
 |
Quadrant B |
|---|---|---|---|
| Quadrant D | 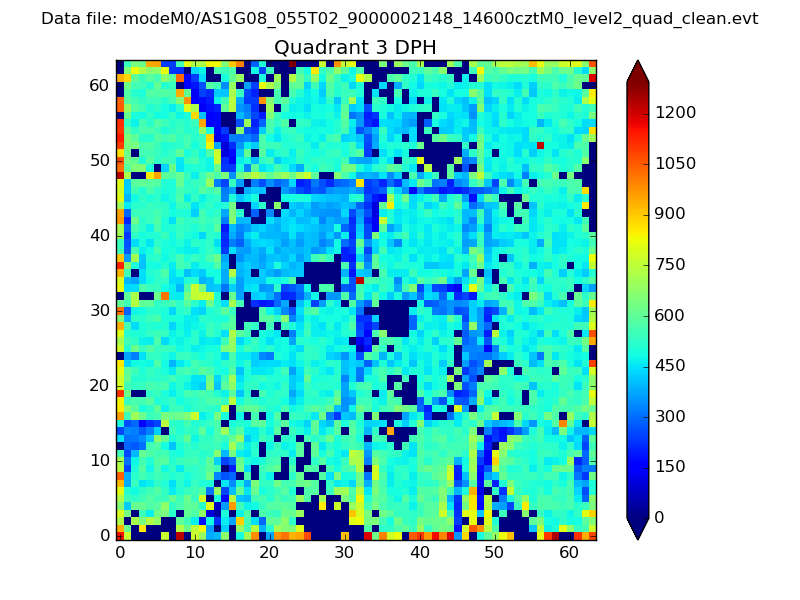 |
 |
Quadrant C |
| Plot type | Count rate plots | Images |
|---|---|---|
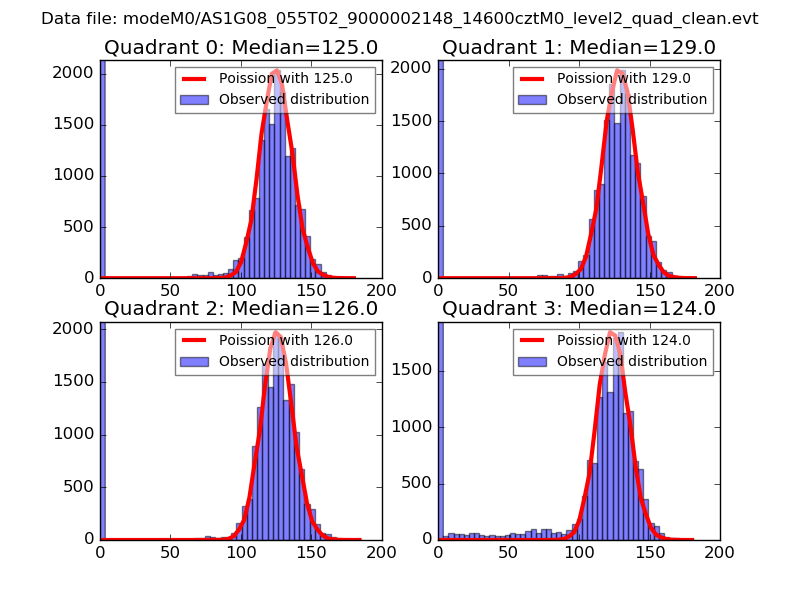
| Comparison with Poisson distribution Blue bars denote a histogram of data divided into 1 sec bins. Red curve is a Poisson curve with rate = median count rate of data. |
 |
 |
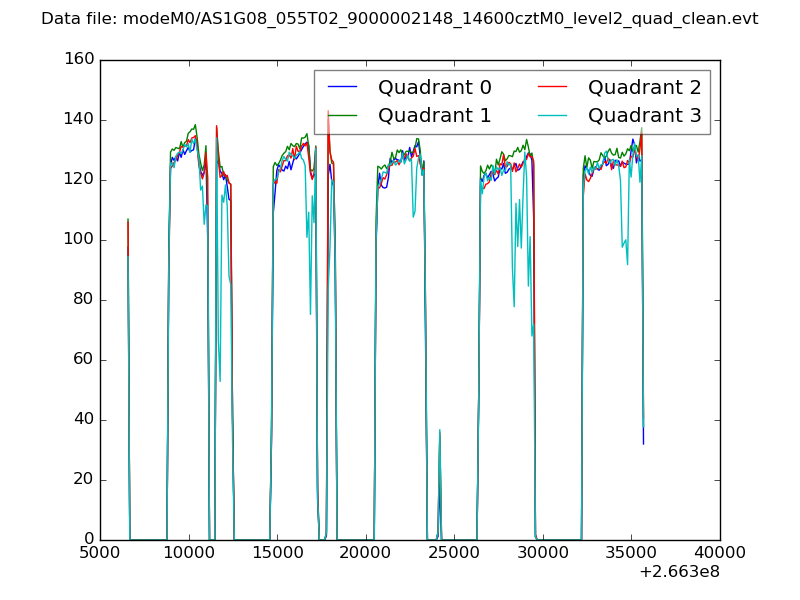
| Quadrant-wise count rates Data is divided into 100 sec bins |
 |
|
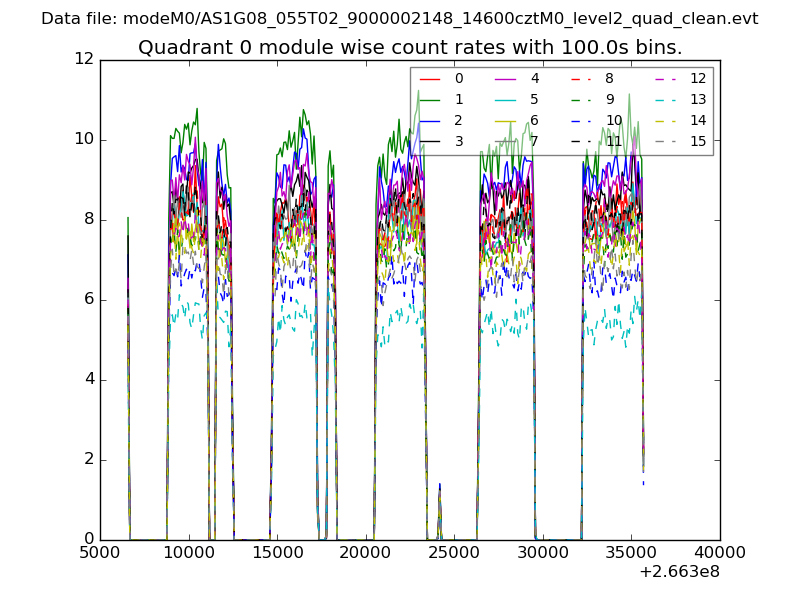
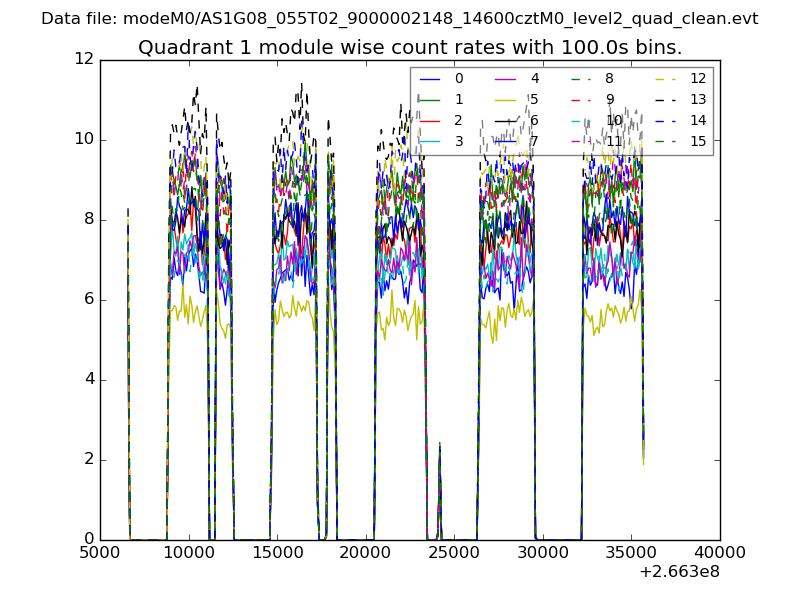
| Module-wise count rates for Quadrant A Data is divided into 100 sec bins |
 |
 |
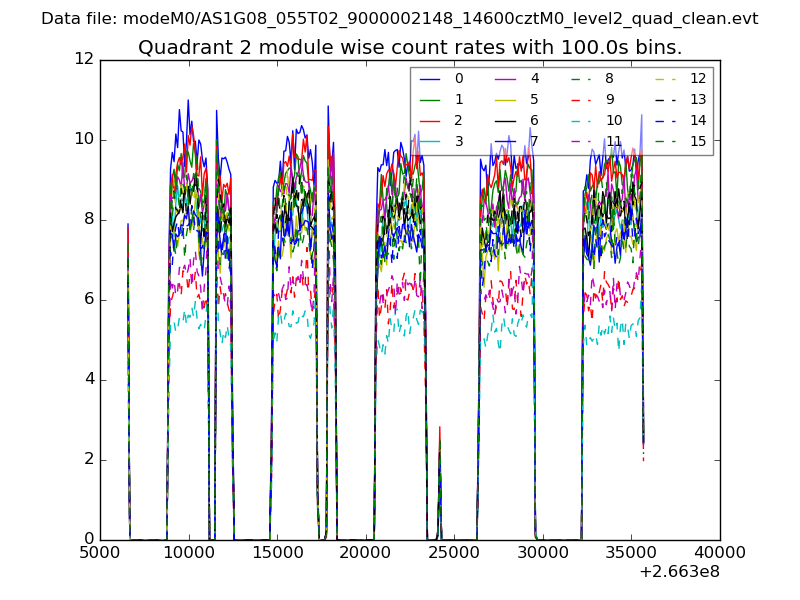
| Module-wise count rates for Quadrant B Data is divided into 100 sec bins |
 |
 |
| Module-wise count rates for Quadrant C Data is divided into 100 sec bins |
 |
 |
| Module-wise count rates for Quadrant D Data is divided into 100 sec bins |
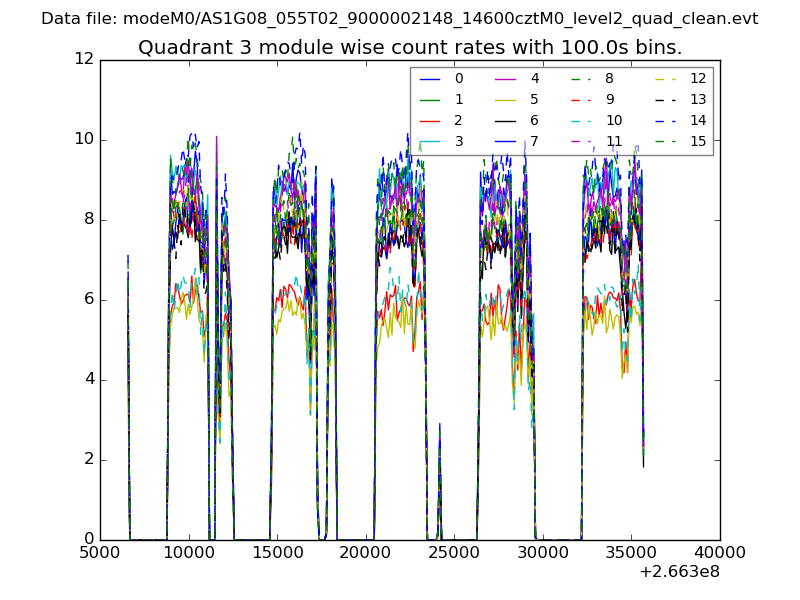 |
 |
| Parameter | Plot |
|---|---|
| CZT HV Monitor | 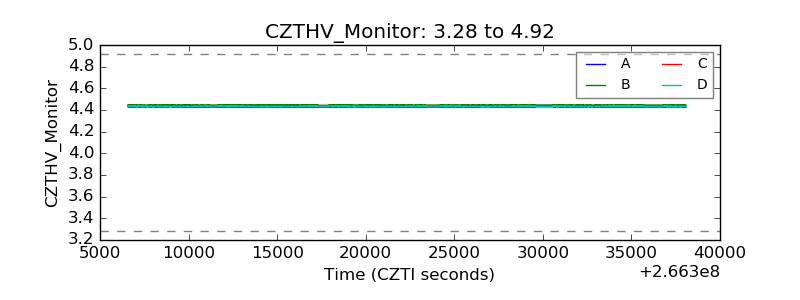 |
| D_VDD | 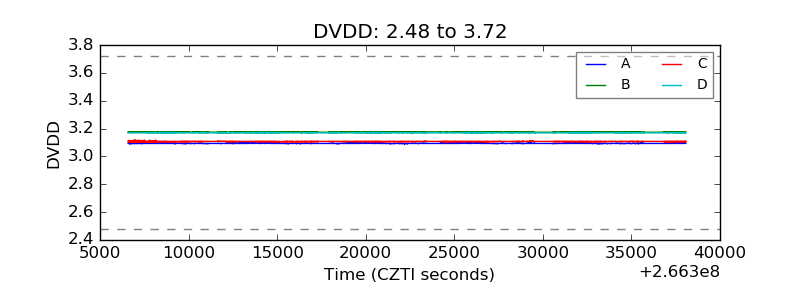 |
| Temperature 1 | 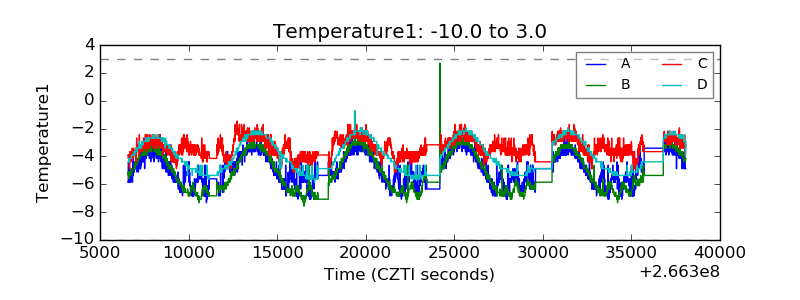 |
| Veto HV Monitor | 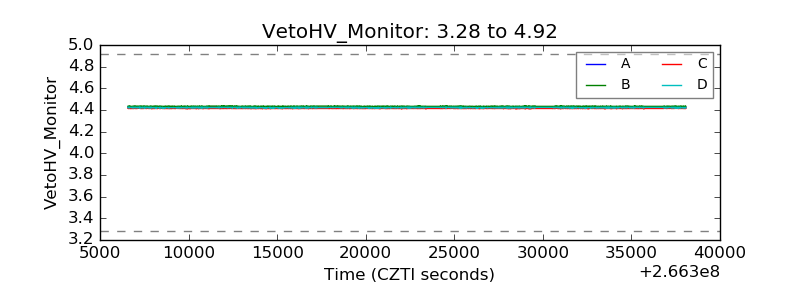 |
| Veto LLD | 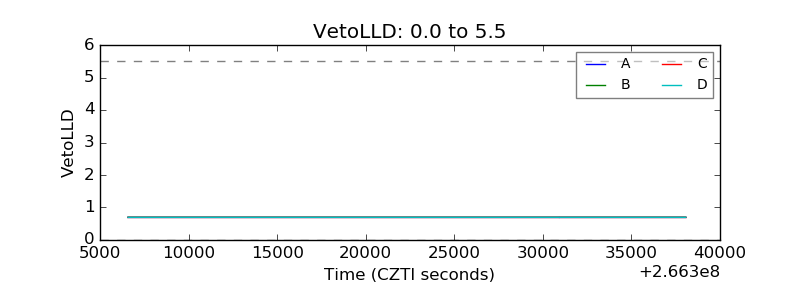 |
| Alpha Counter | 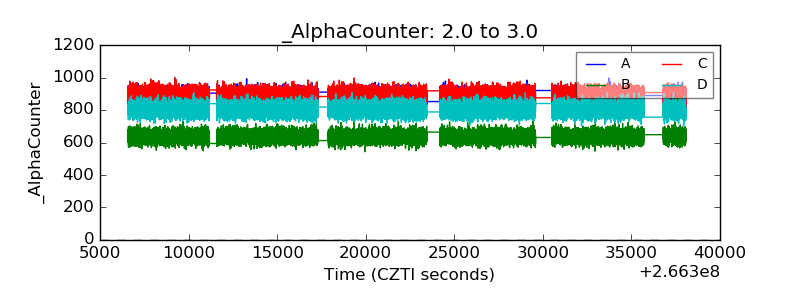 |
| _CPM_Rate | 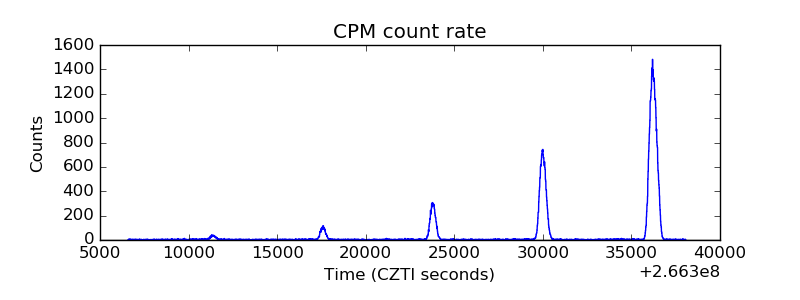 |
| CZT Counter | 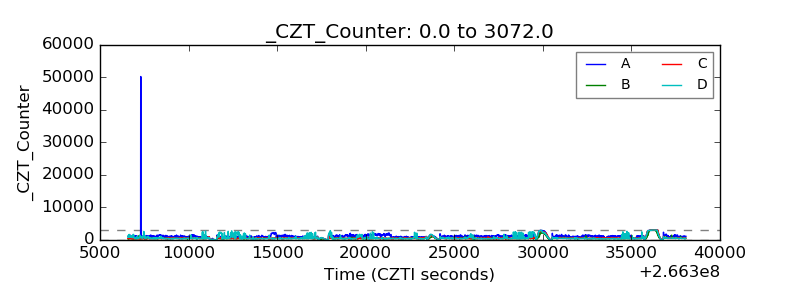 |
| +2.5 Volts monitor | 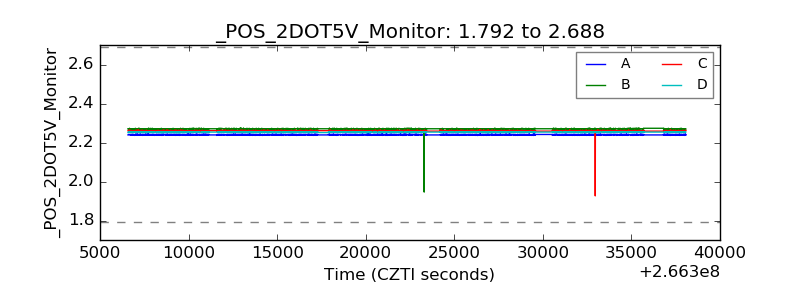 |
| +5 Volts monitor |  |
| _ROLL_ROT | 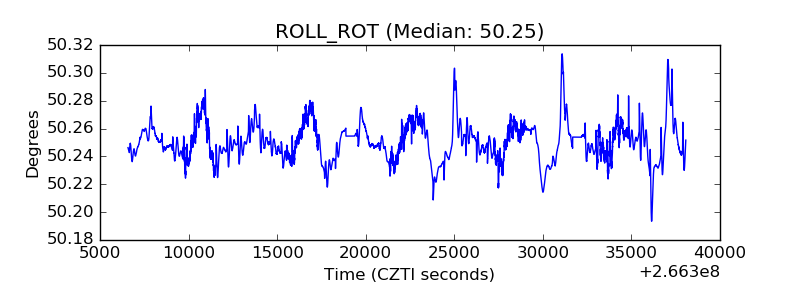 |
| _Roll_DEC | 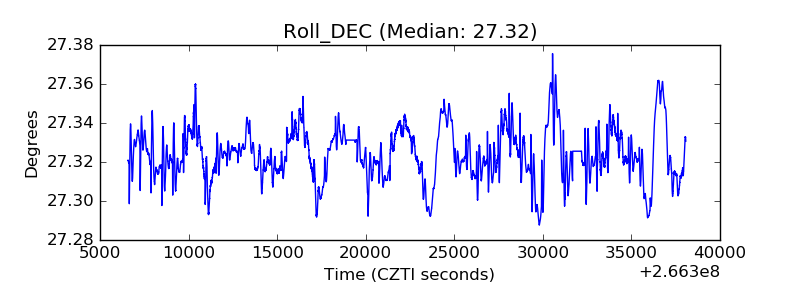 |
| _Roll_RA | 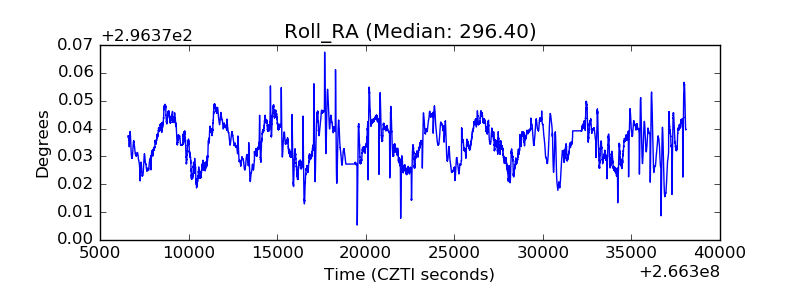 |
| Veto Counter | 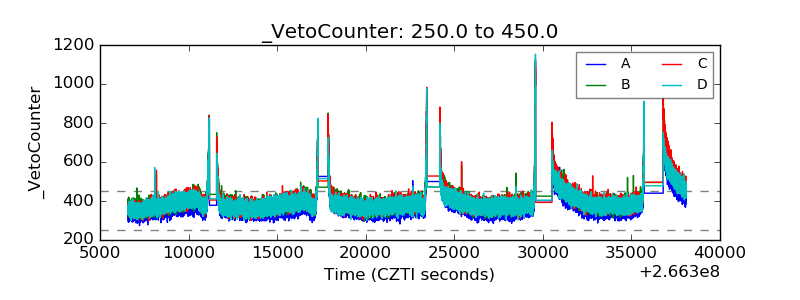 |