| Param | Original file | Final file |
|---|---|---|
| Filename | modeM0/AS1G08_055T02_9000002148_14602cztM0_level2.evt | modeM0/AS1G08_055T02_9000002148_14602cztM0_level2_quad_clean.evt |
| Size (bytes) | 638,533,440 | 87,825,600 |
| Size | 609.0 MB | 83.8 MB |
| Events in quadrant A | 7,833,307 | 542,868 |
| Events in quadrant B | 3,496,408 | 561,924 |
| Events in quadrant C | 3,900,882 | 552,642 |
| Events in quadrant D | 3,664,624 | 545,015 |
| Mode SS | |||
|---|---|---|---|
| Quadrant | BADHDUFLAG | Total packets | Discarded packets |
| A | 0 | 134 | 0 |
| B | 0 | 134 | 0 |
| C | 0 | 134 | 0 |
| D | 0 | 134 | 0 |
| Mode M9 | |||
|---|---|---|---|
| Quadrant | BADHDUFLAG | Total packets | Discarded packets |
| A | 0 | 23 | 0 |
| B | 0 | 23 | 0 |
| C | 0 | 23 | 0 |
| D | 0 | 23 | 0 |
| Mode M0 | |||
|---|---|---|---|
| Quadrant | BADHDUFLAG | Total packets | Discarded packets |
| A | 0 | 27946 | 3 |
| B | 0 | 14751 | 2 |
| C | 0 | 15854 | 2 |
| D | 0 | 15205 | 2 |
| Quadrant | Total seconds | Saturated seconds | Saturation percentage |
|---|---|---|---|
| A | 6560 | 628 | 9.573171% |
| B | 6560 | 105 | 1.600610% |
| C | 6560 | 78 | 1.189024% |
| D | 6560 | 173 | 2.637195% |
Noise dominated data is calculated using 1-second bins in cleaned event files. If a bin has >2000 counts, and if more than 50% of those come from <1% of pixels, then it is considered to be noise-dominated and hence unusable.
| Quadrant | # 1 sec bins | Bins with >0 counts | Bins with >2000 counts | High rate bins dominated by noise | Noise dominated (total time) | Noise dominated (detector-on time) | Marked lightcurve |
|---|---|---|---|---|---|---|---|
| A | 8831 | 6561 | 46 | 46 | 0.52% | 0.70% | 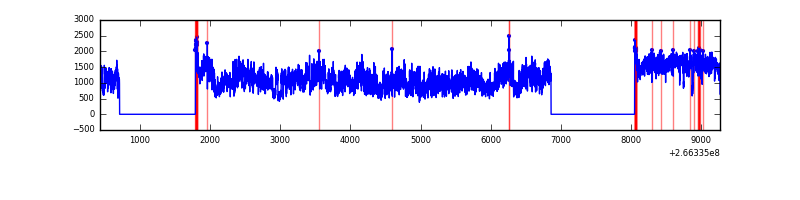 |
| B | 8831 | 6561 | 3 | 3 | 0.03% | 0.05% | 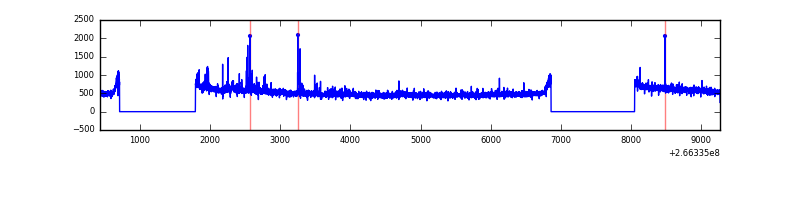 |
| C | 8831 | 6561 | 0 | 0 | 0.00% | 0.00% | 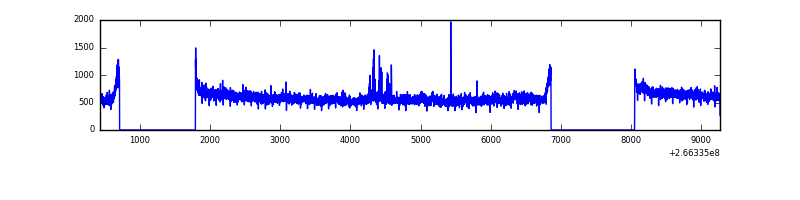 |
| D | 8831 | 6562 | 78 | 78 | 0.88% | 1.19% | 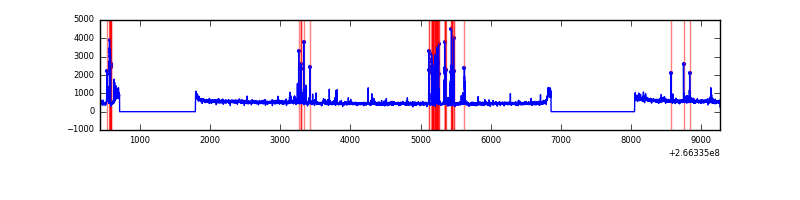 |
Top three noisy pixels from each quadrant. If the there are fewer than three noisy pixels in the level2.evt file, extra rows are filled as -1
| Pixel properties | Quadrant properties | ||||||
|---|---|---|---|---|---|---|---|
| Quadrant | DetID | PixID | Counts | Sigma | Mean | Median | Sigma |
| A | 0 | 23 | 3981360 | 23193.68 | 852 | 836 | 171.6 |
| A | 0 | 226 | 243131 | 1411.8 | 852 | 836 | 171.6 |
| A | 1 | 162 | 124342 | 719.64 | 852 | 836 | 171.6 |
| B | 0 | 197 | 38858 | 227.7 | 867 | 847 | 166.9 |
| B | 0 | 205 | 21617 | 124.42 | 867 | 847 | 166.9 |
| B | 0 | 189 | 21054 | 121.05 | 867 | 847 | 166.9 |
| C | 3 | 233 | 585380 | 2988.72 | 850 | 856 | 195.6 |
| C | 13 | 61 | 6019 | 26.4 | 850 | 856 | 195.6 |
| C | 14 | 234 | 3289 | 12.44 | 850 | 856 | 195.6 |
| D | 10 | 199 | 207138 | 1030.43 | 846 | 827 | 200.2 |
| D | 13 | 122 | 100507 | 497.86 | 846 | 827 | 200.2 |
| D | 2 | 152 | 64218 | 316.61 | 846 | 827 | 200.2 |
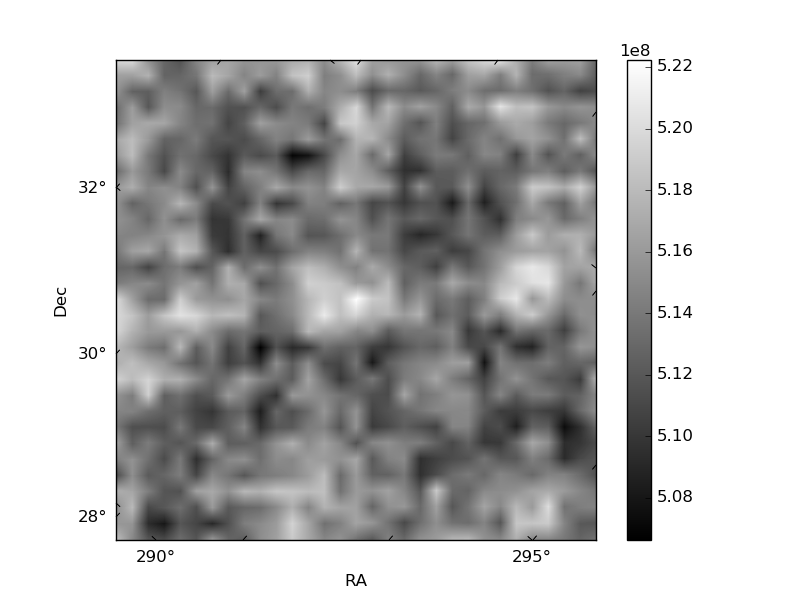
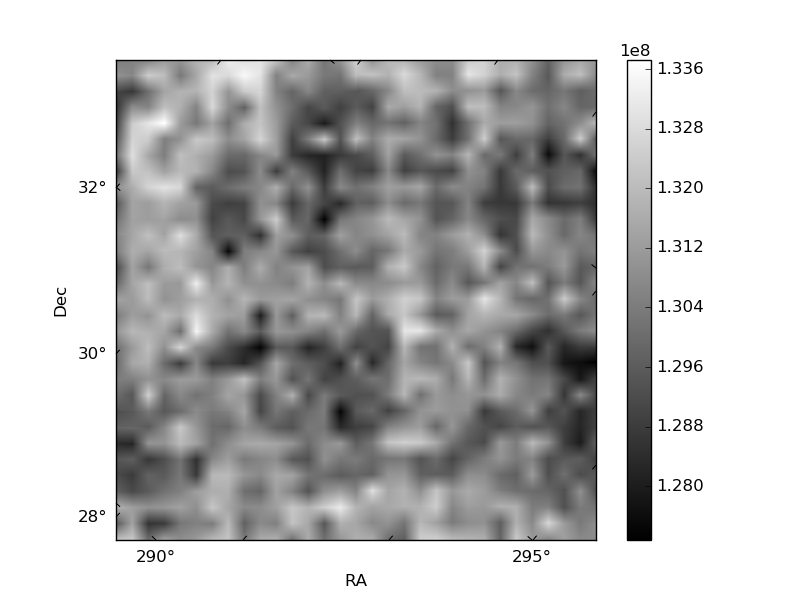
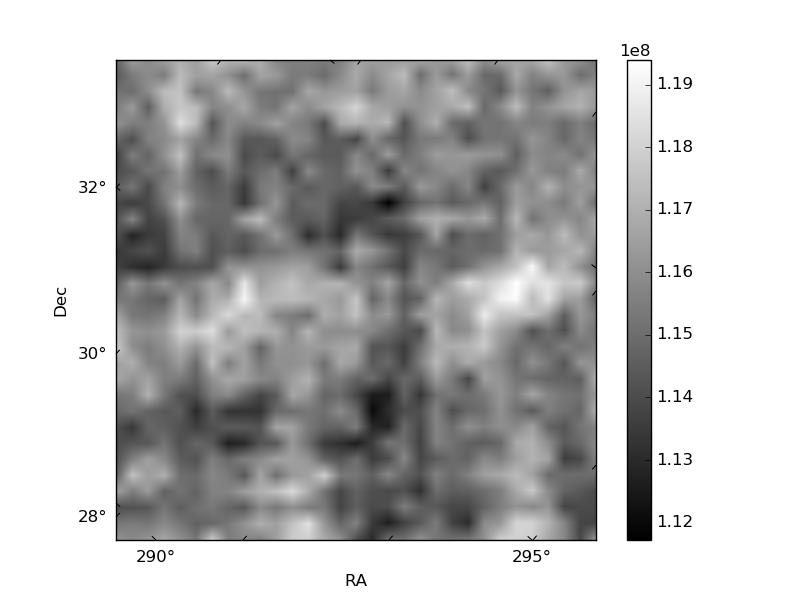
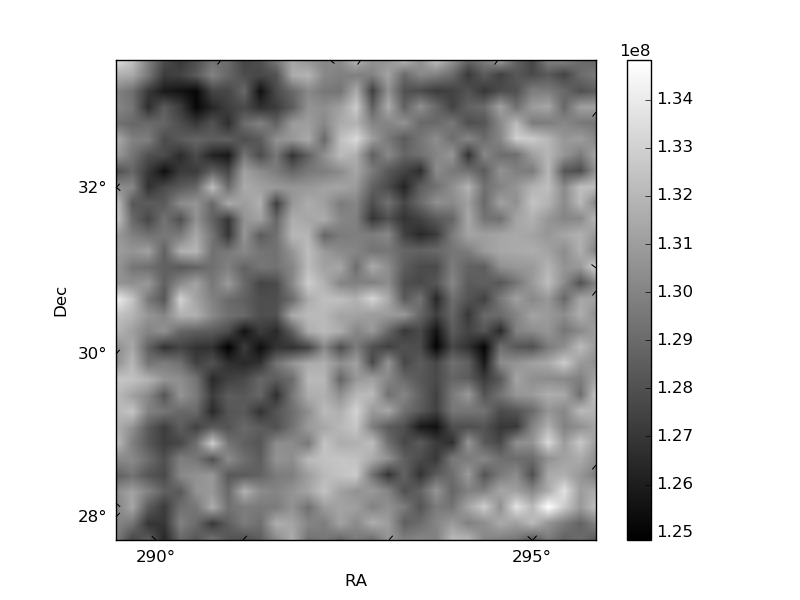
Histogram calculated using DETX and DETY for each event in the final _common_clean file
| Quadrant A | 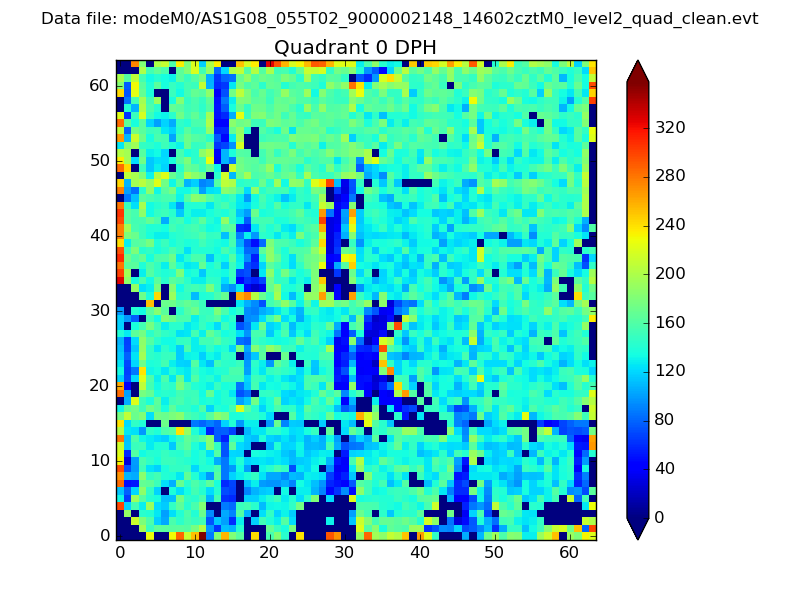 |
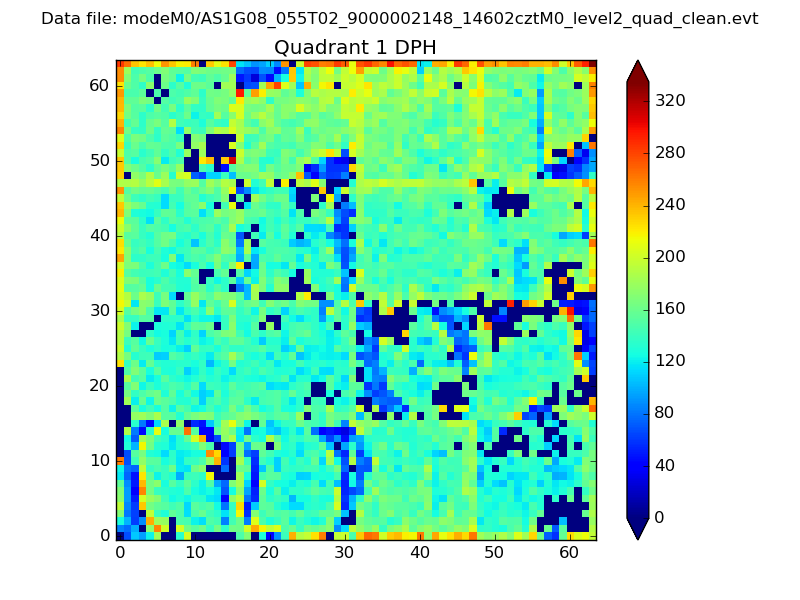 |
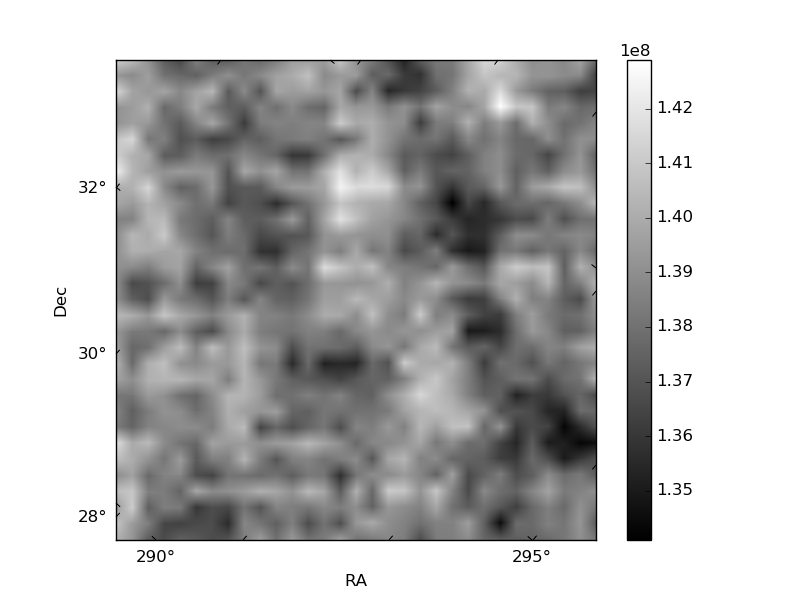
Quadrant B |
|---|---|---|---|
| Quadrant D | 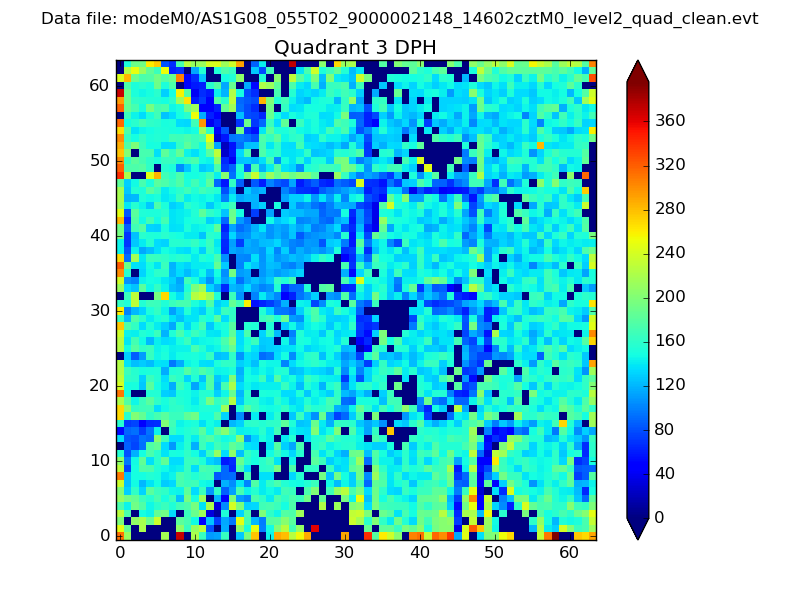 |
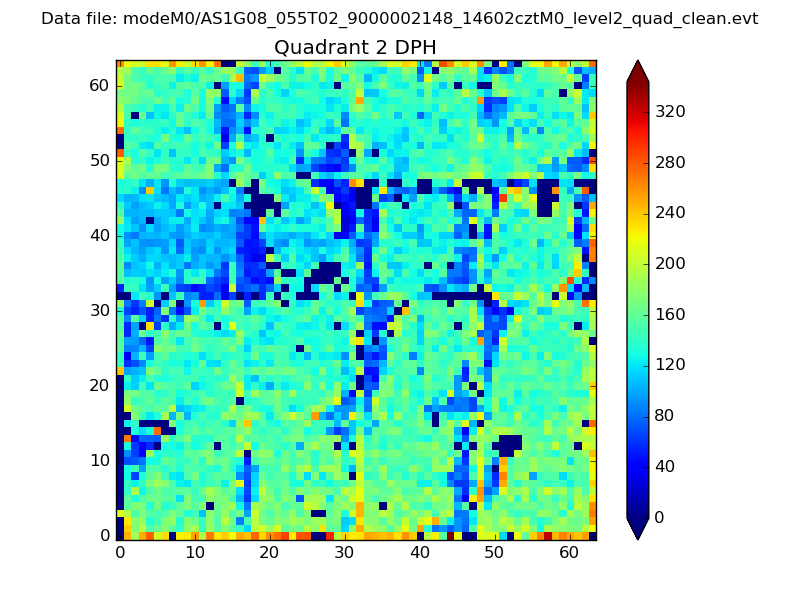 |
Quadrant C |
| Plot type | Count rate plots | Images |
|---|---|---|
| Comparison with Poisson distribution Blue bars denote a histogram of data divided into 1 sec bins. Red curve is a Poisson curve with rate = median count rate of data. |
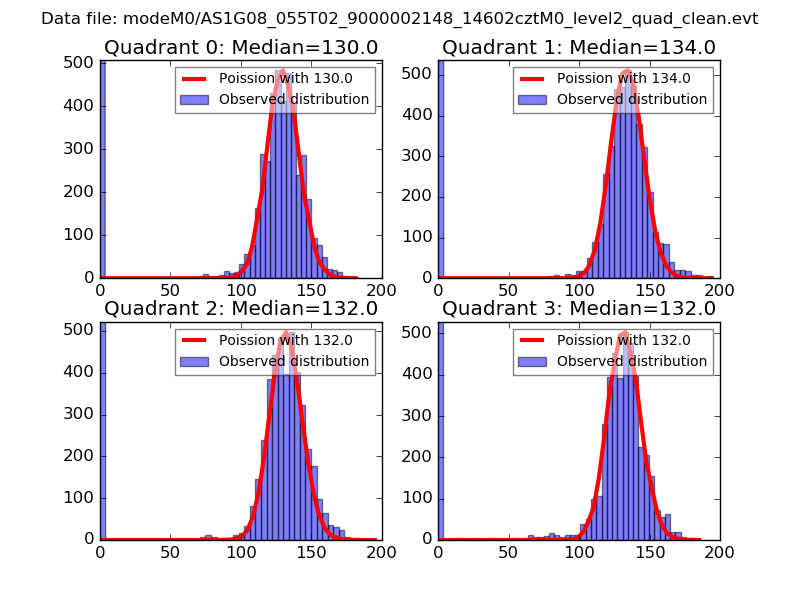 |
 |
| Quadrant-wise count rates Data is divided into 100 sec bins |
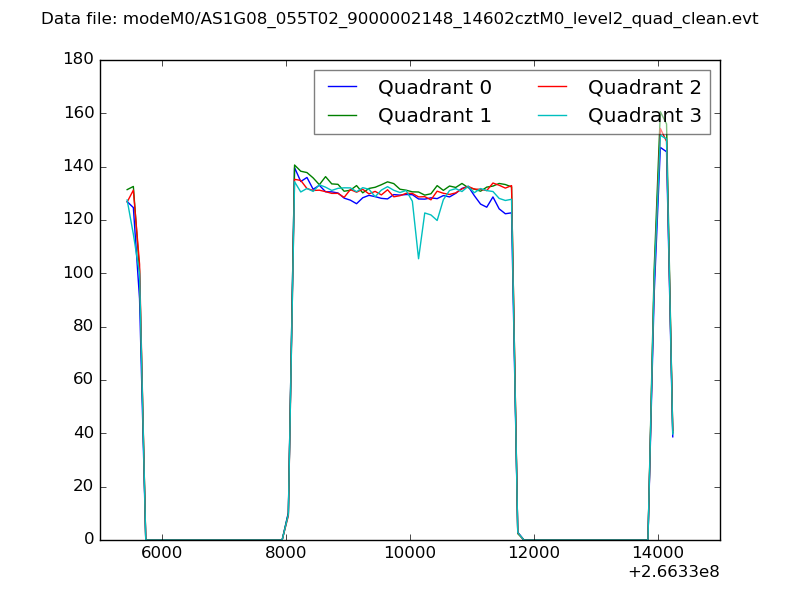 |
|
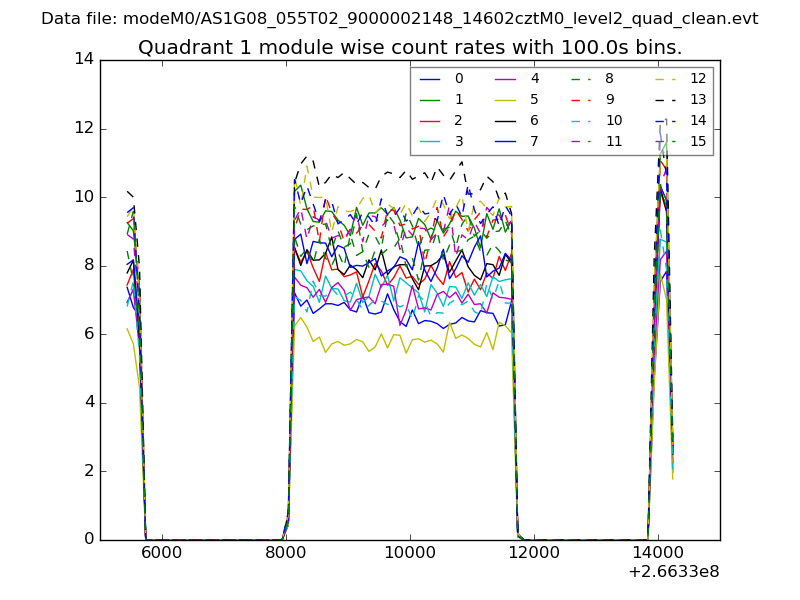
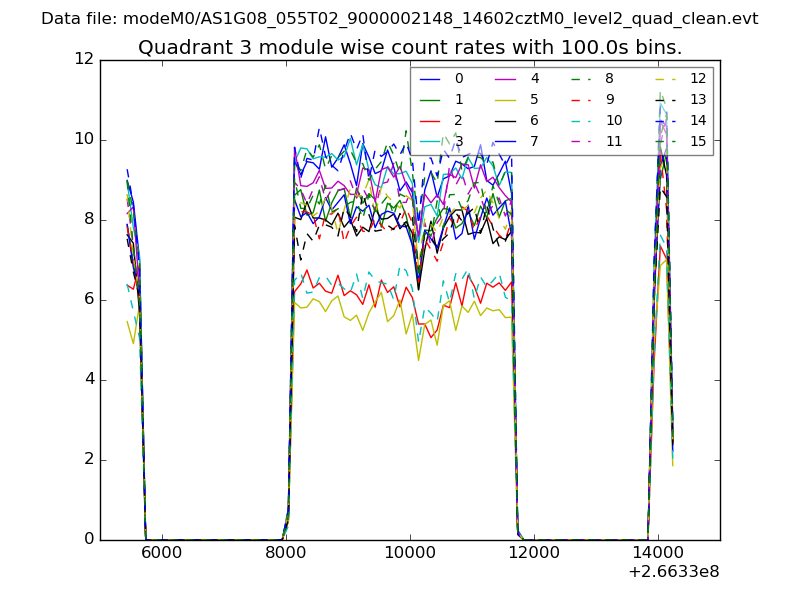
| Module-wise count rates for Quadrant A Data is divided into 100 sec bins |
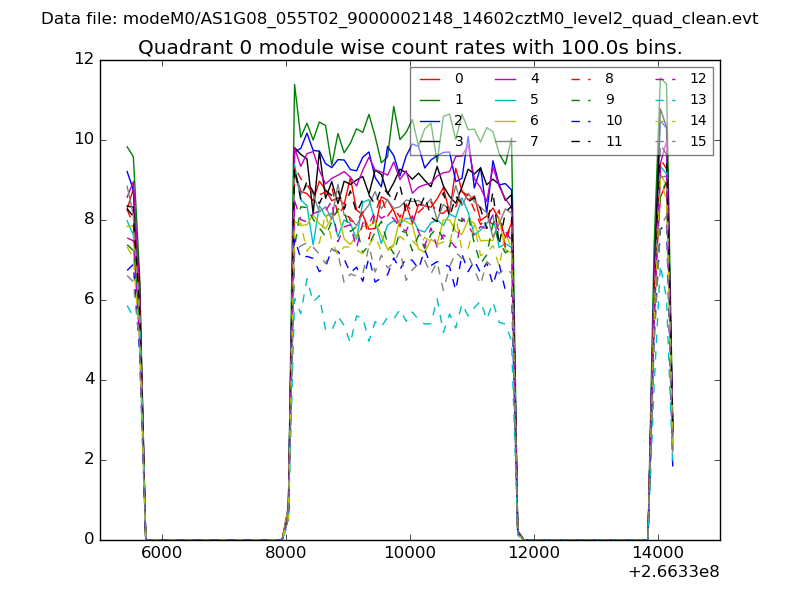 |
 |
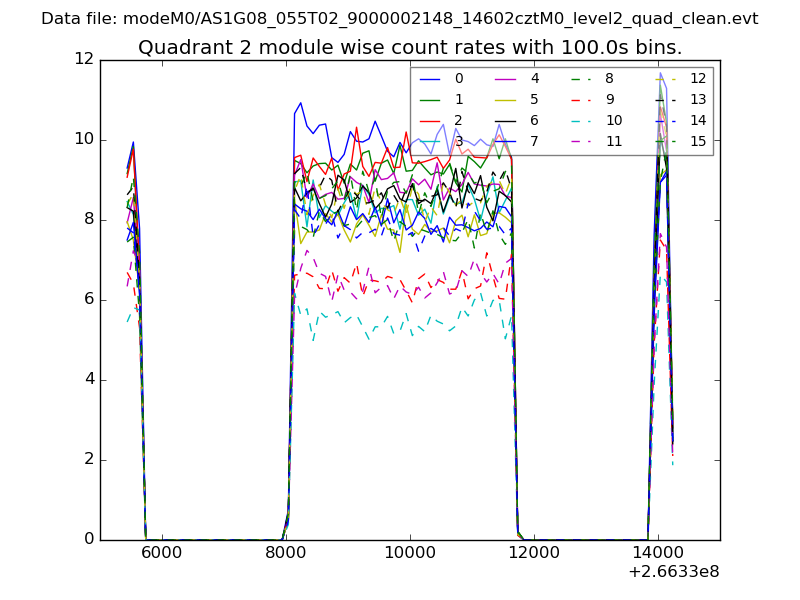
| Module-wise count rates for Quadrant B Data is divided into 100 sec bins |
 |
 |
| Module-wise count rates for Quadrant C Data is divided into 100 sec bins |
 |
 |
| Module-wise count rates for Quadrant D Data is divided into 100 sec bins |
 |
 |
| Parameter | Plot |
|---|---|
| CZT HV Monitor | 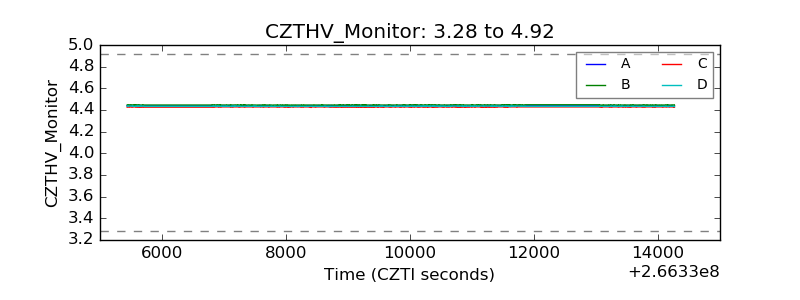 |
| D_VDD | 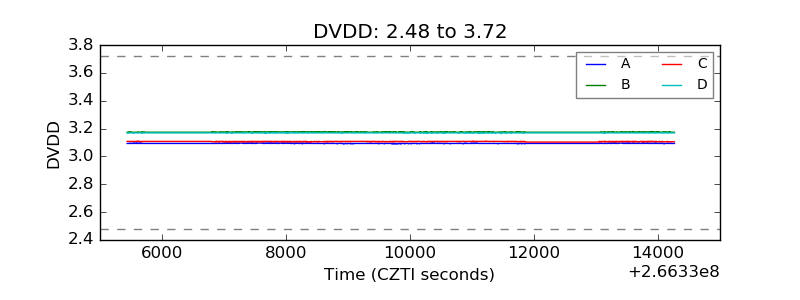 |
| Temperature 1 | 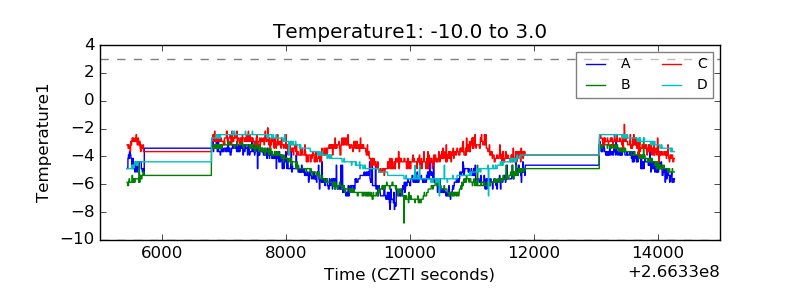 |
| Veto HV Monitor | 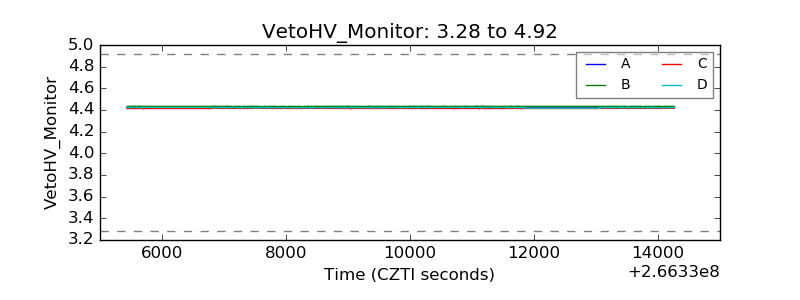 |
| Veto LLD | 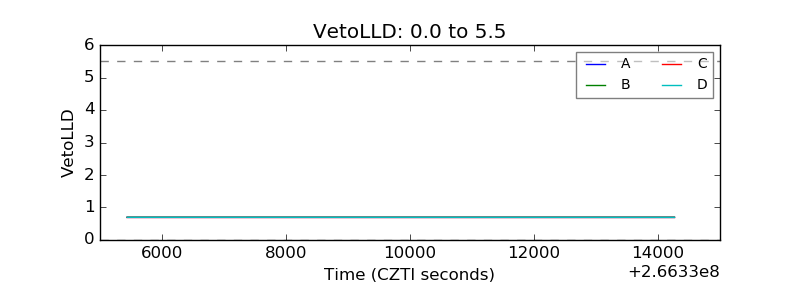 |
| Alpha Counter | 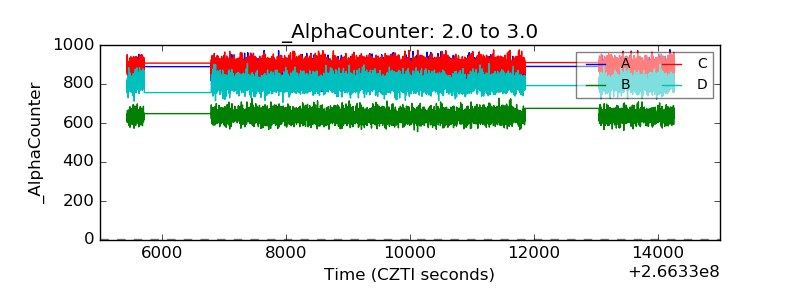 |
| _CPM_Rate | 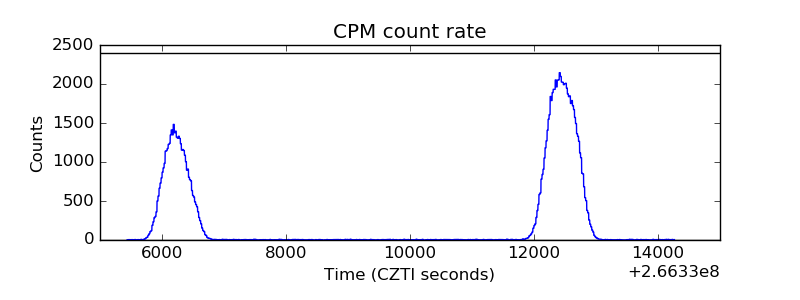 |
| CZT Counter |  |
| +2.5 Volts monitor | 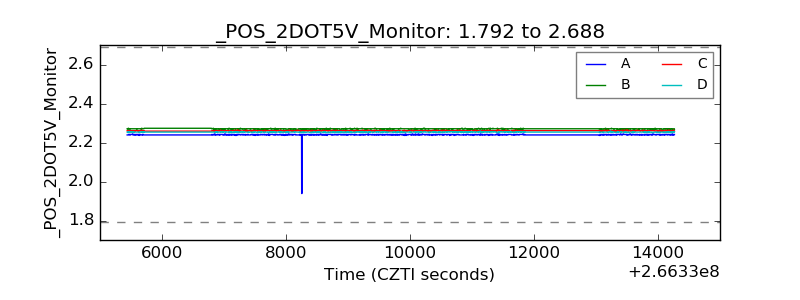 |
| +5 Volts monitor |  |
| _ROLL_ROT | 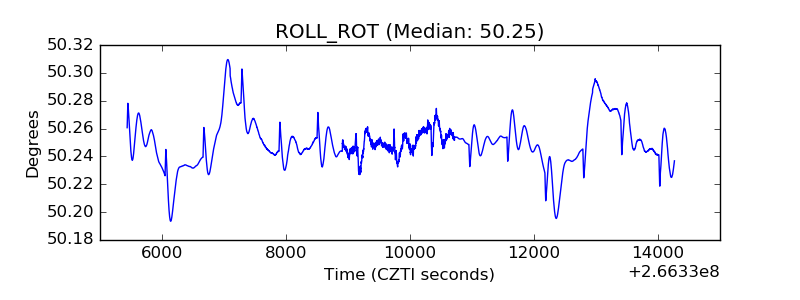 |
| _Roll_DEC | 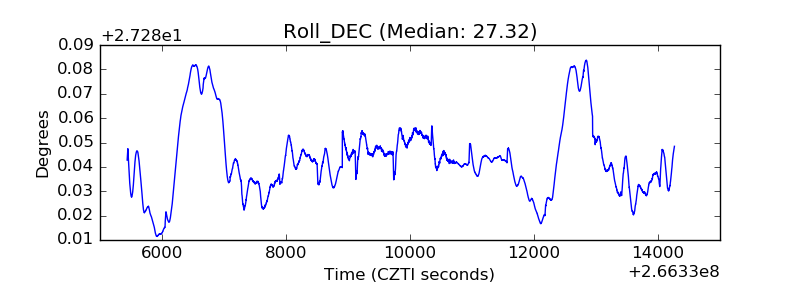 |
| _Roll_RA | 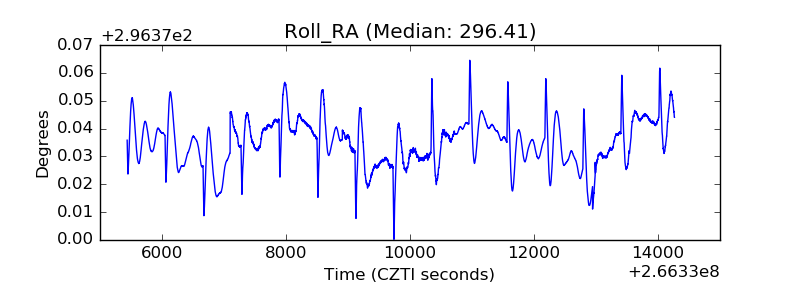 |
| Veto Counter |  |