| Param | Original file | Final file |
|---|---|---|
| Filename | modeM0/AS1G08_055T02_9000002148_14604cztM0_level2.evt | modeM0/AS1G08_055T02_9000002148_14604cztM0_level2_quad_clean.evt |
| Size (bytes) | 703,851,840 | 105,445,440 |
| Size | 671.2 MB | 100.6 MB |
| Events in quadrant A | 9,002,024 | 667,263 |
| Events in quadrant B | 3,432,498 | 724,787 |
| Events in quadrant C | 3,902,751 | 712,689 |
| Events in quadrant D | 4,554,423 | 649,442 |
| Mode SS | |||
|---|---|---|---|
| Quadrant | BADHDUFLAG | Total packets | Discarded packets |
| A | 0 | 130 | 0 |
| B | 0 | 130 | 0 |
| C | 0 | 130 | 0 |
| D | 0 | 130 | 0 |
| Mode M9 | |||
|---|---|---|---|
| Quadrant | BADHDUFLAG | Total packets | Discarded packets |
| A | 0 | 26 | 0 |
| B | 0 | 26 | 0 |
| C | 0 | 26 | 0 |
| D | 0 | 26 | 0 |
| Mode M0 | |||
|---|---|---|---|
| Quadrant | BADHDUFLAG | Total packets | Discarded packets |
| A | 0 | 31134 | 3 |
| B | 0 | 14264 | 2 |
| C | 0 | 15920 | 2 |
| D | 0 | 17610 | 2 |
| Quadrant | Total seconds | Saturated seconds | Saturation percentage |
|---|---|---|---|
| A | 6288 | 1279 | 20.340331% |
| B | 6288 | 119 | 1.892494% |
| C | 6288 | 102 | 1.622137% |
| D | 6288 | 627 | 9.971374% |
Noise dominated data is calculated using 1-second bins in cleaned event files. If a bin has >2000 counts, and if more than 50% of those come from <1% of pixels, then it is considered to be noise-dominated and hence unusable.
| Quadrant | # 1 sec bins | Bins with >0 counts | Bins with >2000 counts | High rate bins dominated by noise | Noise dominated (total time) | Noise dominated (detector-on time) | Marked lightcurve |
|---|---|---|---|---|---|---|---|
| A | 8919 | 6290 | 487 | 487 | 5.46% | 7.74% | 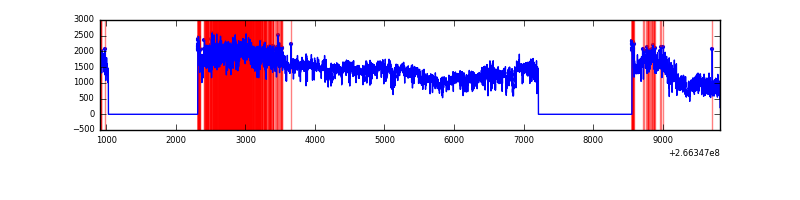 |
| B | 8919 | 6290 | 3 | 3 | 0.03% | 0.05% | 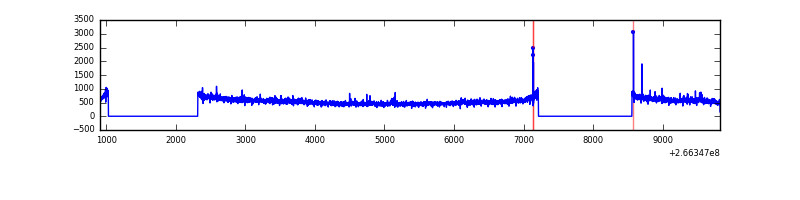 |
| C | 8919 | 6291 | 2 | 2 | 0.02% | 0.03% | 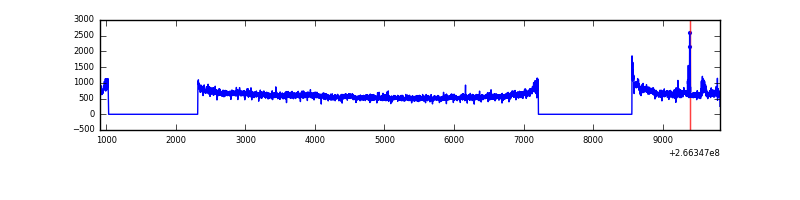 |
| D | 8919 | 6290 | 399 | 399 | 4.47% | 6.34% | 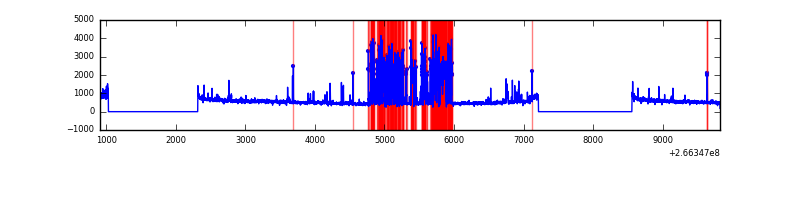 |
Top three noisy pixels from each quadrant. If the there are fewer than three noisy pixels in the level2.evt file, extra rows are filled as -1
| Pixel properties | Quadrant properties | ||||||
|---|---|---|---|---|---|---|---|
| Quadrant | DetID | PixID | Counts | Sigma | Mean | Median | Sigma |
| A | 0 | 23 | 5177490 | 32136.39 | 810 | 797 | 161.1 |
| A | 0 | 226 | 316096 | 1957.34 | 810 | 797 | 161.1 |
| A | 8 | 15 | 159955 | 988.04 | 810 | 797 | 161.1 |
| B | 0 | 205 | 37647 | 229.76 | 853 | 833 | 160.2 |
| B | 12 | 111 | 18511 | 110.33 | 853 | 833 | 160.2 |
| B | 0 | 214 | 18237 | 108.62 | 853 | 833 | 160.2 |
| C | 3 | 233 | 602112 | 3092.15 | 846 | 854 | 194.4 |
| C | 13 | 61 | 6023 | 26.58 | 846 | 854 | 194.4 |
| C | 14 | 225 | 2012 | 5.96 | 846 | 854 | 194.4 |
| D | 10 | 199 | 1343590 | 7181.21 | 803 | 785 | 187.0 |
| D | 2 | 152 | 72349 | 382.72 | 803 | 785 | 187.0 |
| D | 12 | 110 | 56287 | 296.82 | 803 | 785 | 187.0 |
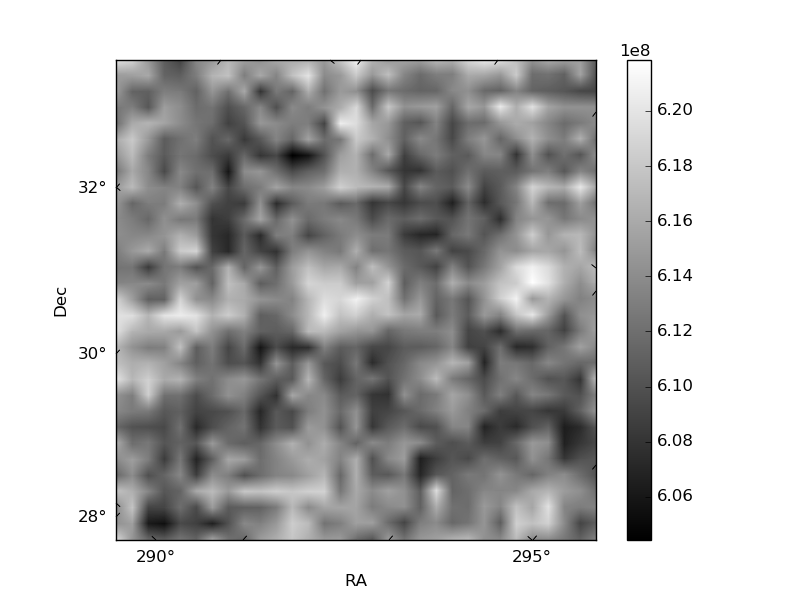
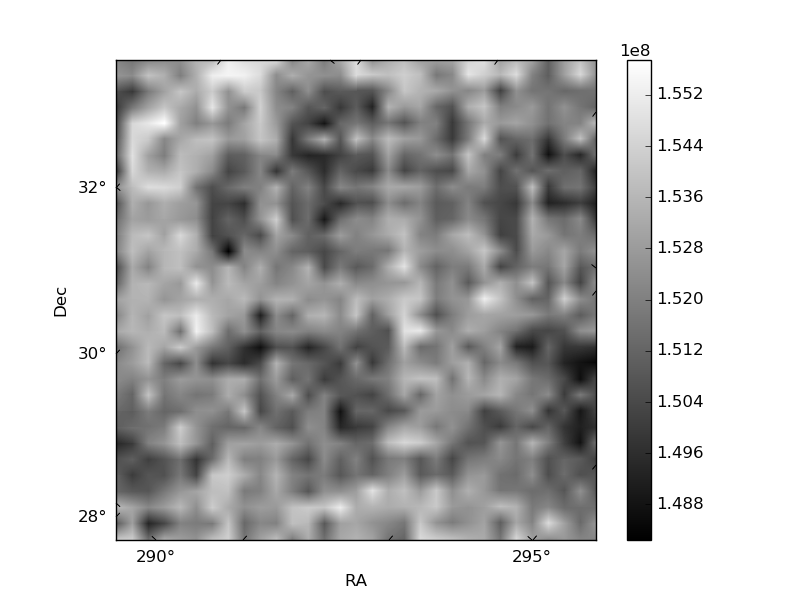
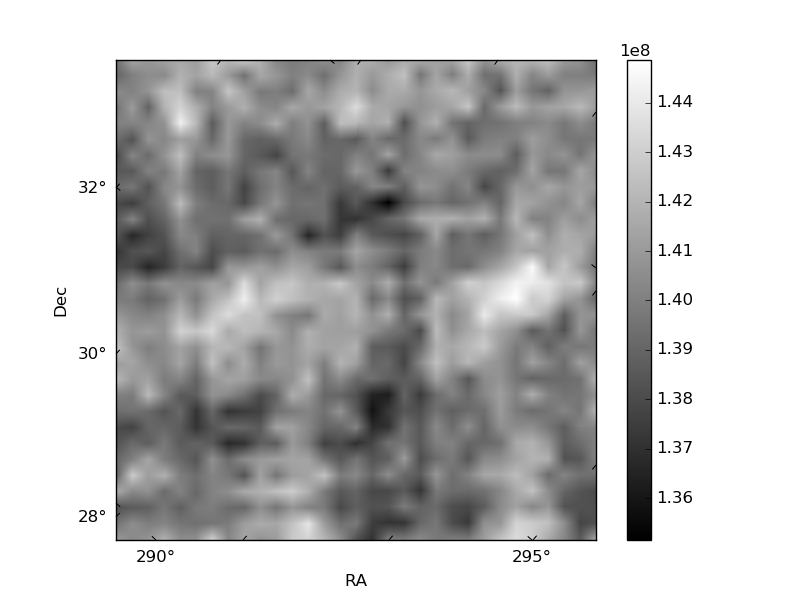
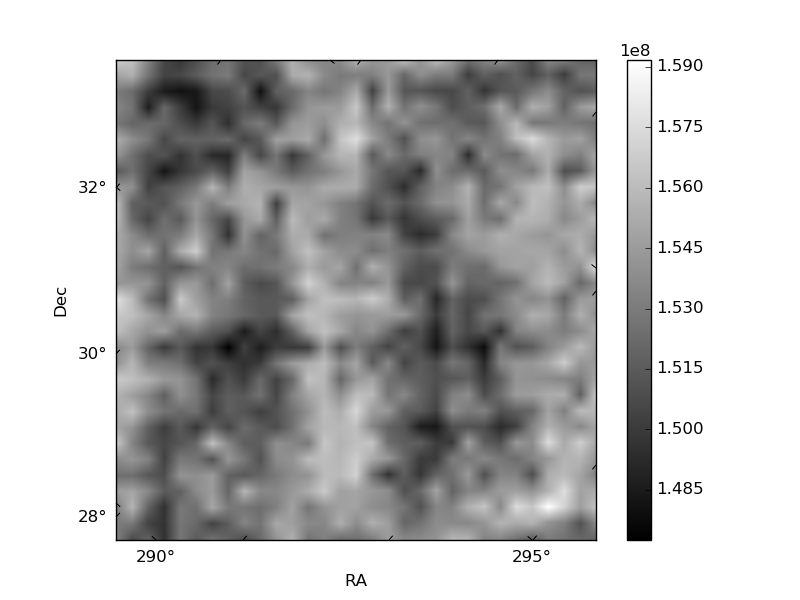
Histogram calculated using DETX and DETY for each event in the final _common_clean file
| Quadrant A | 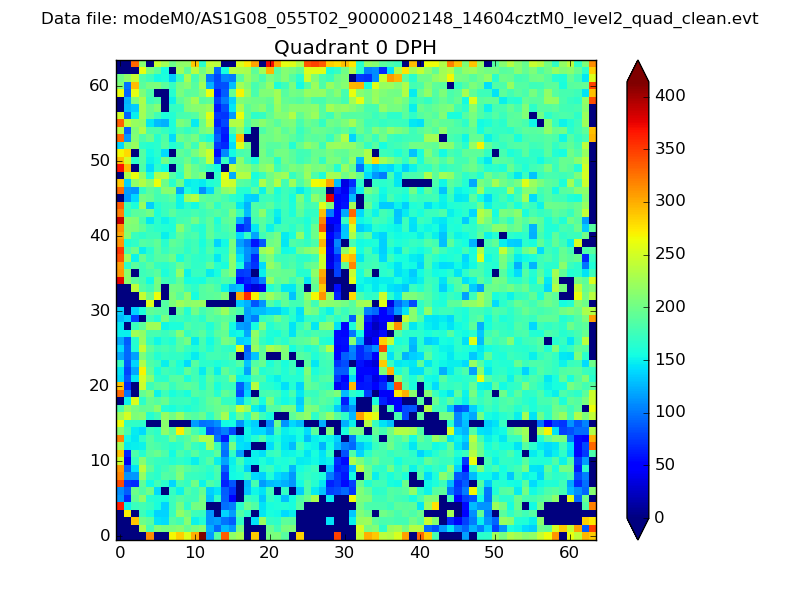 |
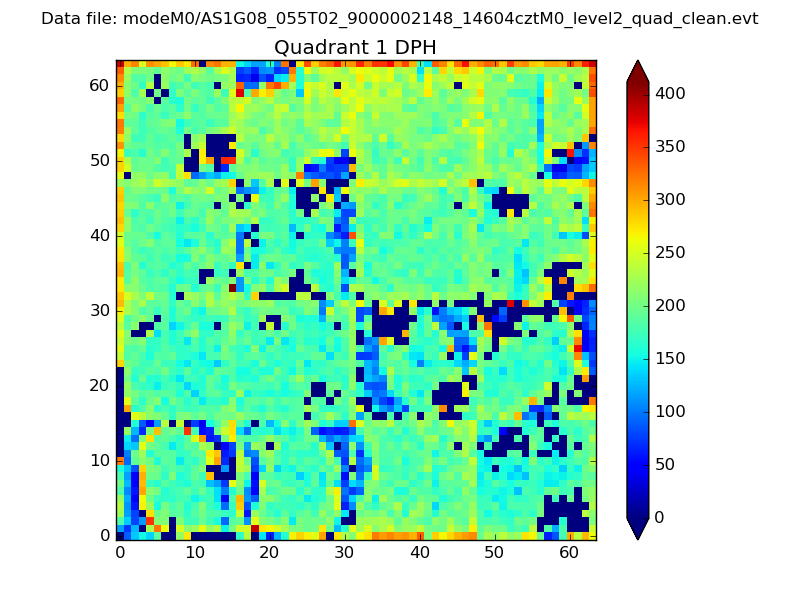 |
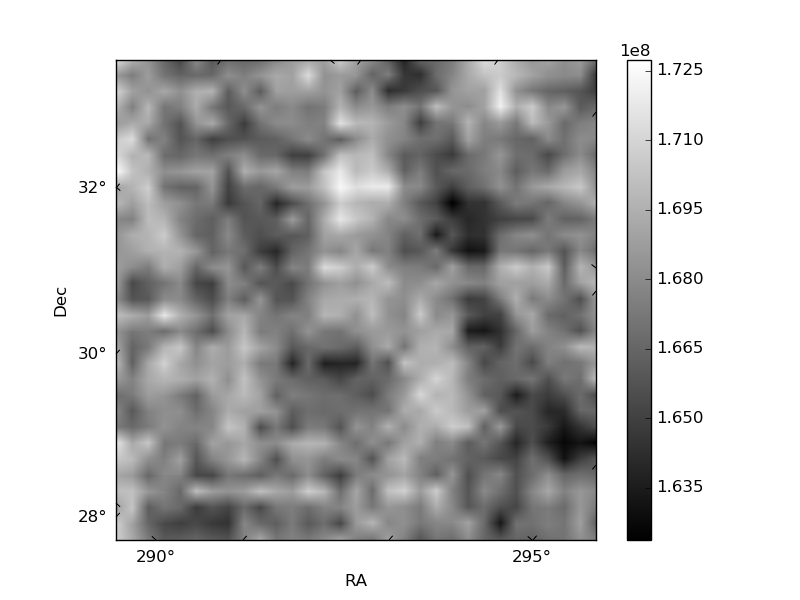
Quadrant B |
|---|---|---|---|
| Quadrant D | 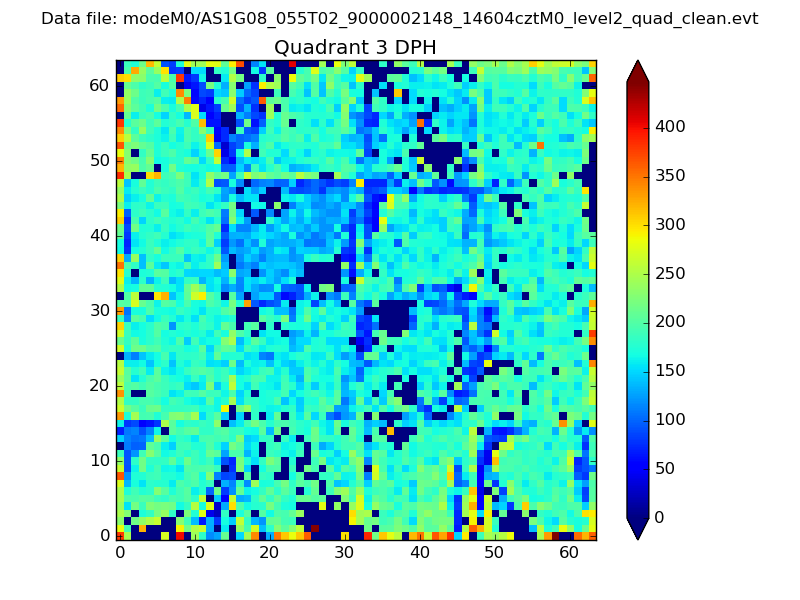 |
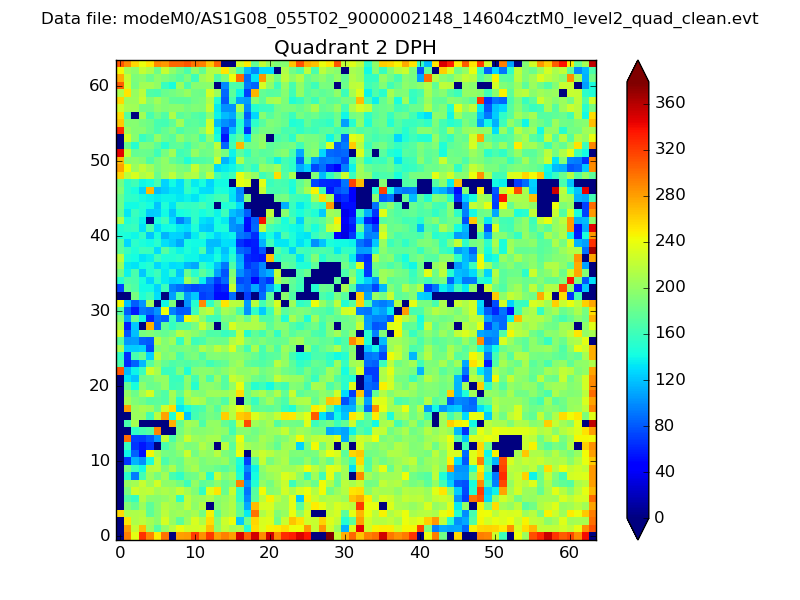 |
Quadrant C |
| Plot type | Count rate plots | Images |
|---|---|---|
| Comparison with Poisson distribution Blue bars denote a histogram of data divided into 1 sec bins. Red curve is a Poisson curve with rate = median count rate of data. |
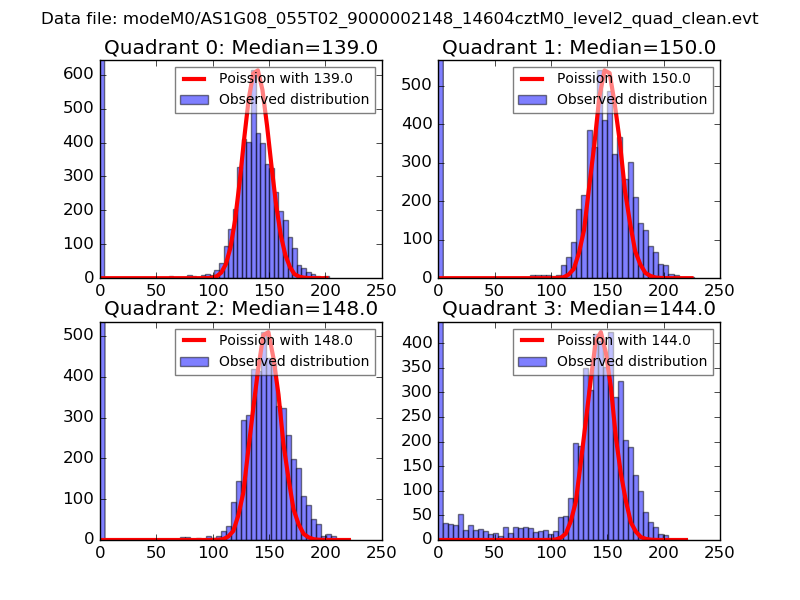 |
 |
| Quadrant-wise count rates Data is divided into 100 sec bins |
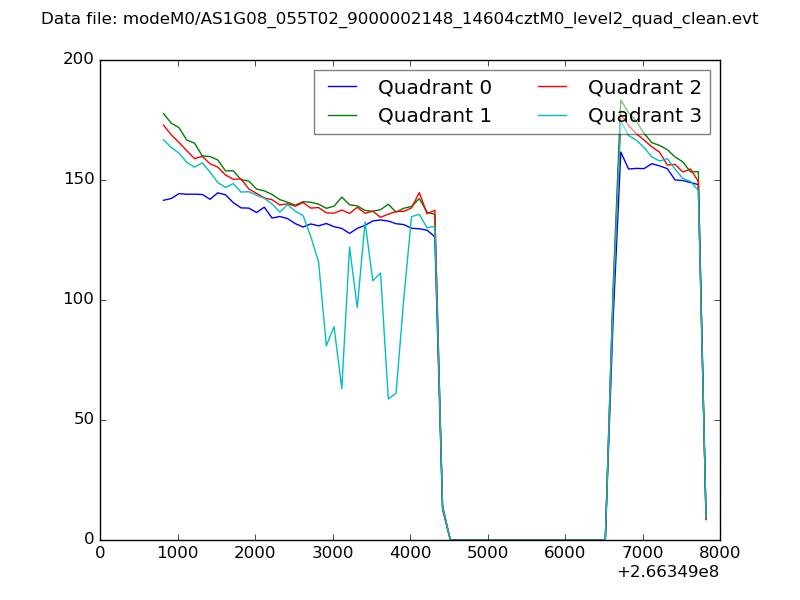 |
|
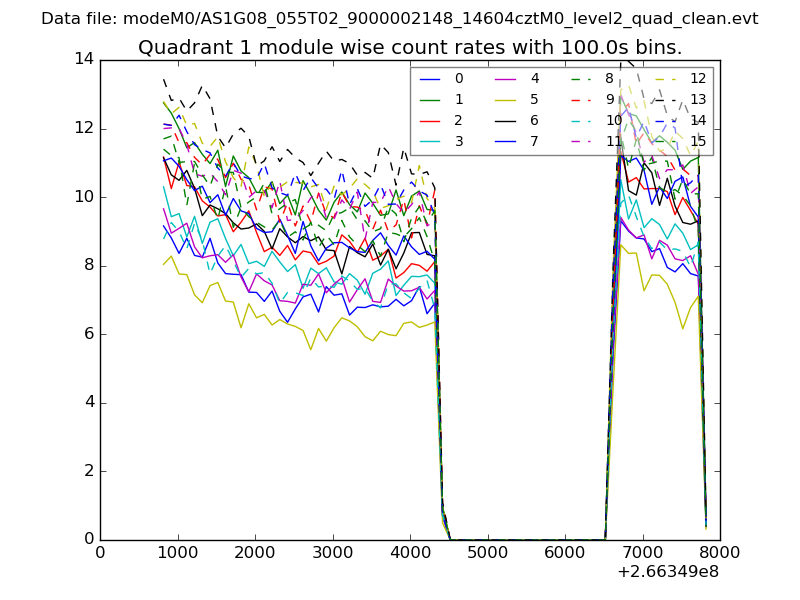
| Module-wise count rates for Quadrant A Data is divided into 100 sec bins |
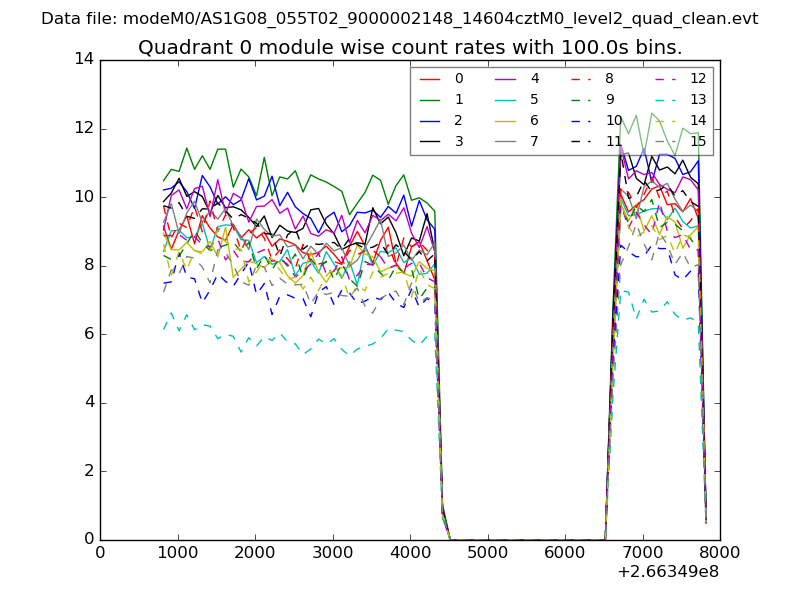 |
 |
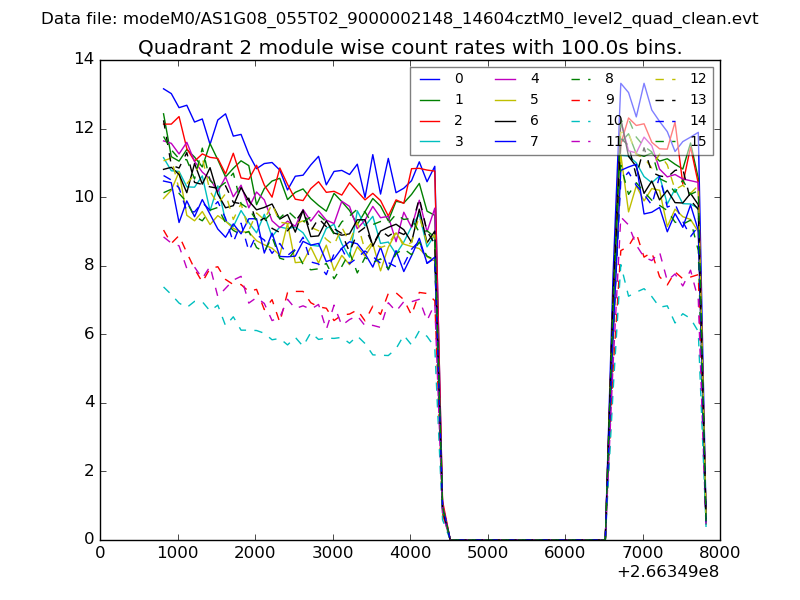
| Module-wise count rates for Quadrant B Data is divided into 100 sec bins |
 |
 |
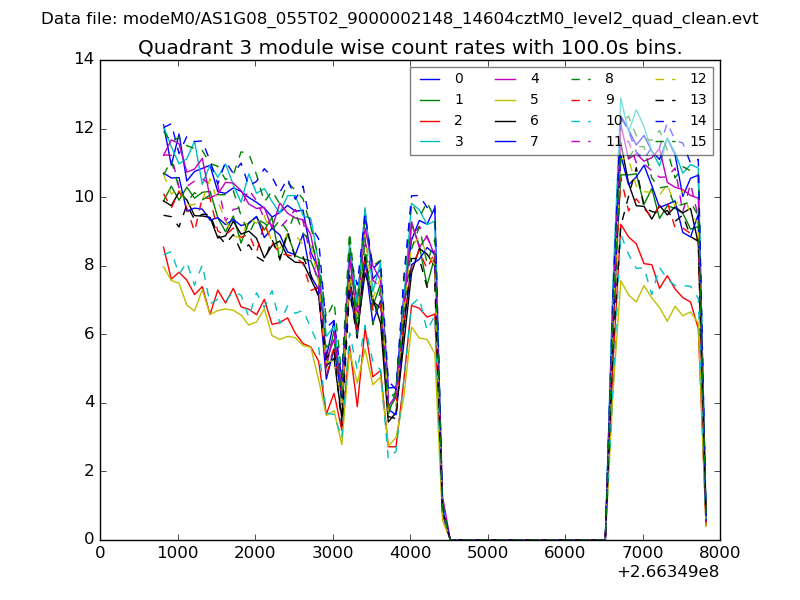
| Module-wise count rates for Quadrant C Data is divided into 100 sec bins |
 |
 |
| Module-wise count rates for Quadrant D Data is divided into 100 sec bins |
 |
 |
| Parameter | Plot |
|---|---|
| CZT HV Monitor | 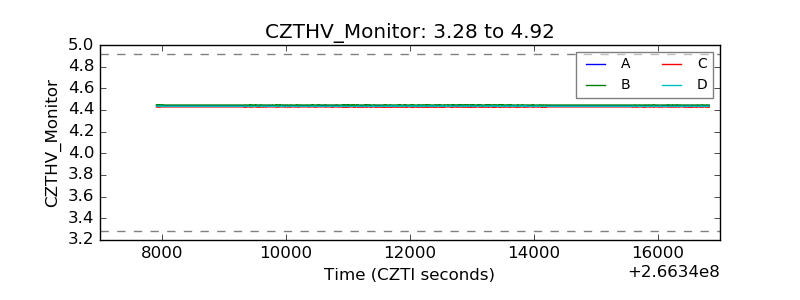 |
| D_VDD | 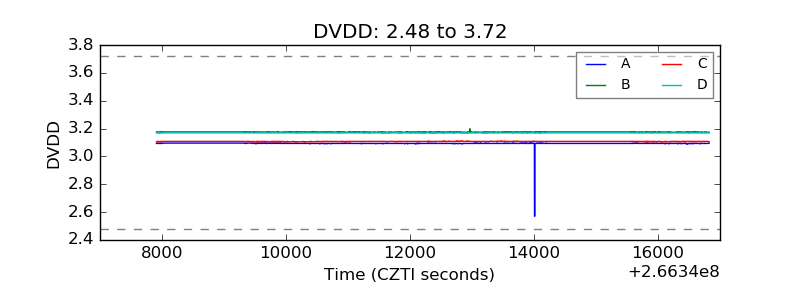 |
| Temperature 1 | 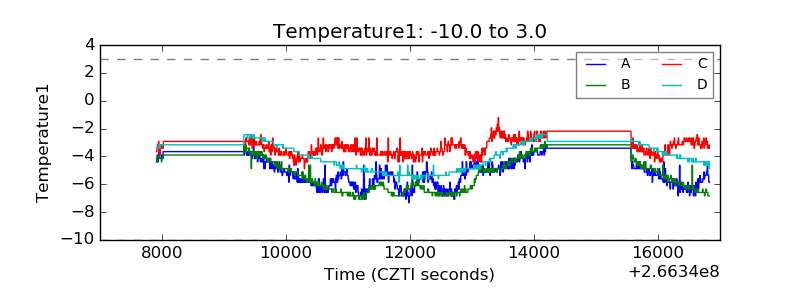 |
| Veto HV Monitor | 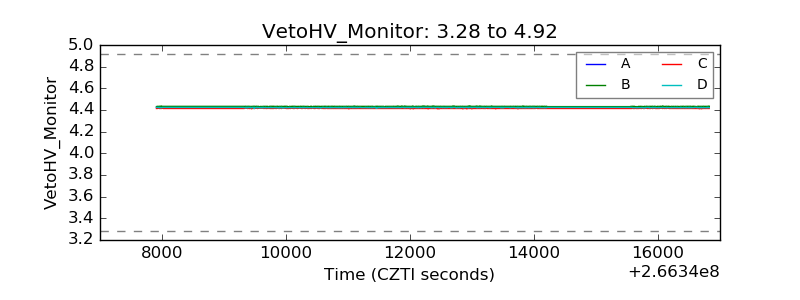 |
| Veto LLD | 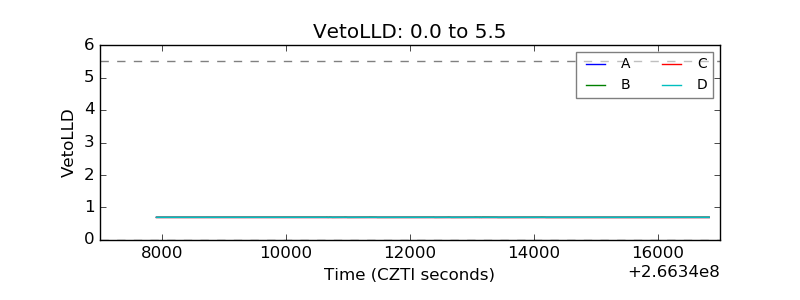 |
| Alpha Counter | 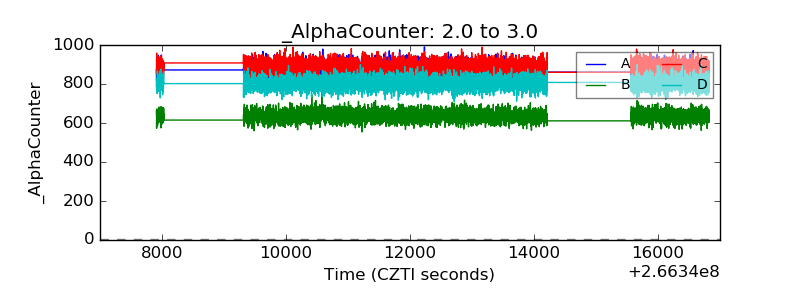 |
| _CPM_Rate |  |
| CZT Counter |  |
| +2.5 Volts monitor |  |
| +5 Volts monitor |  |
| _ROLL_ROT | 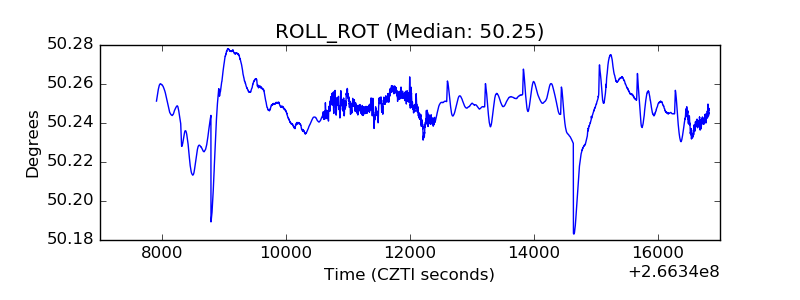 |
| _Roll_DEC | 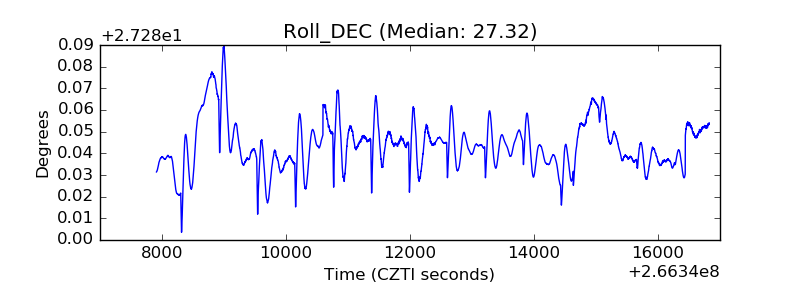 |
| _Roll_RA | 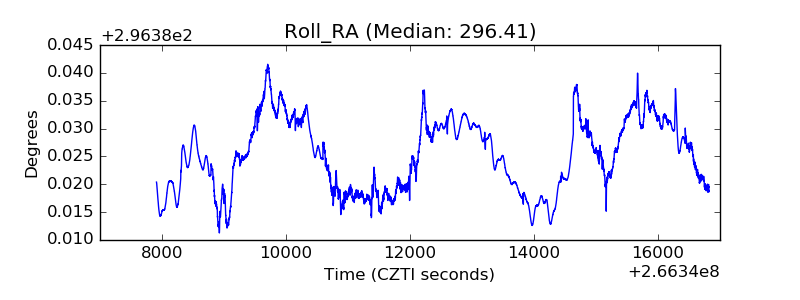 |
| Veto Counter | 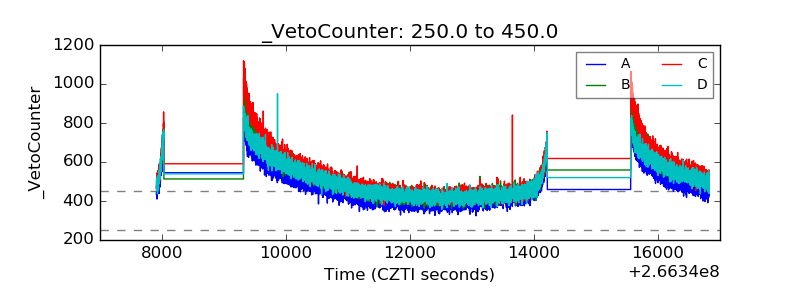 |