| Param | Original file | Final file |
|---|---|---|
| Filename | modeM0/AS1G08_055T02_9000002148_14605cztM0_level2.evt | modeM0/AS1G08_055T02_9000002148_14605cztM0_level2_quad_clean.evt |
| Size (bytes) | 623,658,240 | 106,228,800 |
| Size | 594.8 MB | 101.3 MB |
| Events in quadrant A | 7,177,303 | 677,241 |
| Events in quadrant B | 3,220,910 | 719,367 |
| Events in quadrant C | 3,699,406 | 709,081 |
| Events in quadrant D | 4,377,985 | 685,193 |
| Mode SS | |||
|---|---|---|---|
| Quadrant | BADHDUFLAG | Total packets | Discarded packets |
| A | 0 | 126 | 0 |
| B | 0 | 126 | 0 |
| C | 0 | 126 | 0 |
| D | 0 | 126 | 0 |
| Mode M9 | |||
|---|---|---|---|
| Quadrant | BADHDUFLAG | Total packets | Discarded packets |
| A | 0 | 27 | 0 |
| B | 0 | 27 | 0 |
| C | 0 | 27 | 0 |
| D | 0 | 27 | 0 |
| Mode M0 | |||
|---|---|---|---|
| Quadrant | BADHDUFLAG | Total packets | Discarded packets |
| A | 0 | 25534 | 3 |
| B | 0 | 13517 | 2 |
| C | 0 | 15231 | 2 |
| D | 0 | 16968 | 2 |
| Quadrant | Total seconds | Saturated seconds | Saturation percentage |
|---|---|---|---|
| A | 6105 | 413 | 6.764947% |
| B | 6105 | 57 | 0.933661% |
| C | 6105 | 53 | 0.868141% |
| D | 6105 | 176 | 2.882883% |
Noise dominated data is calculated using 1-second bins in cleaned event files. If a bin has >2000 counts, and if more than 50% of those come from <1% of pixels, then it is considered to be noise-dominated and hence unusable.
| Quadrant | # 1 sec bins | Bins with >0 counts | Bins with >2000 counts | High rate bins dominated by noise | Noise dominated (total time) | Noise dominated (detector-on time) | Marked lightcurve |
|---|---|---|---|---|---|---|---|
| A | 8791 | 6108 | 40 | 40 | 0.46% | 0.65% | 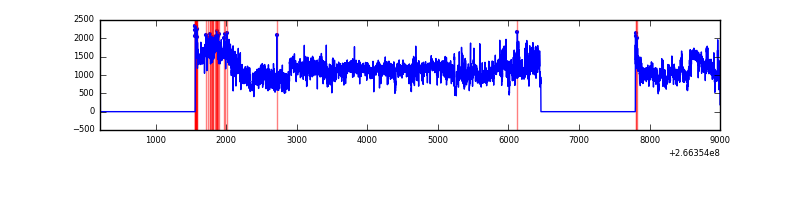 |
| B | 8791 | 6108 | 3 | 3 | 0.03% | 0.05% | 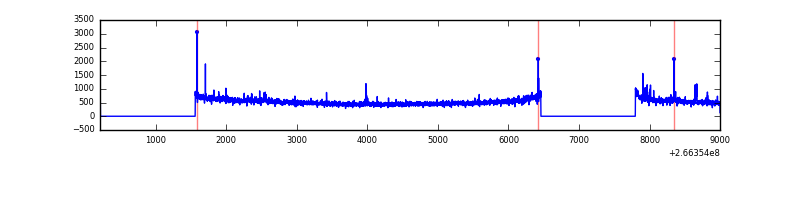 |
| C | 8791 | 6108 | 2 | 2 | 0.02% | 0.03% | 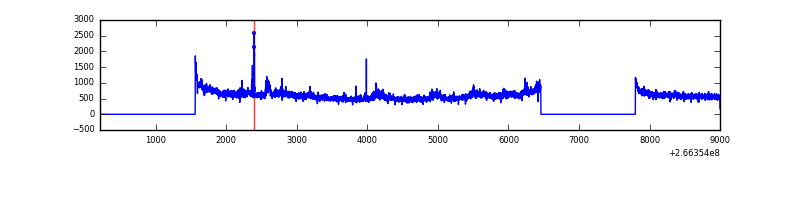 |
| D | 8791 | 6108 | 261 | 261 | 2.97% | 4.27% | 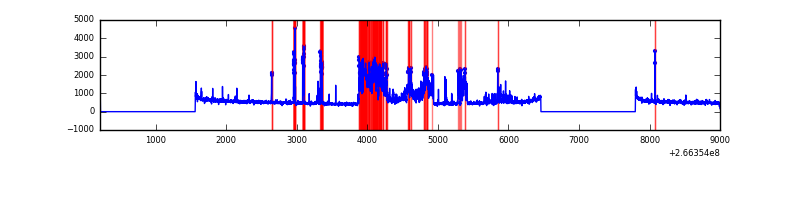 |
Top three noisy pixels from each quadrant. If the there are fewer than three noisy pixels in the level2.evt file, extra rows are filled as -1
| Pixel properties | Quadrant properties | ||||||
|---|---|---|---|---|---|---|---|
| Quadrant | DetID | PixID | Counts | Sigma | Mean | Median | Sigma |
| A | 0 | 23 | 3637280 | 23434.15 | 778 | 764 | 155.2 |
| A | 0 | 226 | 221110 | 1419.94 | 778 | 764 | 155.2 |
| A | 1 | 162 | 144502 | 926.26 | 778 | 764 | 155.2 |
| B | 0 | 205 | 34052 | 223.29 | 799 | 782 | 149.0 |
| B | 12 | 111 | 17723 | 113.7 | 799 | 782 | 149.0 |
| B | 11 | 111 | 14910 | 94.82 | 799 | 782 | 149.0 |
| C | 3 | 233 | 631023 | 3495.1 | 787 | 793 | 180.3 |
| C | 13 | 61 | 5721 | 27.33 | 787 | 793 | 180.3 |
| C | 14 | 234 | 3131 | 12.97 | 787 | 793 | 180.3 |
| D | 12 | 110 | 1184728 | 6519.72 | 777 | 761 | 181.6 |
| D | 10 | 199 | 176974 | 970.35 | 777 | 761 | 181.6 |
| D | 2 | 234 | 25471 | 136.07 | 777 | 761 | 181.6 |
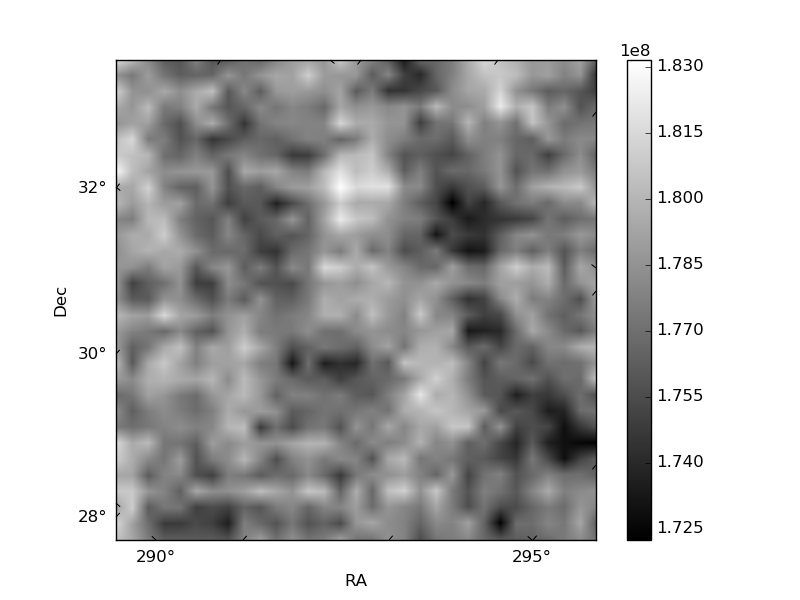
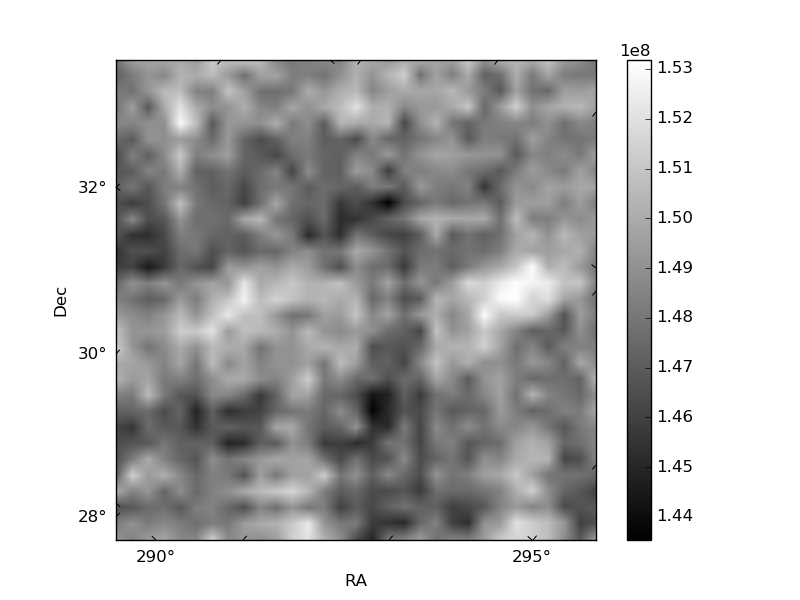
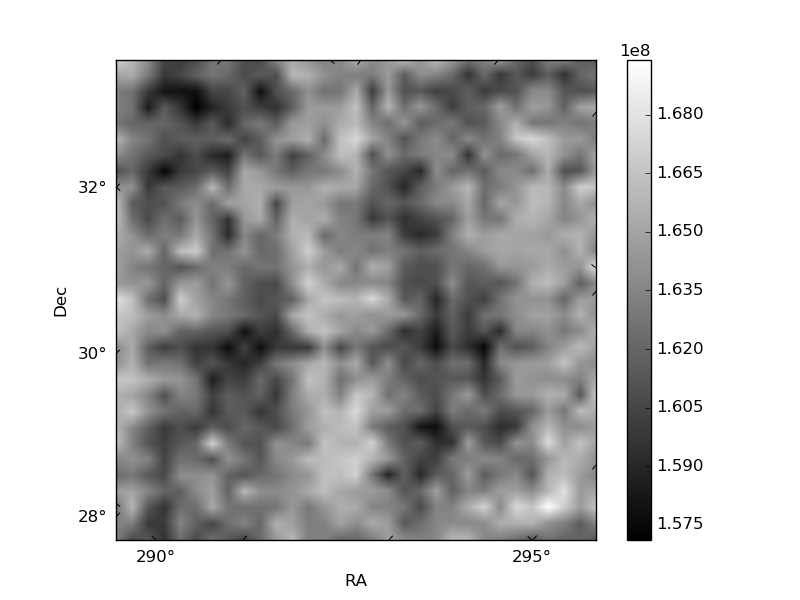
Histogram calculated using DETX and DETY for each event in the final _common_clean file
| Quadrant A | 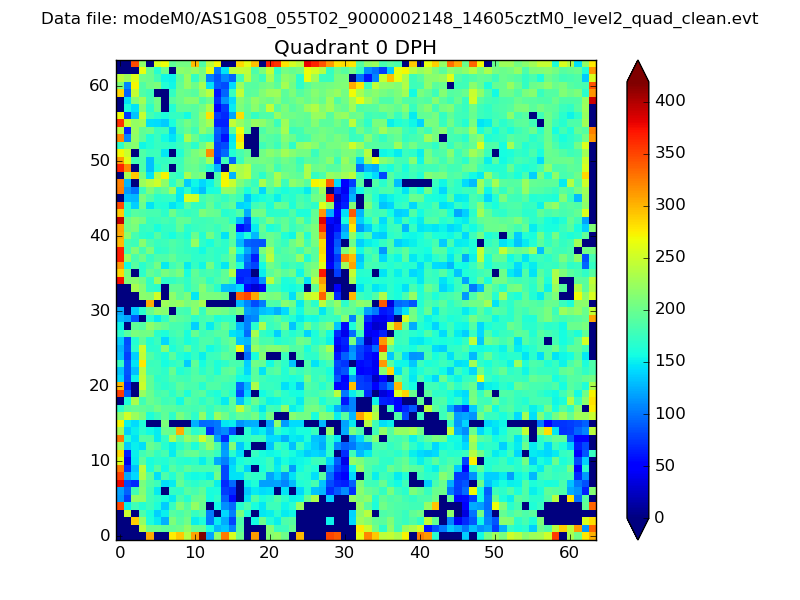 |
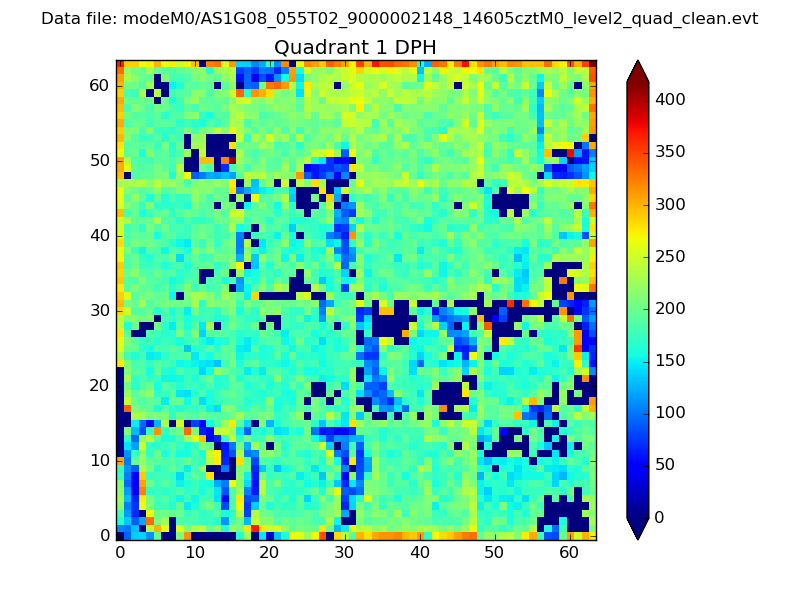 |
Quadrant B |
|---|---|---|---|
| Quadrant D | 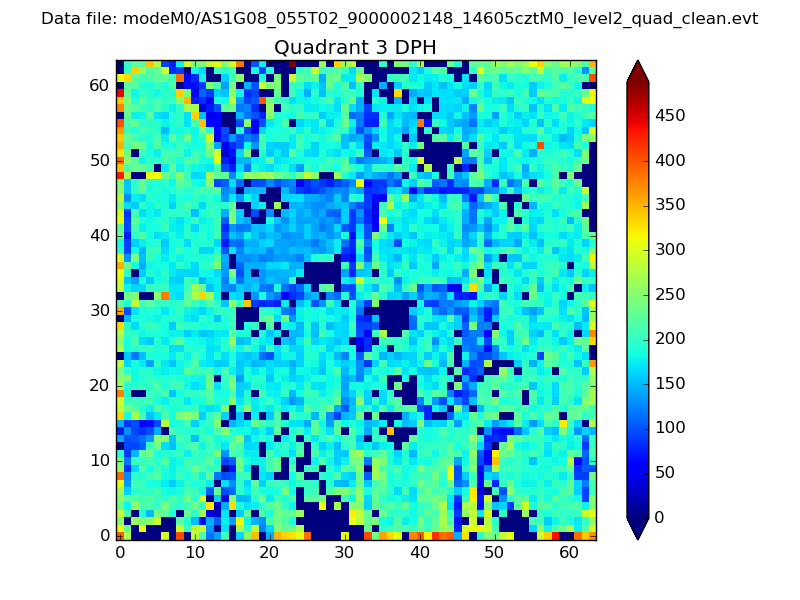 |
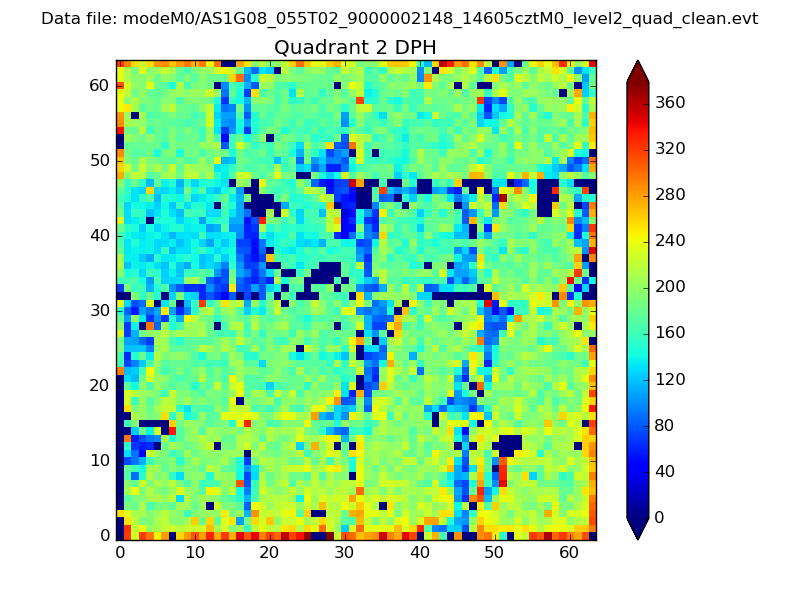 |
Quadrant C |
| Plot type | Count rate plots | Images |
|---|---|---|
| Comparison with Poisson distribution Blue bars denote a histogram of data divided into 1 sec bins. Red curve is a Poisson curve with rate = median count rate of data. |
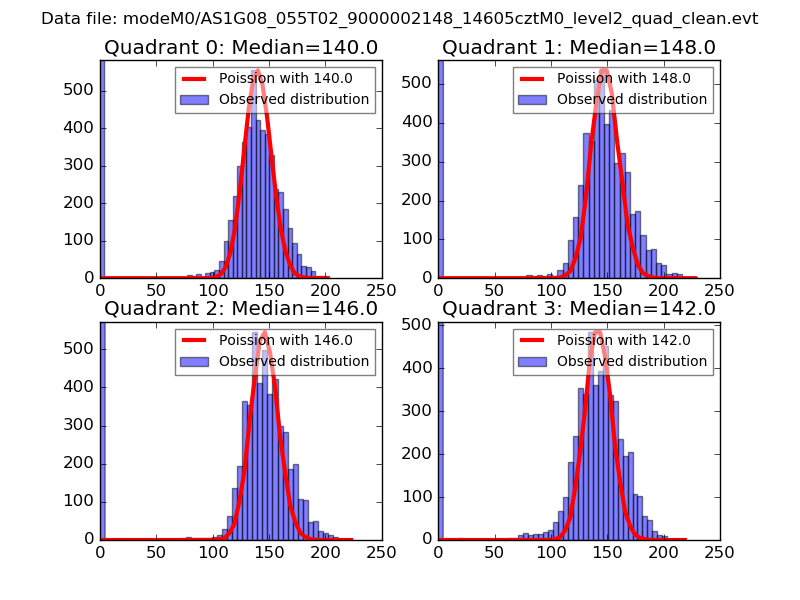 |
 |
| Quadrant-wise count rates Data is divided into 100 sec bins |
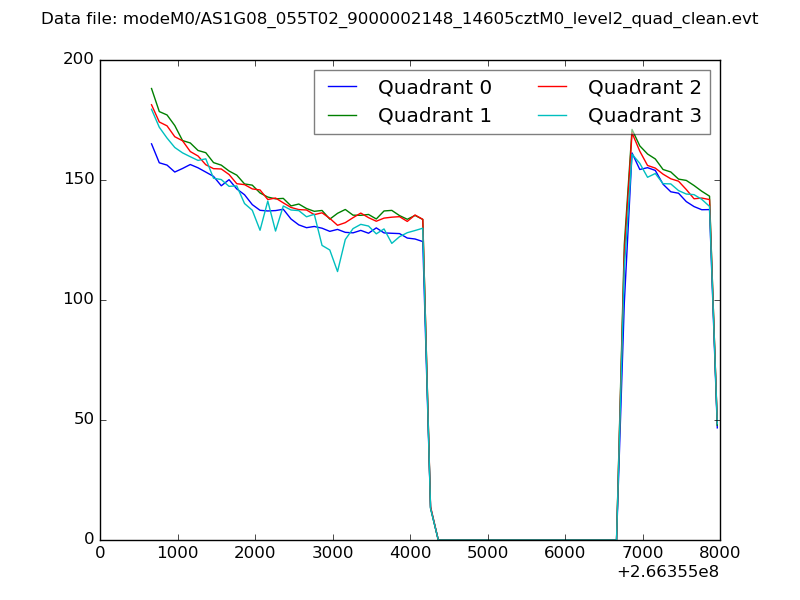 |
|
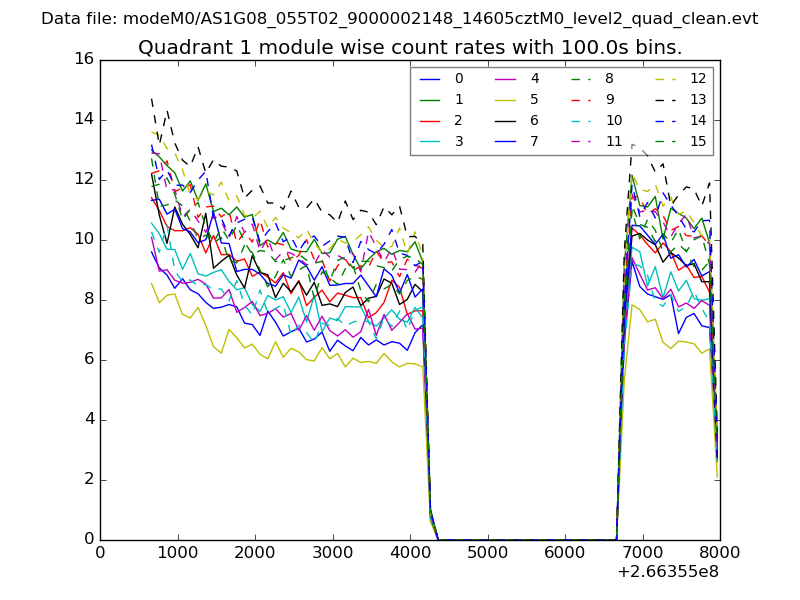
| Module-wise count rates for Quadrant A Data is divided into 100 sec bins |
 |
 |
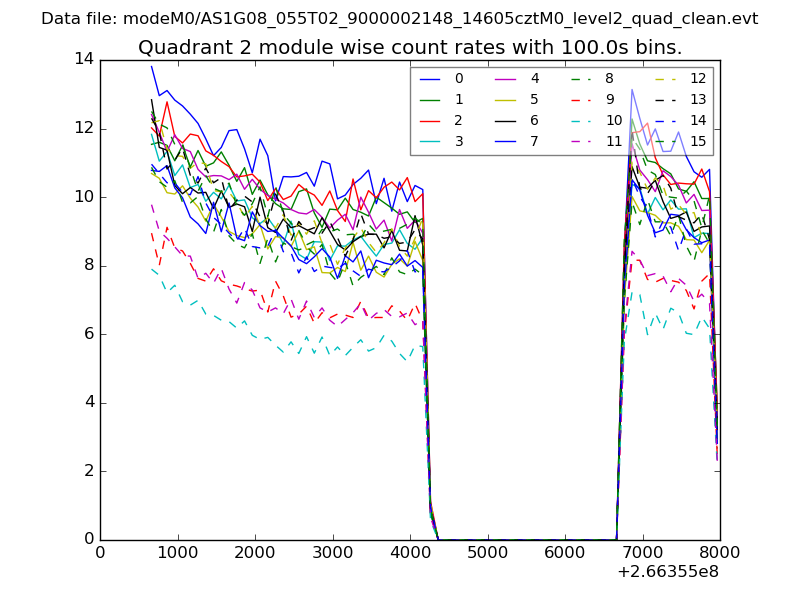
| Module-wise count rates for Quadrant B Data is divided into 100 sec bins |
 |
 |
| Module-wise count rates for Quadrant C Data is divided into 100 sec bins |
 |
 |
| Module-wise count rates for Quadrant D Data is divided into 100 sec bins |
 |
 |
| Parameter | Plot |
|---|---|
| CZT HV Monitor | 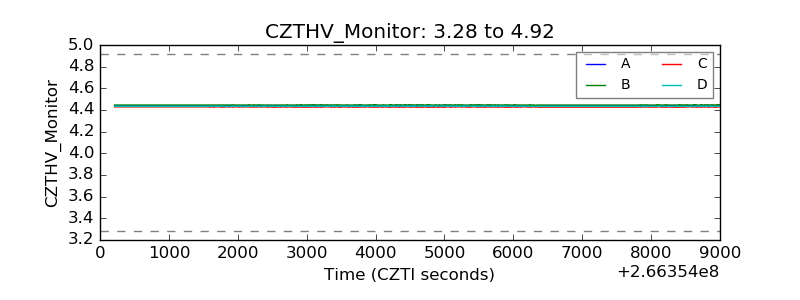 |
| D_VDD | 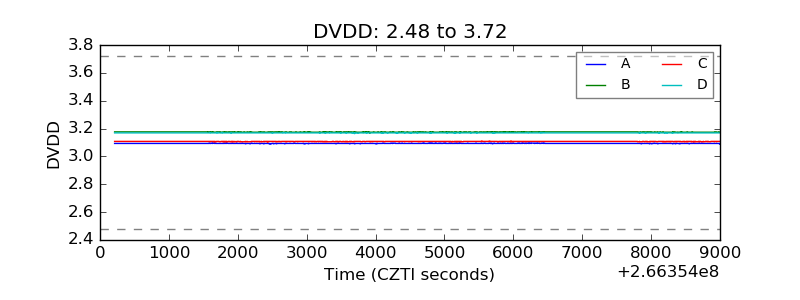 |
| Temperature 1 | 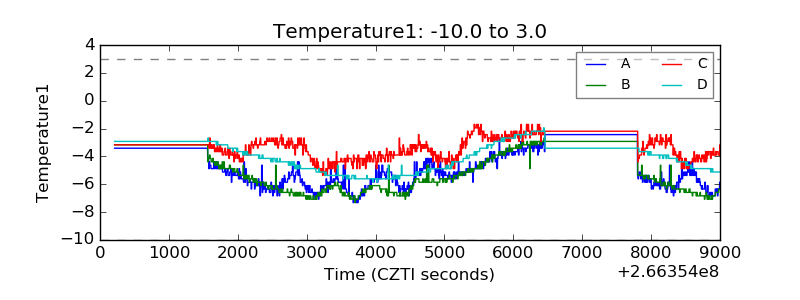 |
| Veto HV Monitor | 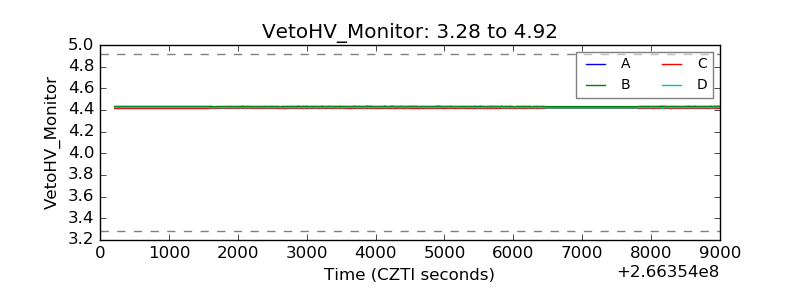 |
| Veto LLD | 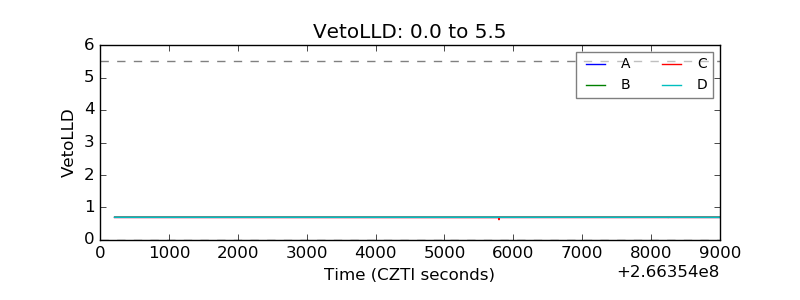 |
| Alpha Counter | 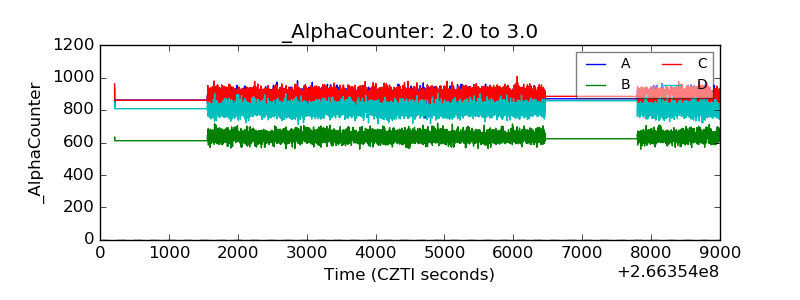 |
| _CPM_Rate | 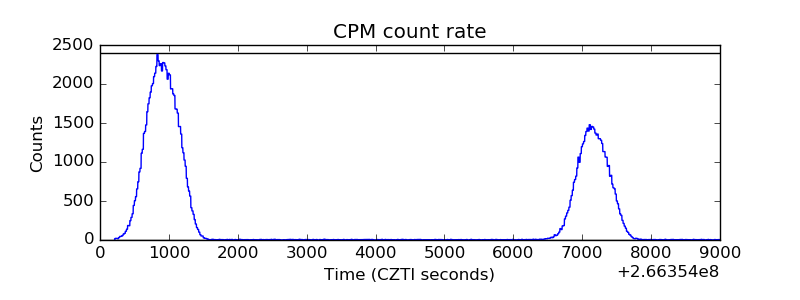 |
| CZT Counter | 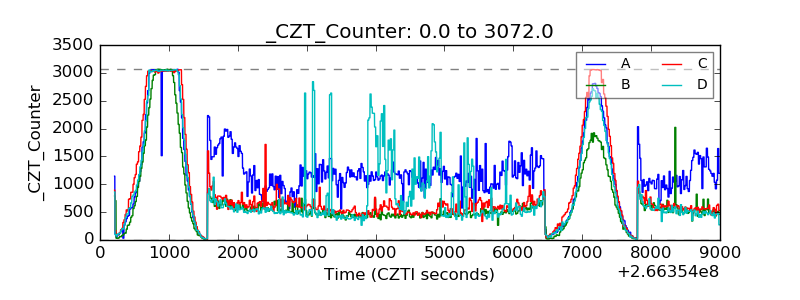 |
| +2.5 Volts monitor |  |
| +5 Volts monitor |  |
| _ROLL_ROT |  |
| _Roll_DEC | 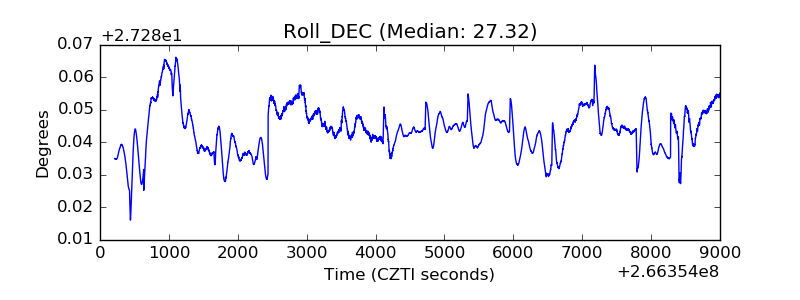 |
| _Roll_RA | 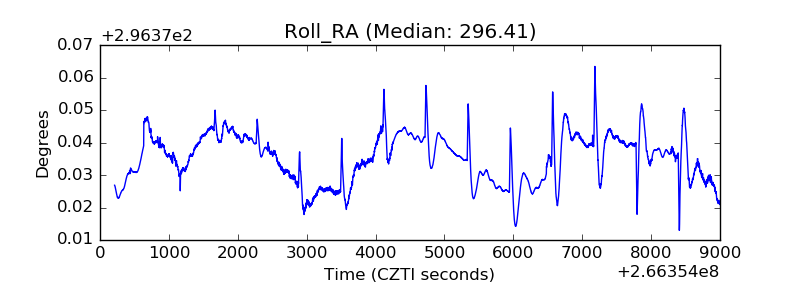 |
| Veto Counter |  |