| Param | Original file | Final file |
|---|---|---|
| Filename | modeM0/AS1G08_055T02_9000002148_14606cztM0_level2.evt | modeM0/AS1G08_055T02_9000002148_14606cztM0_level2_quad_clean.evt |
| Size (bytes) | 248,978,880 | 58,415,040 |
| Size | 237.4 MB | 55.7 MB |
| Events in quadrant A | 2,994,052 | 382,866 |
| Events in quadrant B | 1,400,068 | 400,362 |
| Events in quadrant C | 1,540,336 | 396,657 |
| Events in quadrant D | 1,413,773 | 388,176 |
| Mode SS | |||
|---|---|---|---|
| Quadrant | BADHDUFLAG | Total packets | Discarded packets |
| A | 0 | 56 | 0 |
| B | 0 | 56 | 0 |
| C | 0 | 56 | 0 |
| D | 0 | 56 | 0 |
| Mode M9 | |||
|---|---|---|---|
| Quadrant | BADHDUFLAG | Total packets | Discarded packets |
| A | 0 | 6 | 0 |
| B | 0 | 6 | 0 |
| C | 0 | 6 | 0 |
| D | 0 | 7 | 0 |
| Mode M0 | |||
|---|---|---|---|
| Quadrant | BADHDUFLAG | Total packets | Discarded packets |
| A | 0 | 10917 | 1 |
| B | 0 | 6050 | 1 |
| C | 0 | 6278 | 1 |
| D | 0 | 6073 | 1 |
| Quadrant | Total seconds | Saturated seconds | Saturation percentage |
|---|---|---|---|
| A | 2810 | 50 | 1.779359% |
| B | 2810 | 7 | 0.249110% |
| C | 2810 | 4 | 0.142349% |
| D | 2810 | 11 | 0.391459% |
Noise dominated data is calculated using 1-second bins in cleaned event files. If a bin has >2000 counts, and if more than 50% of those come from <1% of pixels, then it is considered to be noise-dominated and hence unusable.
| Quadrant | # 1 sec bins | Bins with >0 counts | Bins with >2000 counts | High rate bins dominated by noise | Noise dominated (total time) | Noise dominated (detector-on time) | Marked lightcurve |
|---|---|---|---|---|---|---|---|
| A | 2811 | 2811 | 3 | 3 | 0.11% | 0.11% | 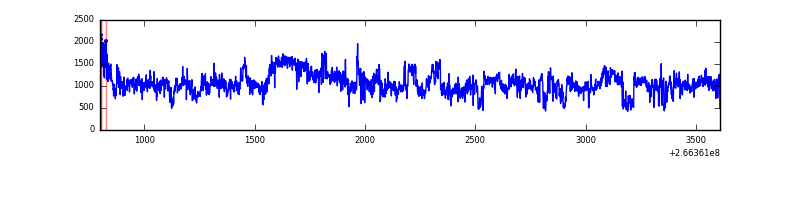 |
| B | 2811 | 2811 | 3 | 3 | 0.11% | 0.11% | 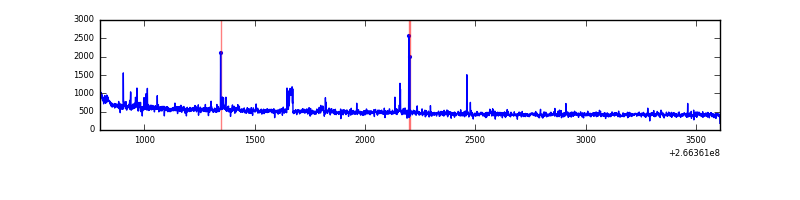 |
| C | 2811 | 2811 | 0 | 0 | 0.00% | 0.00% | 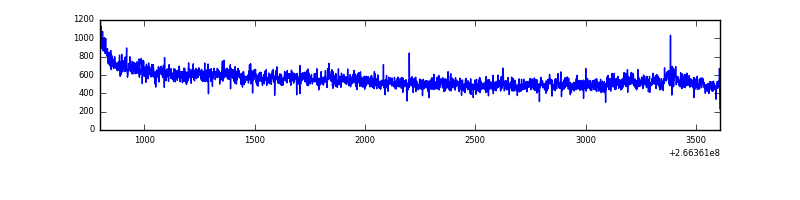 |
| D | 2811 | 2811 | 2 | 2 | 0.07% | 0.07% | 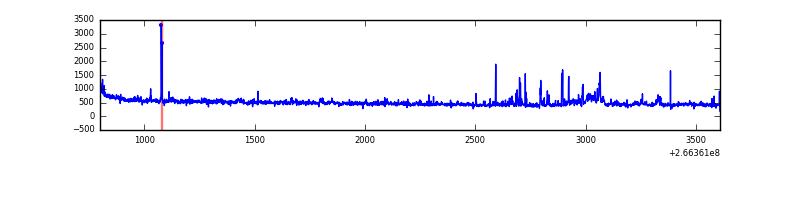 |
Top three noisy pixels from each quadrant. If the there are fewer than three noisy pixels in the level2.evt file, extra rows are filled as -1
| Pixel properties | Quadrant properties | ||||||
|---|---|---|---|---|---|---|---|
| Quadrant | DetID | PixID | Counts | Sigma | Mean | Median | Sigma |
| A | 0 | 23 | 1496127 | 21484.82 | 338 | 332 | 69.6 |
| A | 0 | 226 | 90568 | 1296.1 | 338 | 332 | 69.6 |
| A | 1 | 162 | 39546 | 563.25 | 338 | 332 | 69.6 |
| B | 0 | 205 | 23389 | 350.68 | 345 | 337 | 65.7 |
| B | 12 | 111 | 7585 | 110.26 | 345 | 337 | 65.7 |
| B | 4 | 80 | 7009 | 101.5 | 345 | 337 | 65.7 |
| C | 3 | 233 | 203250 | 2534.35 | 343 | 346 | 80.1 |
| C | 13 | 61 | 2527 | 27.24 | 343 | 346 | 80.1 |
| C | 3 | 202 | 803 | 5.71 | 343 | 346 | 80.1 |
| D | 10 | 199 | 58061 | 716.32 | 336 | 330 | 80.6 |
| D | 12 | 110 | 43996 | 541.81 | 336 | 330 | 80.6 |
| D | 2 | 152 | 14947 | 181.37 | 336 | 330 | 80.6 |
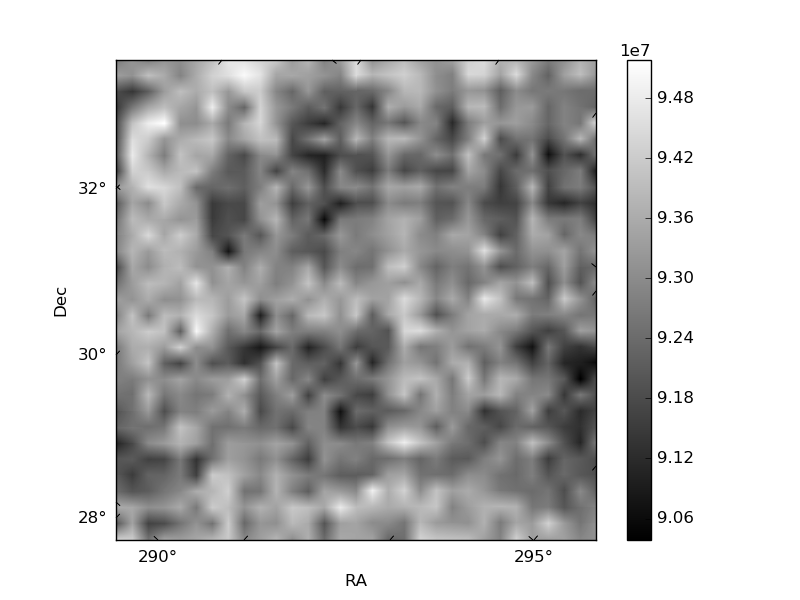
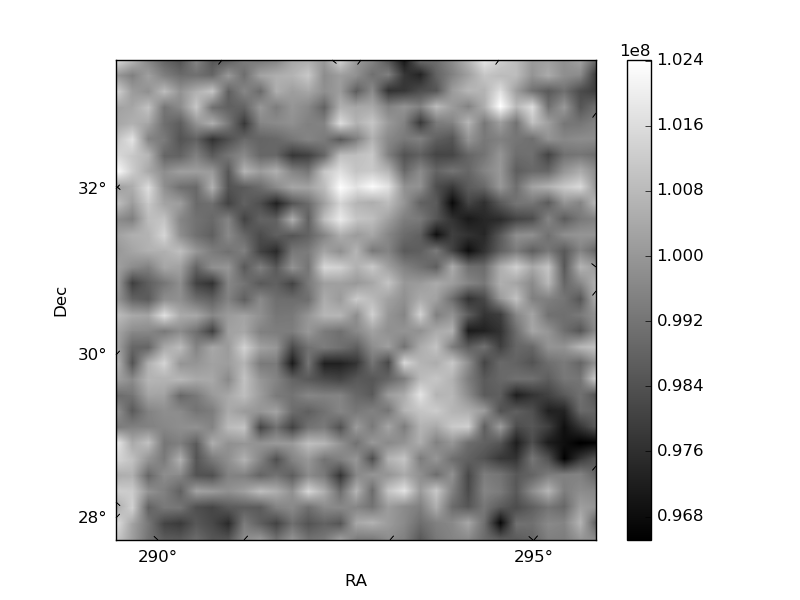
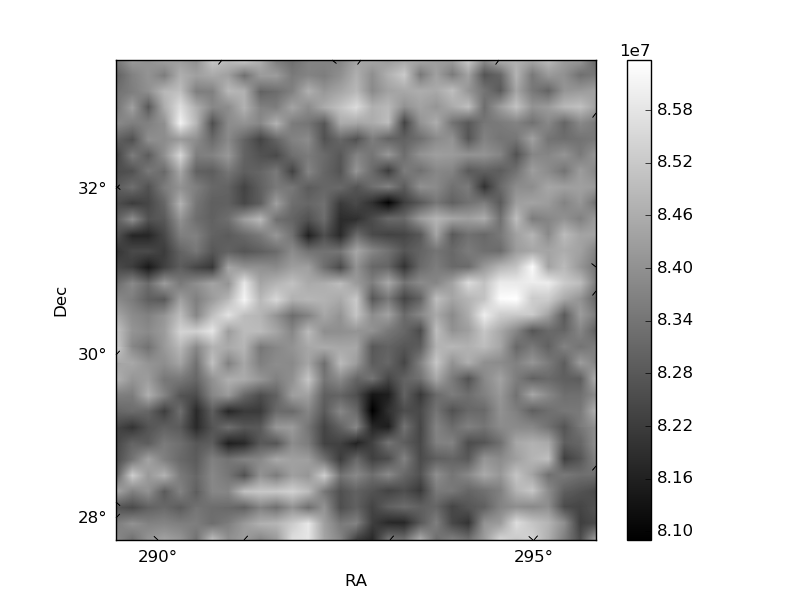
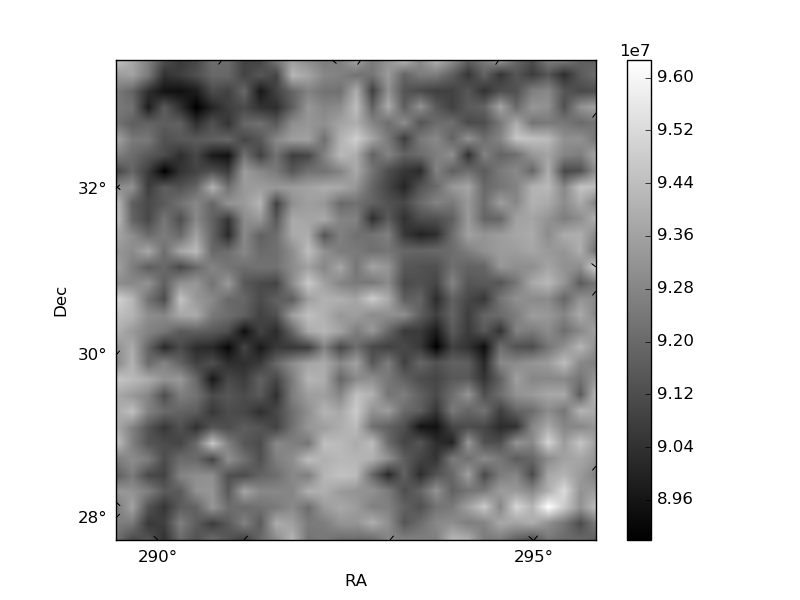
Histogram calculated using DETX and DETY for each event in the final _common_clean file
| Quadrant A | 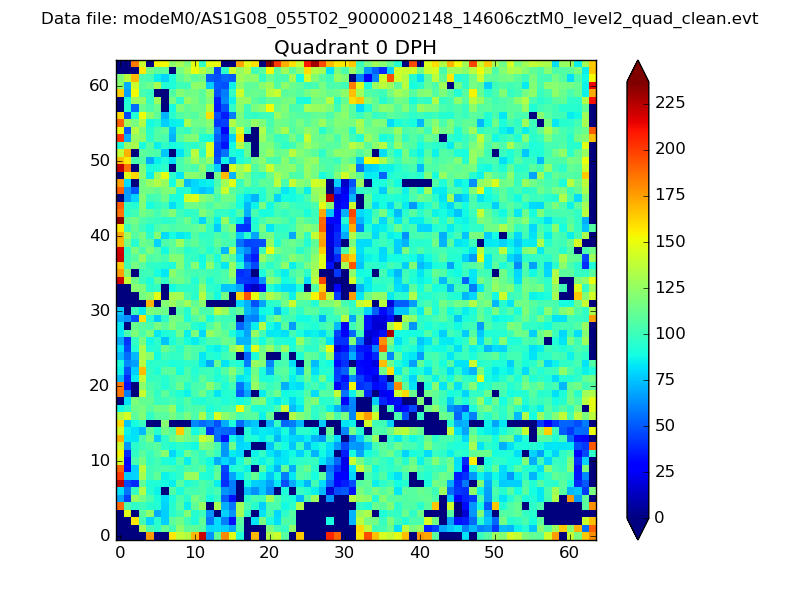 |
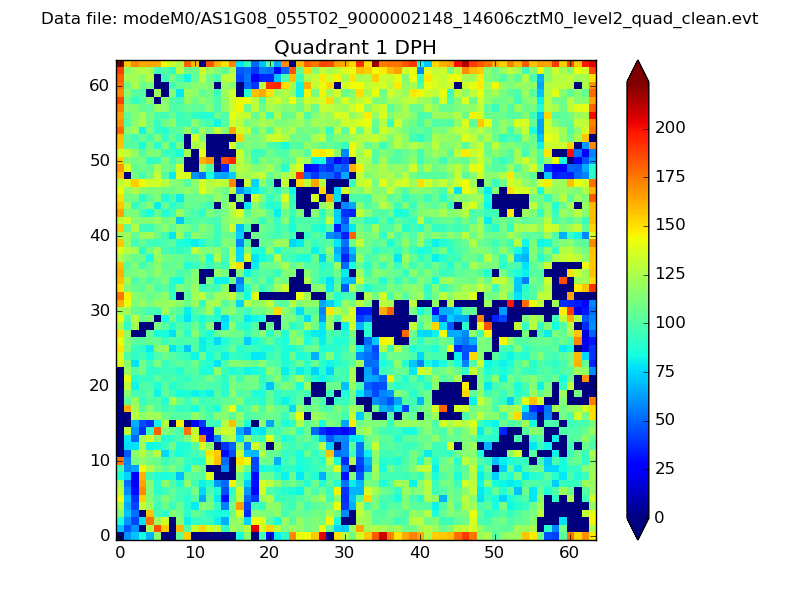 |
Quadrant B |
|---|---|---|---|
| Quadrant D | 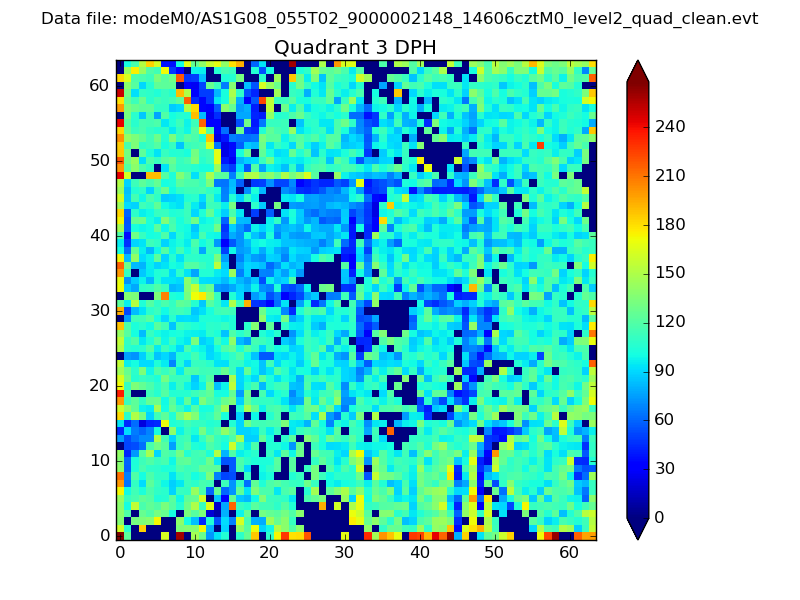 |
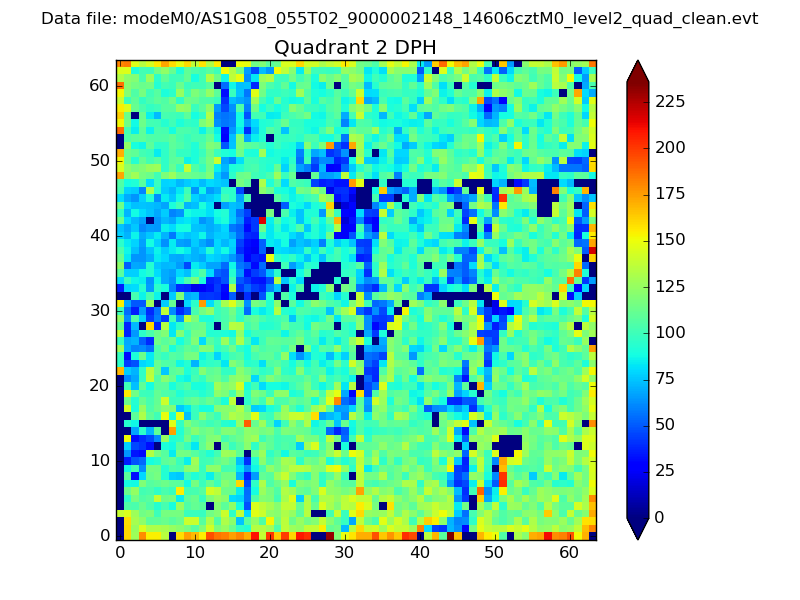 |
Quadrant C |
| Plot type | Count rate plots | Images |
|---|---|---|
| Comparison with Poisson distribution Blue bars denote a histogram of data divided into 1 sec bins. Red curve is a Poisson curve with rate = median count rate of data. |
 |
 |
| Quadrant-wise count rates Data is divided into 100 sec bins |
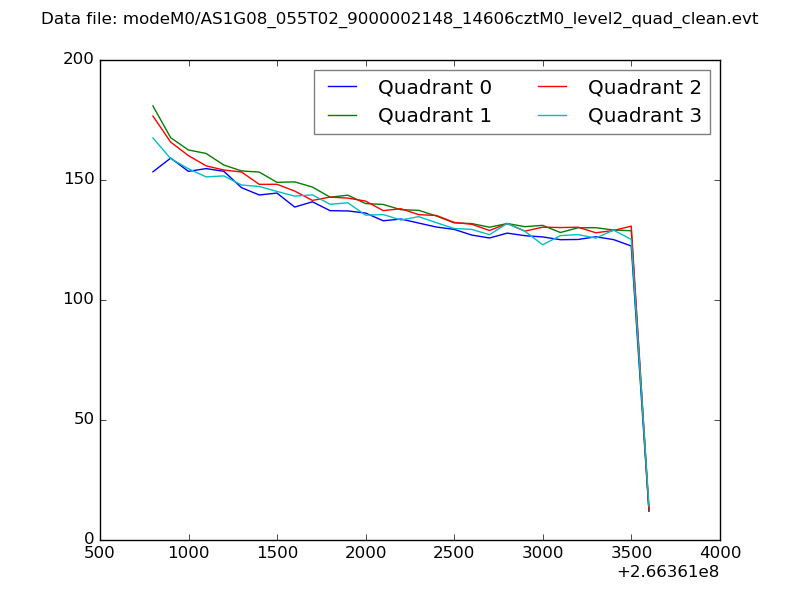 |
|
| Module-wise count rates for Quadrant A Data is divided into 100 sec bins |
 |
 |
| Module-wise count rates for Quadrant B Data is divided into 100 sec bins |
 |
 |
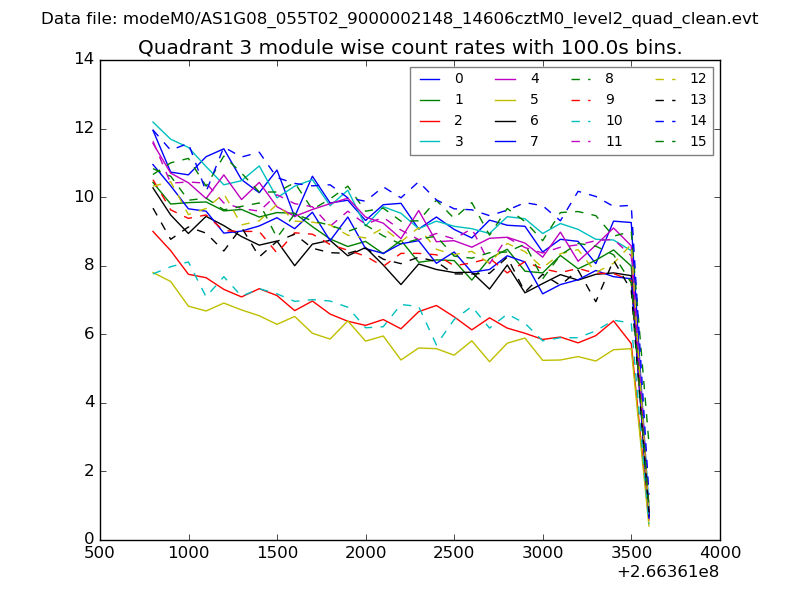
| Module-wise count rates for Quadrant C Data is divided into 100 sec bins |
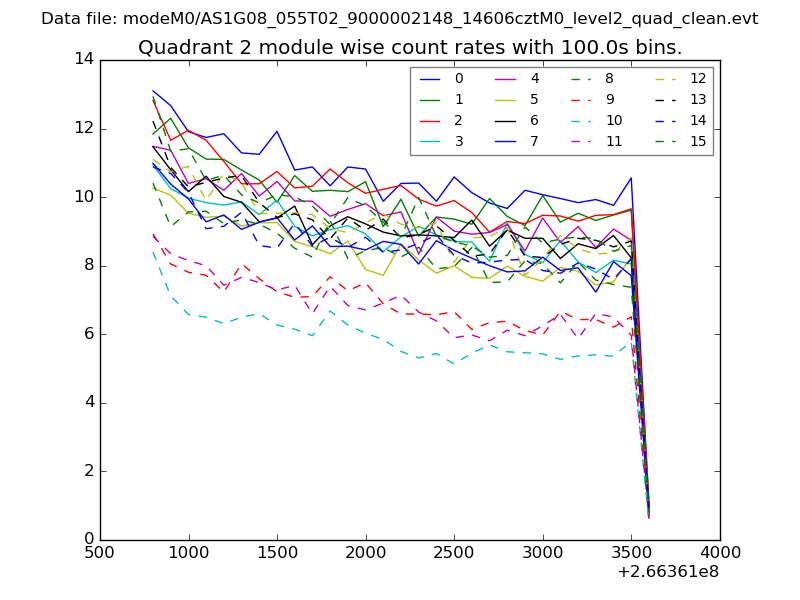 |
 |
| Module-wise count rates for Quadrant D Data is divided into 100 sec bins |
 |
 |
| Parameter | Plot |
|---|---|
| CZT HV Monitor | 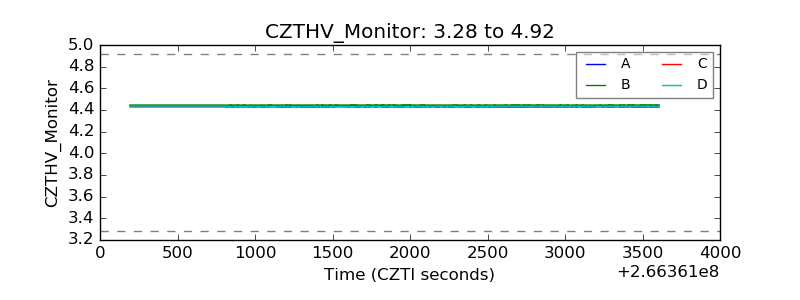 |
| D_VDD | 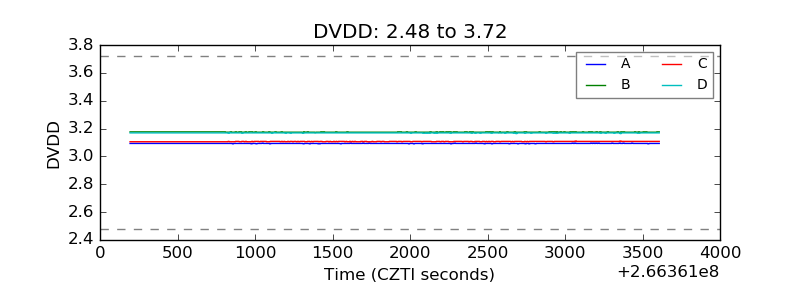 |
| Temperature 1 | 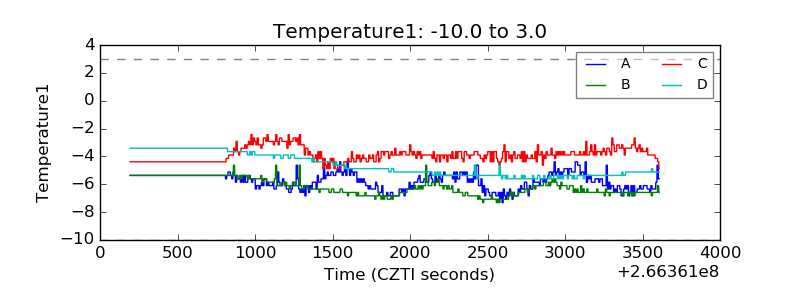 |
| Veto HV Monitor |  |
| Veto LLD | 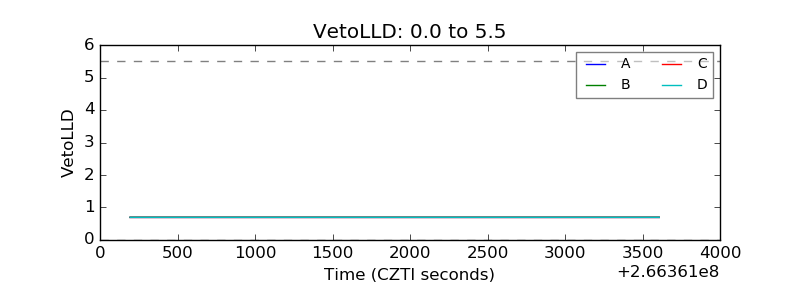 |
| Alpha Counter | 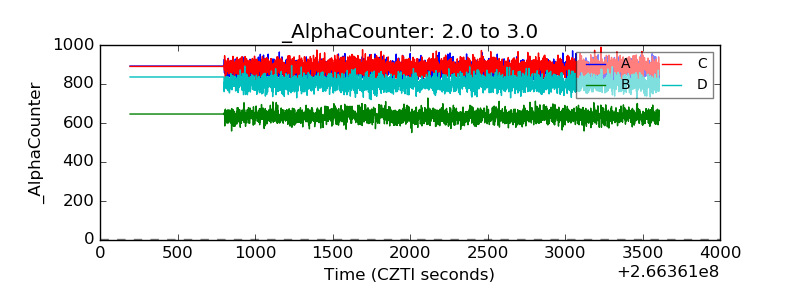 |
| _CPM_Rate | 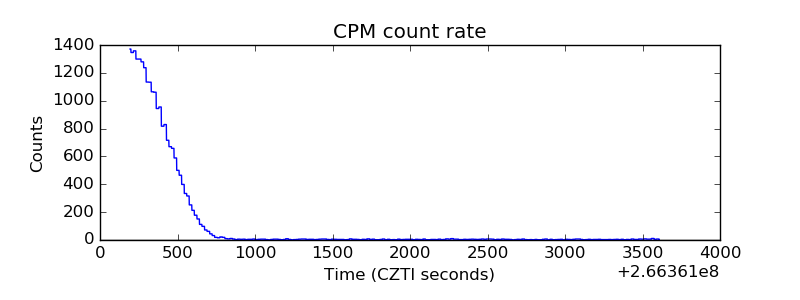 |
| CZT Counter | 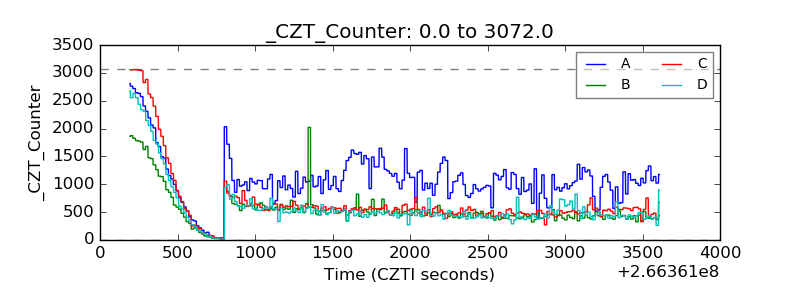 |
| +2.5 Volts monitor | 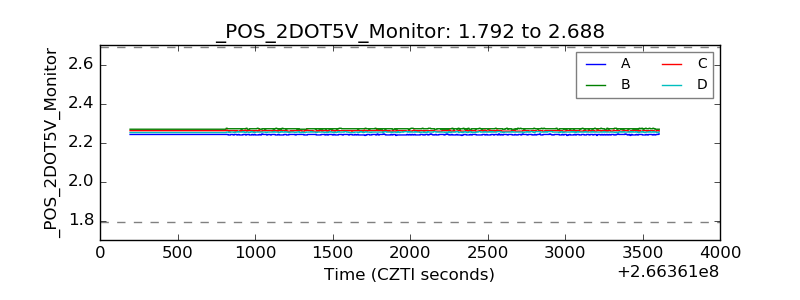 |
| +5 Volts monitor |  |
| _ROLL_ROT |  |
| _Roll_DEC | 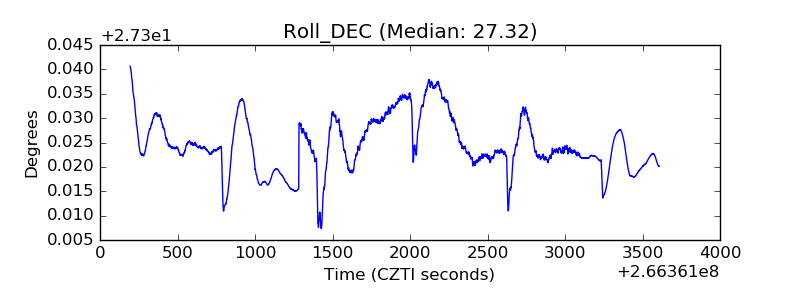 |
| _Roll_RA |  |
| Veto Counter |  |