| Param | Original file | Final file |
|---|---|---|
| Filename | modeM0/AS1G08_059T01_9000002150cztM0_level2.fits | modeM0/AS1G08_059T01_9000002150cztM0_level2_quad_clean.evt |
| Size (bytes) | 233,055,360 | 207,354,240 |
| Size | 222.3 MB | 197.7 MB |
| Events in quadrant A | 1,400,760 | 1,205,832 |
| Events in quadrant B | 1,361,308 | 1,184,664 |
| Events in quadrant C | 1,387,334 | 1,126,756 |
| Events in quadrant D | 1,219,226 | 1,072,290 |
| Mode M0 | |||
|---|---|---|---|
| Quadrant | BADHDUFLAG | Total packets | Discarded packets |
| A | 0 | 57827 | 0 |
| B | 0 | 51922 | 0 |
| C | 0 | 60247 | 0 |
| D | 0 | 54356 | 0 |
| Mode M9 | |||
|---|---|---|---|
| Quadrant | BADHDUFLAG | Total packets | Discarded packets |
| A | 0 | 26 | 0 |
| B | 0 | 26 | 0 |
| C | 0 | 26 | 0 |
| D | 0 | 26 | 0 |
| Mode SS | |||
|---|---|---|---|
| Quadrant | BADHDUFLAG | Total packets | Discarded packets |
| A | 0 | 500 | 0 |
| B | 0 | 500 | 0 |
| C | 0 | 500 | 0 |
| D | 0 | 500 | 0 |
| Quadrant | Total seconds | Saturated seconds | Saturation percentage |
|---|---|---|---|
| A | 24554 | 535 | 2.178871% |
| B | 24554 | 343 | 1.396921% |
| C | 24554 | 201 | 0.818604% |
| D | 24554 | 386 | 1.572045% |
Noise dominated data is calculated using 1-second bins in cleaned event files. If a bin has >2000 counts, and if more than 50% of those come from <1% of pixels, then it is considered to be noise-dominated and hence unusable.
| Quadrant | # 1 sec bins | Bins with >0 counts | Bins with >2000 counts | High rate bins dominated by noise | Noise dominated (total time) | Noise dominated (detector-on time) | Marked lightcurve |
|---|---|---|---|---|---|---|---|
| A | 27189 | 24555 | 0 | 0 | 0.00% | 0.00% | 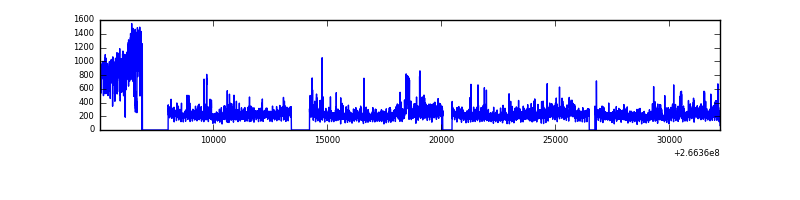 |
| B | 27189 | 24555 | 0 | 0 | 0.00% | 0.00% |  |
| C | 27189 | 24554 | 0 | 0 | 0.00% | 0.00% |  |
| D | 27189 | 24554 | 0 | 0 | 0.00% | 0.00% | 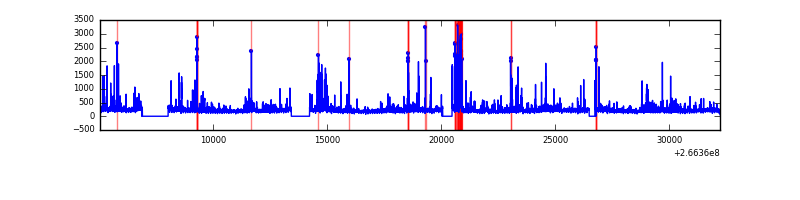 |
Top three noisy pixels from each quadrant. If the there are fewer than three noisy pixels in the level2.evt file, extra rows are filled as -1
| Pixel properties | Quadrant properties | ||||||
|---|---|---|---|---|---|---|---|
| Quadrant | DetID | PixID | Counts | Sigma | Mean | Median | Sigma |
| A | 0 | 29 | 1373 | 11.16 | 364 | 339 | 92.6 |
| A | 7 | 110 | 1168 | 8.94 | 364 | 339 | 92.6 |
| A | 15 | 236 | 1108 | 8.29 | 364 | 339 | 92.6 |
| B | 2 | 9 | 1174 | 11.27 | 359 | 341 | 73.9 |
| B | 3 | 17 | 935 | 8.04 | 359 | 341 | 73.9 |
| B | 5 | 128 | 911 | 7.71 | 359 | 341 | 73.9 |
| C | 1 | 80 | 1024 | 7.1 | 366 | 341 | 96.2 |
| C | 1 | 81 | 983 | 6.67 | 366 | 341 | 96.2 |
| C | 12 | 241 | 953 | 6.36 | 366 | 341 | 96.2 |
| D | 3 | 14 | 910 | 6.28 | 347 | 314 | 94.9 |
| D | 7 | 3 | 877 | 5.93 | 347 | 314 | 94.9 |
| D | 6 | 231 | 868 | 5.84 | 347 | 314 | 94.9 |
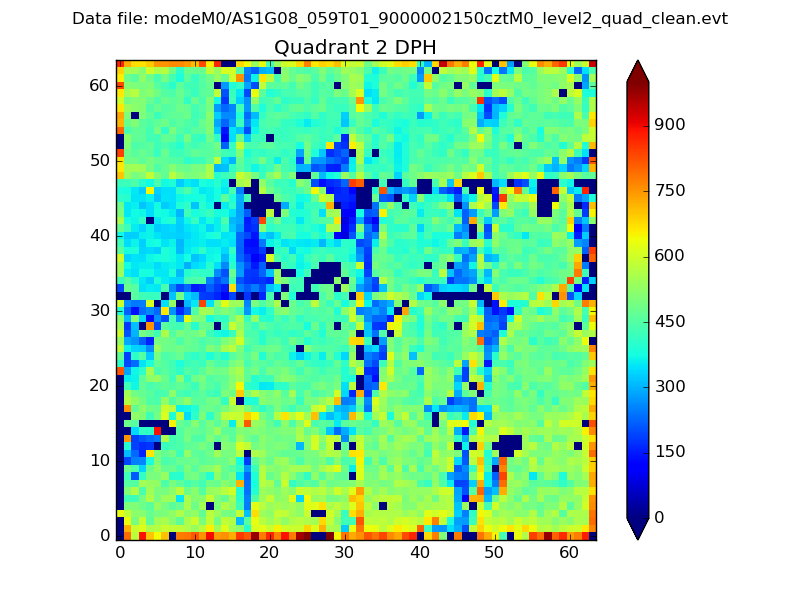
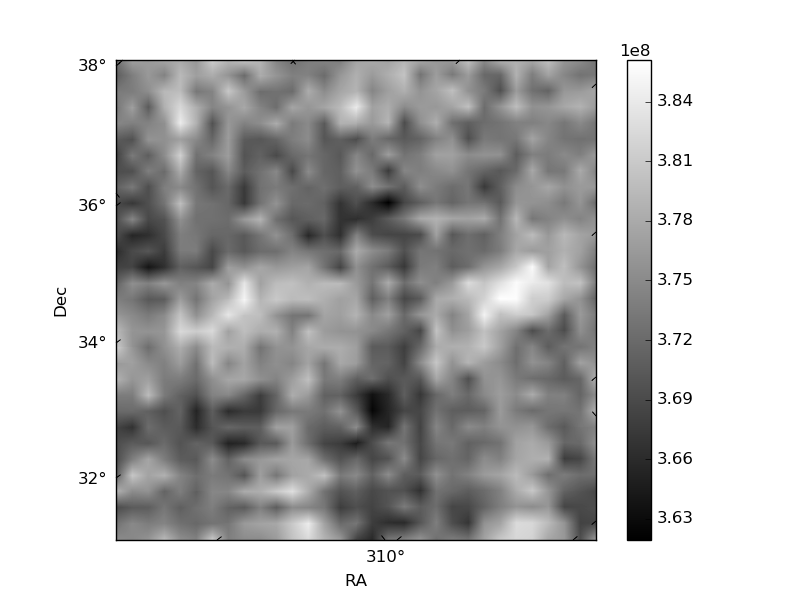
Histogram calculated using DETX and DETY for each event in the final _common_clean file
| Quadrant A |  |
 |
Quadrant B |
|---|---|---|---|
| Quadrant D | 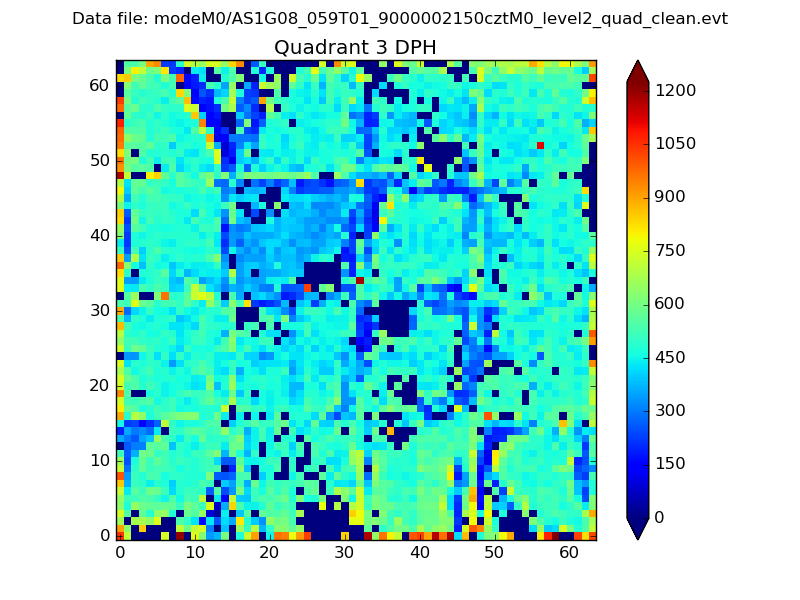 |
 |
Quadrant C |
| Plot type | Count rate plots | Images |
|---|---|---|
| Comparison with Poisson distribution Blue bars denote a histogram of data divided into 1 sec bins. Red curve is a Poisson curve with rate = median count rate of data. |
 |
 |
| Quadrant-wise count rates Data is divided into 100 sec bins |
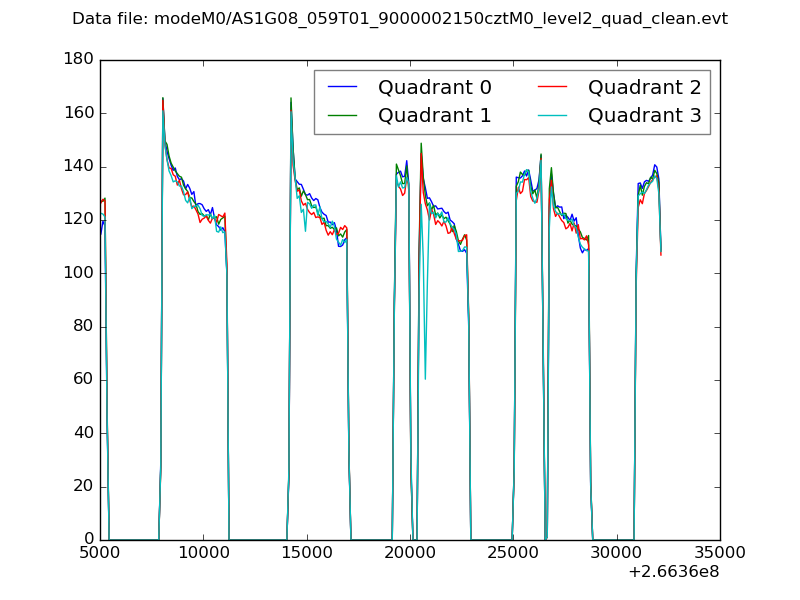 |
|
| Module-wise count rates for Quadrant A Data is divided into 100 sec bins |
 |
 |
| Module-wise count rates for Quadrant B Data is divided into 100 sec bins |
 |
 |
| Module-wise count rates for Quadrant C Data is divided into 100 sec bins |
 |
 |
| Module-wise count rates for Quadrant D Data is divided into 100 sec bins |
 |
 |
| Parameter | Plot |
|---|---|
| CZT HV Monitor | 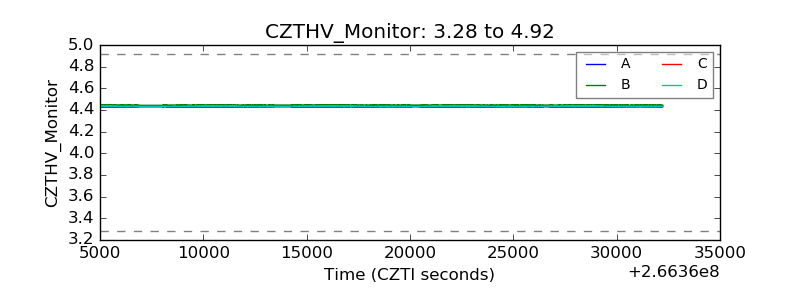 |
| D_VDD | 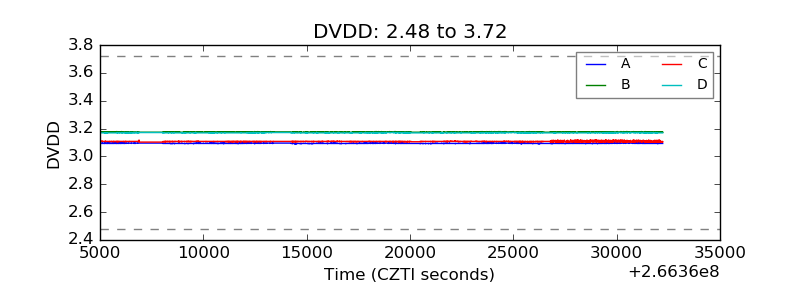 |
| Temperature 1 |  |
| Veto HV Monitor |  |
| Veto LLD |  |
| Alpha Counter |  |
| _CPM_Rate |  |
| CZT Counter | 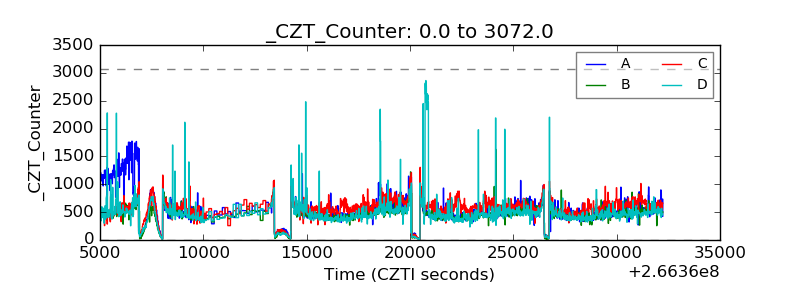 |
| +2.5 Volts monitor |  |
| +5 Volts monitor |  |
| _ROLL_ROT |  |
| _Roll_DEC | 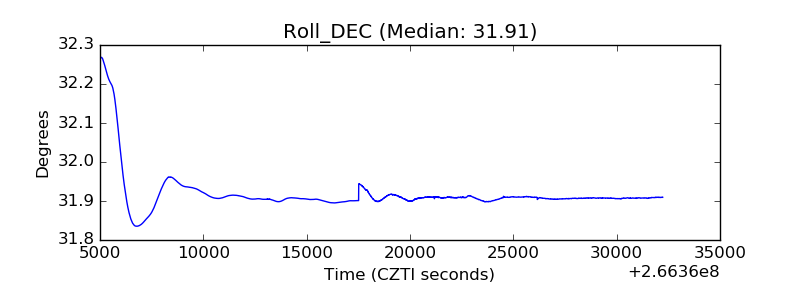 |
| _Roll_RA |  |
| Veto Counter | 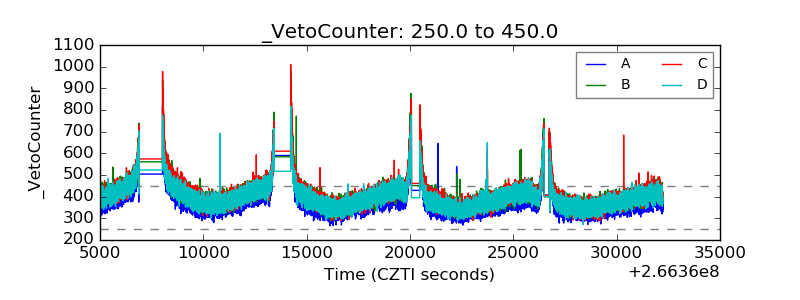 |