| Param | Original file | Final file |
|---|---|---|
| Filename | modeM0/AS1G08_059T01_9000002150_14606cztM0_level2.evt | modeM0/AS1G08_059T01_9000002150_14606cztM0_level2_quad_clean.evt |
| Size (bytes) | 285,462,720 | 37,794,240 |
| Size | 272.2 MB | 36.0 MB |
| Events in quadrant A | 3,037,803 | 229,528 |
| Events in quadrant B | 1,709,780 | 232,919 |
| Events in quadrant C | 1,871,381 | 229,586 |
| Events in quadrant D | 1,808,791 | 225,482 |
| Mode M0 | |||
|---|---|---|---|
| Quadrant | BADHDUFLAG | Total packets | Discarded packets |
| A | 0 | 11094 | 3 |
| B | 0 | 7040 | 2 |
| C | 0 | 7663 | 2 |
| D | 0 | 7371 | 2 |
| Mode M9 | |||
|---|---|---|---|
| Quadrant | BADHDUFLAG | Total packets | Discarded packets |
| A | 0 | 11 | 0 |
| B | 0 | 11 | 0 |
| C | 0 | 11 | 0 |
| D | 0 | 11 | 0 |
| Mode SS | |||
|---|---|---|---|
| Quadrant | BADHDUFLAG | Total packets | Discarded packets |
| A | 0 | 66 | 0 |
| B | 0 | 66 | 0 |
| C | 0 | 66 | 0 |
| D | 0 | 66 | 0 |
| Quadrant | Total seconds | Saturated seconds | Saturation percentage |
|---|---|---|---|
| A | 3184 | 303 | 9.516332% |
| B | 3184 | 75 | 2.355528% |
| C | 3184 | 50 | 1.570352% |
| D | 3184 | 37 | 1.162060% |
Noise dominated data is calculated using 1-second bins in cleaned event files. If a bin has >2000 counts, and if more than 50% of those come from <1% of pixels, then it is considered to be noise-dominated and hence unusable.
| Quadrant | # 1 sec bins | Bins with >0 counts | Bins with >2000 counts | High rate bins dominated by noise | Noise dominated (total time) | Noise dominated (detector-on time) | Marked lightcurve |
|---|---|---|---|---|---|---|---|
| A | 4330 | 3187 | 3 | 3 | 0.07% | 0.09% | 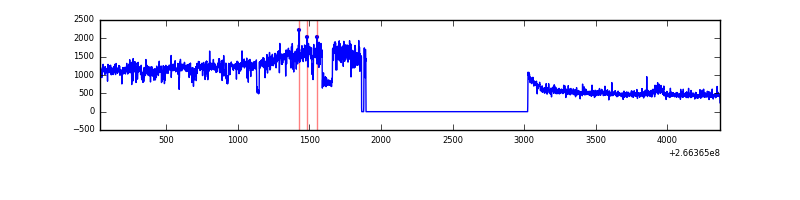 |
| B | 4330 | 3187 | 2 | 2 | 0.05% | 0.06% | 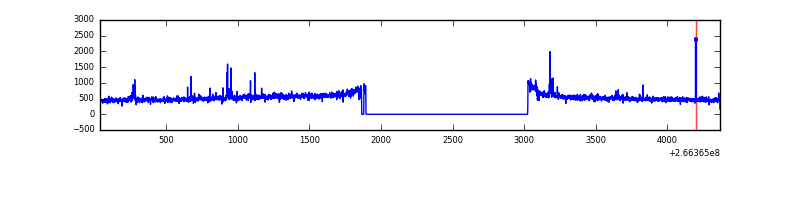 |
| C | 4330 | 3187 | 4 | 4 | 0.09% | 0.13% | 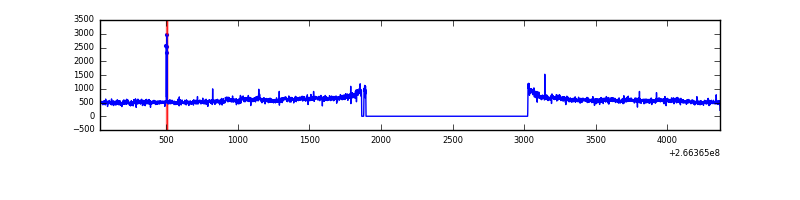 |
| D | 4330 | 3187 | 19 | 19 | 0.44% | 0.60% | 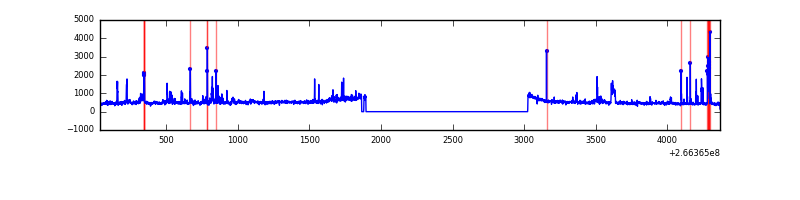 |
Top three noisy pixels from each quadrant. If the there are fewer than three noisy pixels in the level2.evt file, extra rows are filled as -1
| Pixel properties | Quadrant properties | ||||||
|---|---|---|---|---|---|---|---|
| Quadrant | DetID | PixID | Counts | Sigma | Mean | Median | Sigma |
| A | 0 | 23 | 1301486 | 15381.35 | 408 | 398 | 84.6 |
| A | 0 | 226 | 82749 | 973.55 | 408 | 398 | 84.6 |
| A | 1 | 162 | 34703 | 405.55 | 408 | 398 | 84.6 |
| B | 0 | 205 | 18372 | 223.08 | 417 | 407 | 80.5 |
| B | 0 | 189 | 16943 | 205.34 | 417 | 407 | 80.5 |
| B | 0 | 214 | 14434 | 174.18 | 417 | 407 | 80.5 |
| C | 3 | 233 | 279922 | 2943.86 | 405 | 407 | 94.9 |
| C | 14 | 234 | 11601 | 117.9 | 405 | 407 | 94.9 |
| C | 13 | 61 | 2877 | 26.01 | 405 | 407 | 94.9 |
| D | 10 | 199 | 105020 | 1076.78 | 405 | 395 | 97.2 |
| D | 12 | 110 | 81282 | 832.48 | 405 | 395 | 97.2 |
| D | 2 | 152 | 46327 | 472.72 | 405 | 395 | 97.2 |
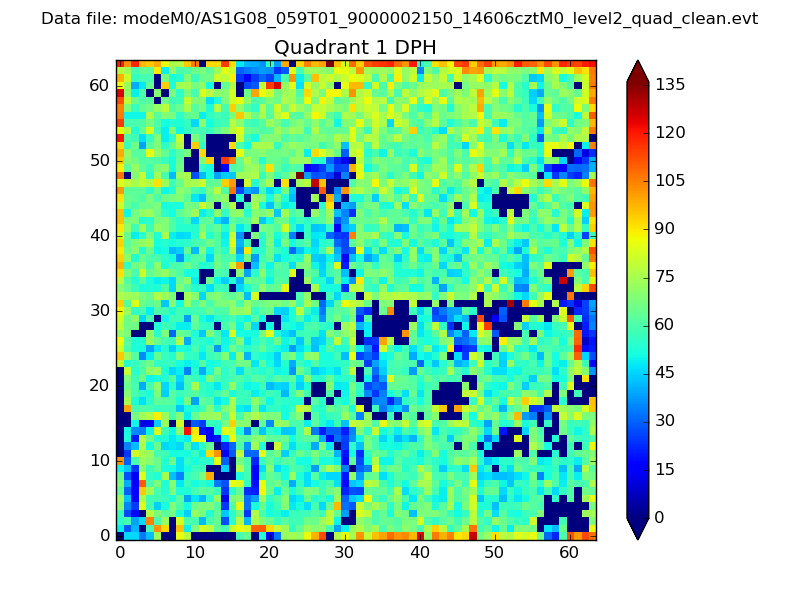
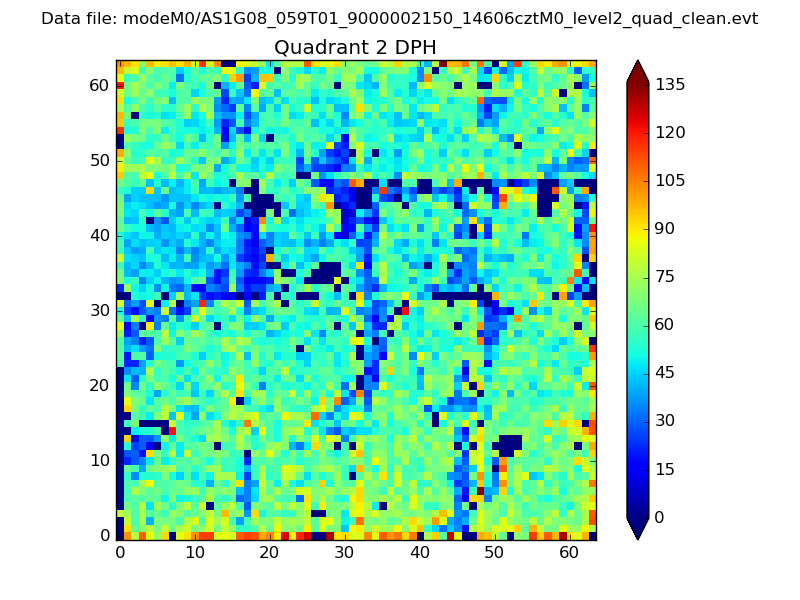
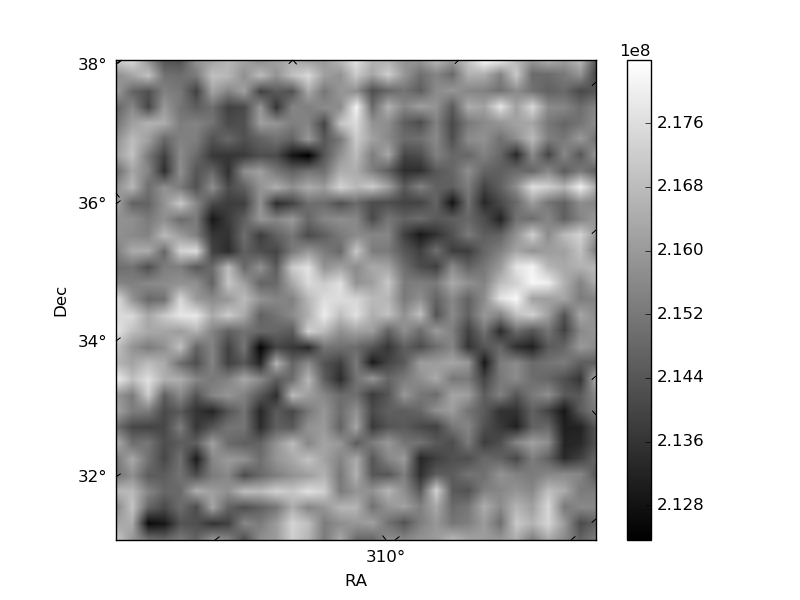
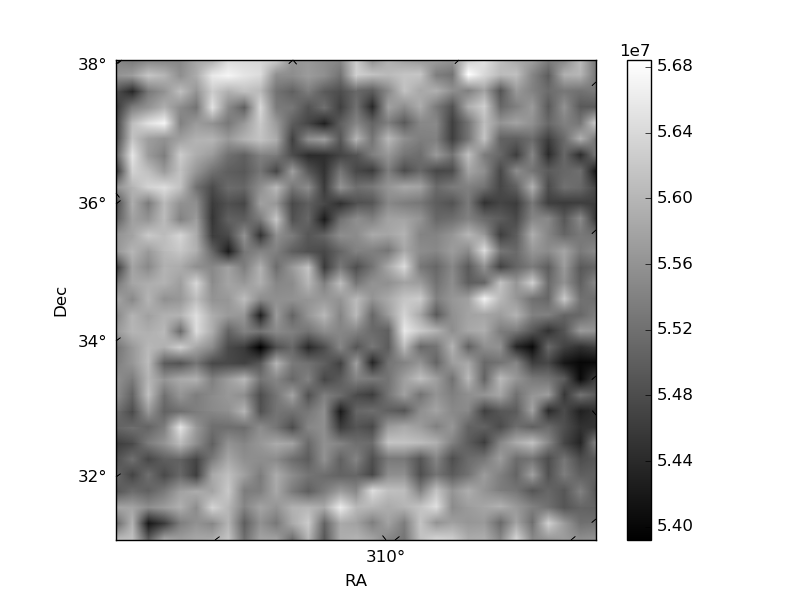
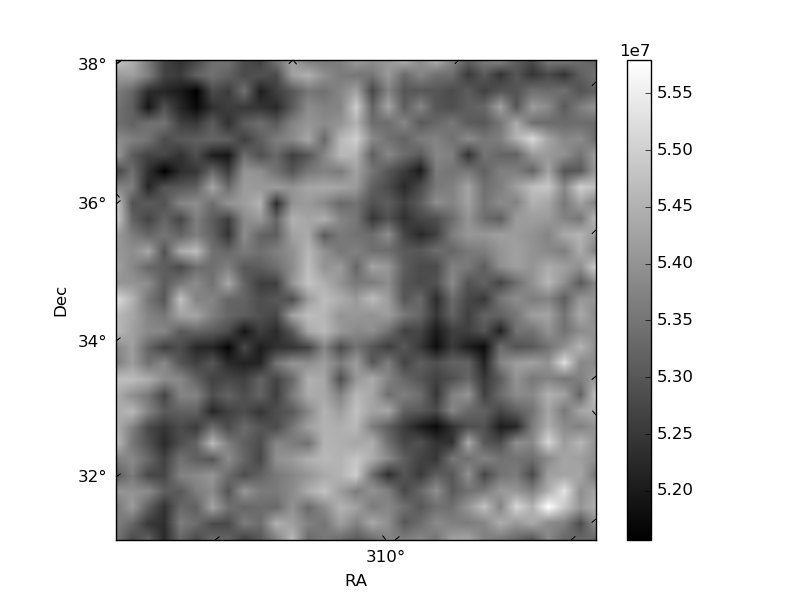
Histogram calculated using DETX and DETY for each event in the final _common_clean file
| Quadrant A |  |
 |
Quadrant B |
|---|---|---|---|
| Quadrant D | 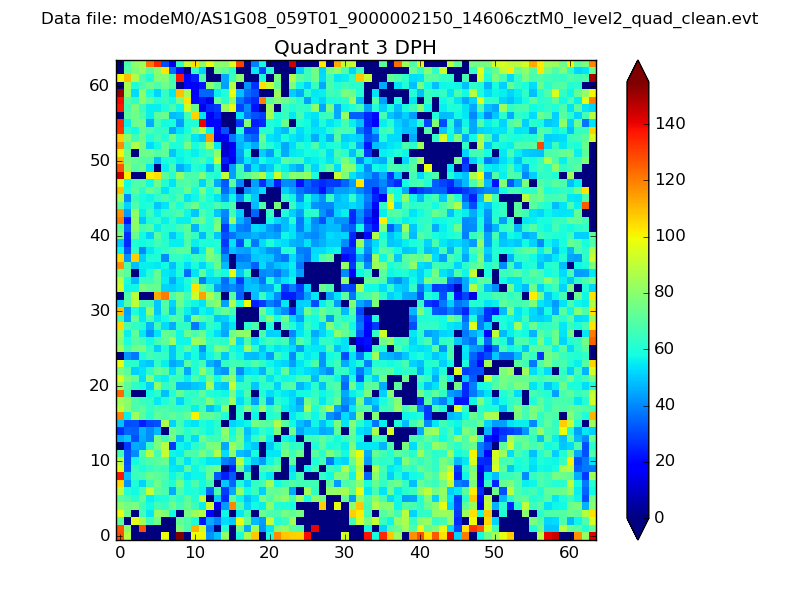 |
 |
Quadrant C |
| Plot type | Count rate plots | Images |
|---|---|---|
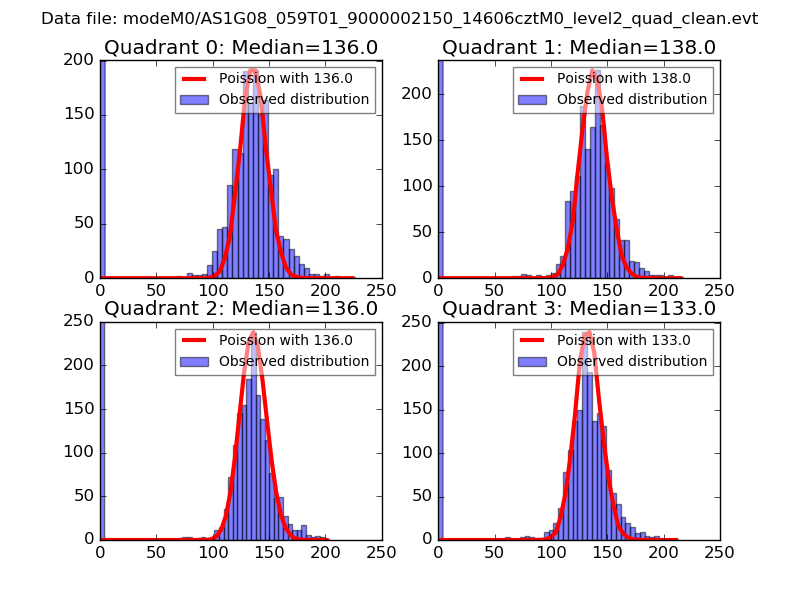
| Comparison with Poisson distribution Blue bars denote a histogram of data divided into 1 sec bins. Red curve is a Poisson curve with rate = median count rate of data. |
 |
 |
| Quadrant-wise count rates Data is divided into 100 sec bins |
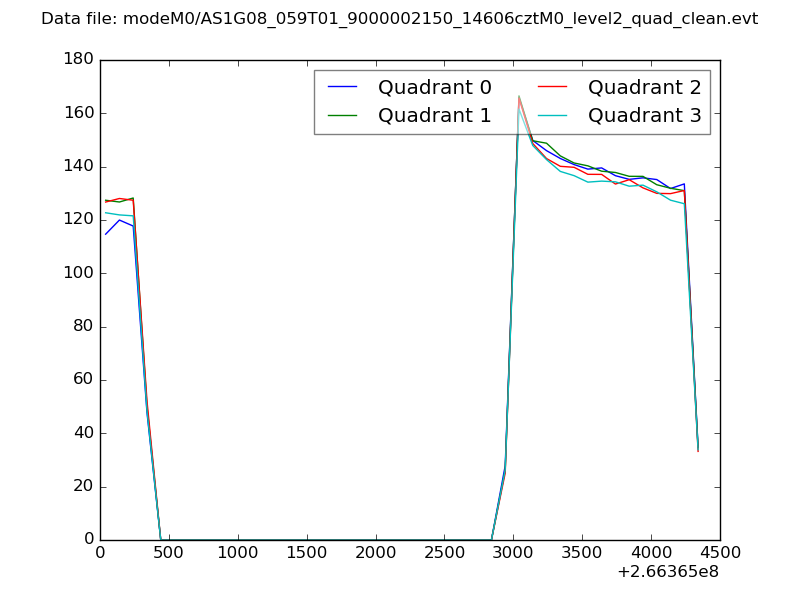 |
|
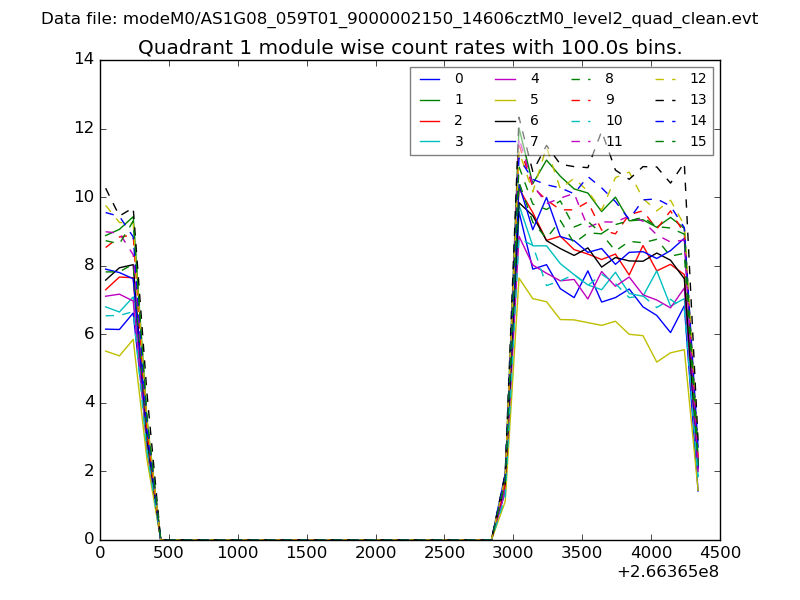
| Module-wise count rates for Quadrant A Data is divided into 100 sec bins |
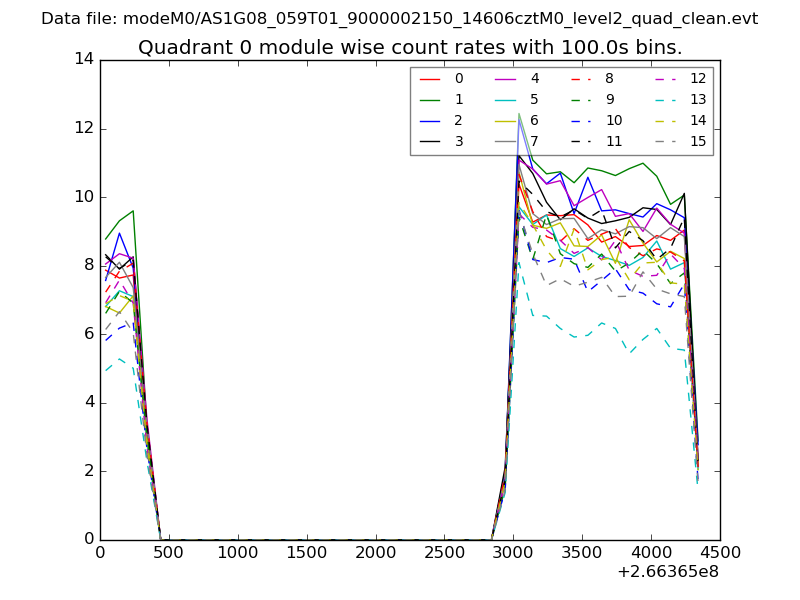 |
 |
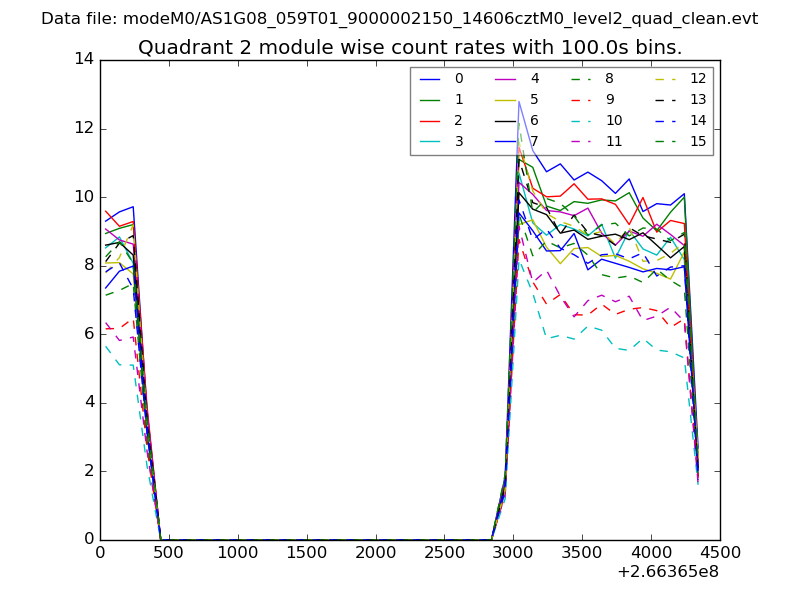
| Module-wise count rates for Quadrant B Data is divided into 100 sec bins |
 |
 |
| Module-wise count rates for Quadrant C Data is divided into 100 sec bins |
 |
 |
| Module-wise count rates for Quadrant D Data is divided into 100 sec bins |
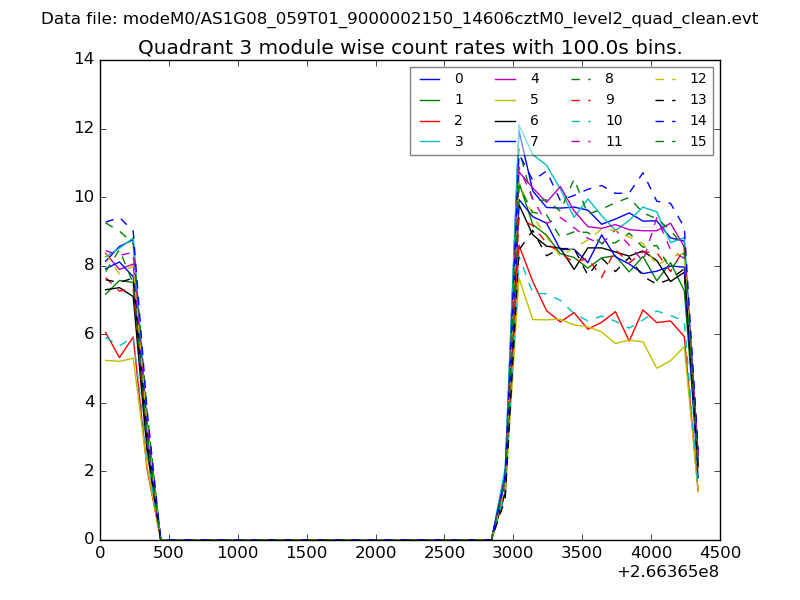 |
 |
| Parameter | Plot |
|---|---|
| CZT HV Monitor | 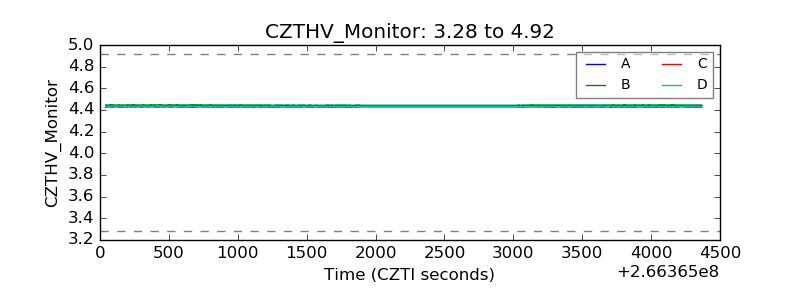 |
| D_VDD | 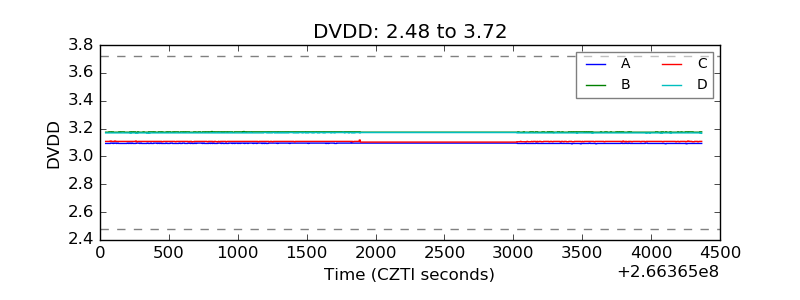 |
| Temperature 1 | 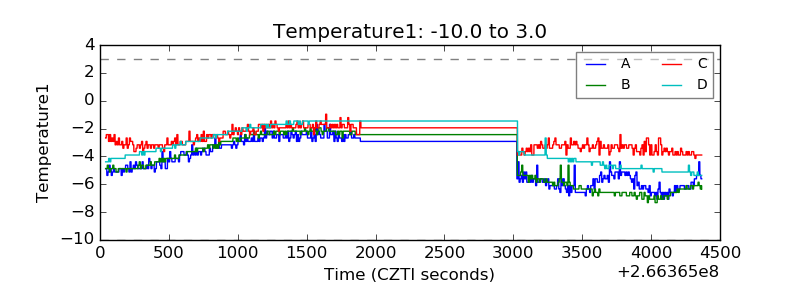 |
| Veto HV Monitor | 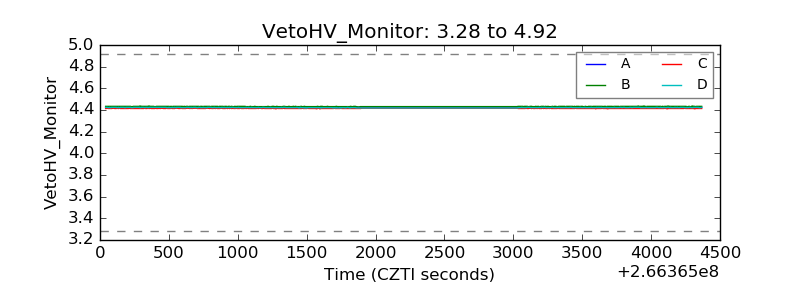 |
| Veto LLD | 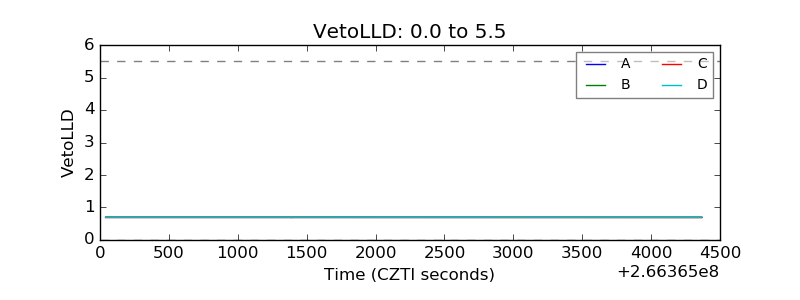 |
| Alpha Counter | 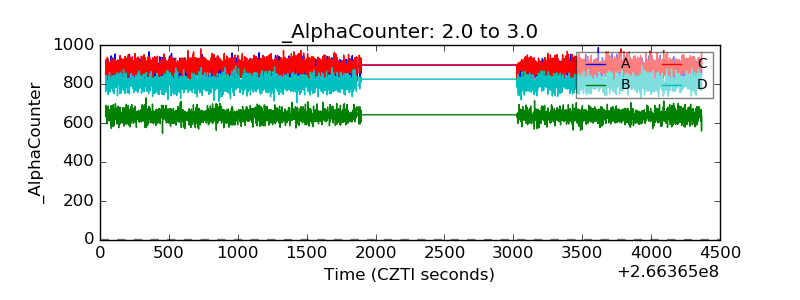 |
| _CPM_Rate |  |
| CZT Counter | 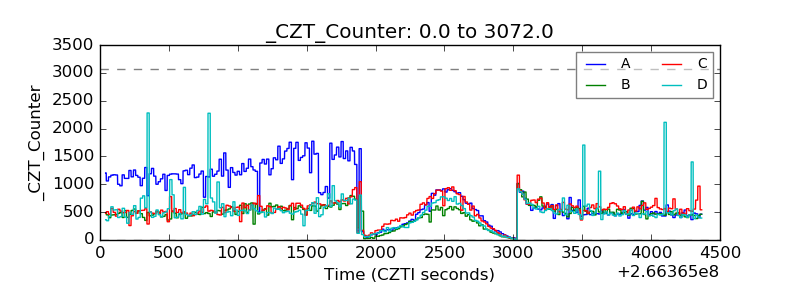 |
| +2.5 Volts monitor | 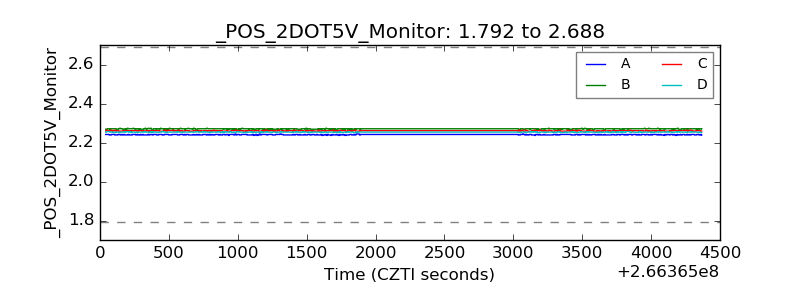 |
| +5 Volts monitor | 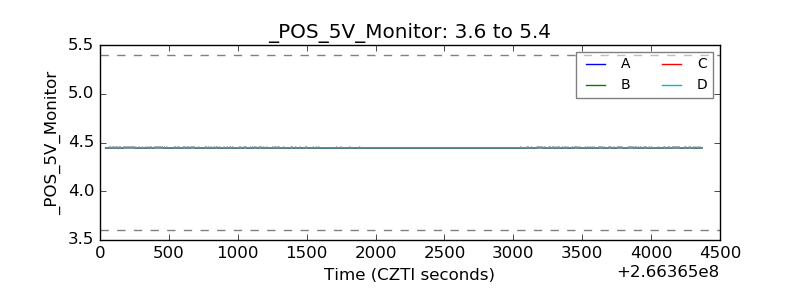 |
| _ROLL_ROT | 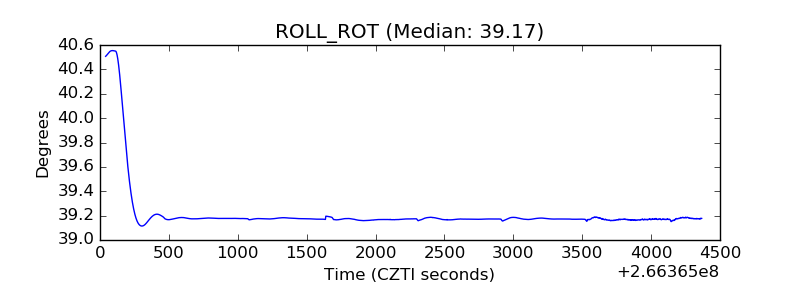 |
| _Roll_DEC |  |
| _Roll_RA | 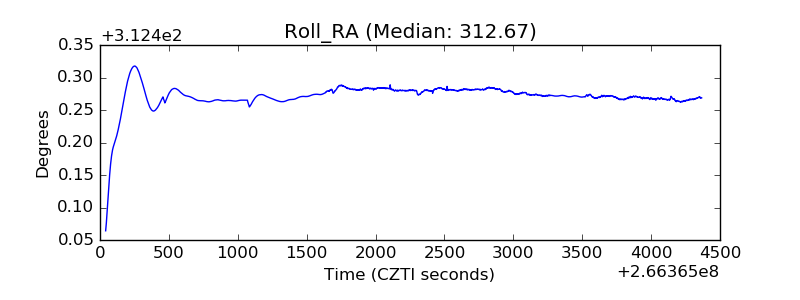 |
| Veto Counter | 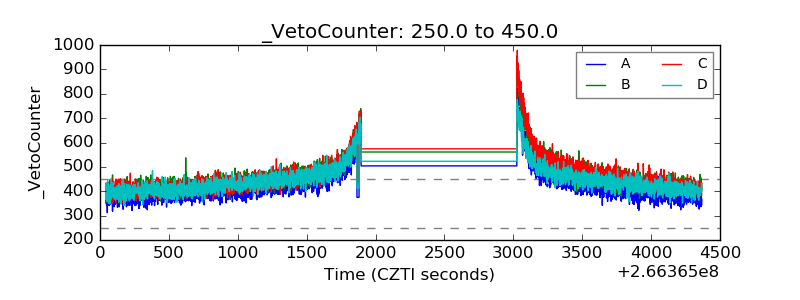 |