| Param | Original file | Final file |
|---|---|---|
| Filename | modeM0/AS1G08_059T01_9000002150_14607cztM0_level2.evt | modeM0/AS1G08_059T01_9000002150_14607cztM0_level2_quad_clean.evt |
| Size (bytes) | 487,229,760 | 95,319,360 |
| Size | 464.7 MB | 90.9 MB |
| Events in quadrant A | 3,461,425 | 610,176 |
| Events in quadrant B | 3,404,388 | 607,820 |
| Events in quadrant C | 3,905,521 | 598,871 |
| Events in quadrant D | 3,520,819 | 593,948 |
| Mode M0 | |||
|---|---|---|---|
| Quadrant | BADHDUFLAG | Total packets | Discarded packets |
| A | 0 | 14735 | 3 |
| B | 0 | 14574 | 2 |
| C | 0 | 16051 | 2 |
| D | 0 | 15201 | 2 |
| Mode M9 | |||
|---|---|---|---|
| Quadrant | BADHDUFLAG | Total packets | Discarded packets |
| A | 0 | 15 | 0 |
| B | 0 | 15 | 0 |
| C | 0 | 15 | 0 |
| D | 0 | 16 | 0 |
| Mode SS | |||
|---|---|---|---|
| Quadrant | BADHDUFLAG | Total packets | Discarded packets |
| A | 0 | 138 | 0 |
| B | 0 | 138 | 0 |
| C | 0 | 138 | 0 |
| D | 0 | 138 | 0 |
| Quadrant | Total seconds | Saturated seconds | Saturation percentage |
|---|---|---|---|
| A | 6831 | 83 | 1.215049% |
| B | 6831 | 118 | 1.727419% |
| C | 6831 | 81 | 1.185771% |
| D | 6831 | 73 | 1.068658% |
Noise dominated data is calculated using 1-second bins in cleaned event files. If a bin has >2000 counts, and if more than 50% of those come from <1% of pixels, then it is considered to be noise-dominated and hence unusable.
| Quadrant | # 1 sec bins | Bins with >0 counts | Bins with >2000 counts | High rate bins dominated by noise | Noise dominated (total time) | Noise dominated (detector-on time) | Marked lightcurve |
|---|---|---|---|---|---|---|---|
| A | 7632 | 6833 | 0 | 0 | 0.00% | 0.00% | 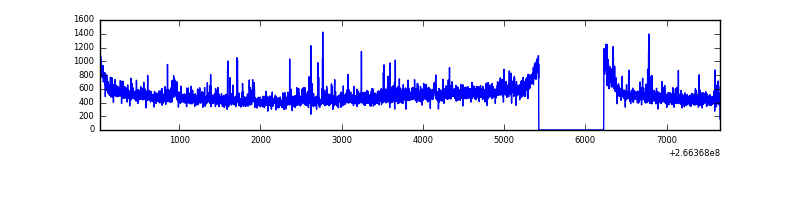 |
| B | 7632 | 6833 | 6 | 6 | 0.08% | 0.09% | 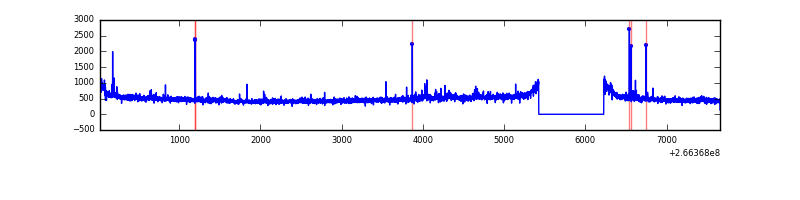 |
| C | 7632 | 6833 | 0 | 0 | 0.00% | 0.00% | 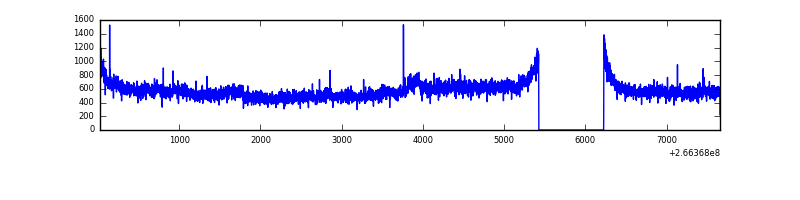 |
| D | 7632 | 6833 | 48 | 48 | 0.63% | 0.70% | 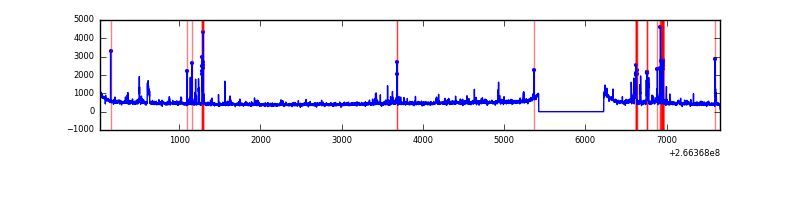 |
Top three noisy pixels from each quadrant. If the there are fewer than three noisy pixels in the level2.evt file, extra rows are filled as -1
| Pixel properties | Quadrant properties | ||||||
|---|---|---|---|---|---|---|---|
| Quadrant | DetID | PixID | Counts | Sigma | Mean | Median | Sigma |
| A | 1 | 162 | 60321 | 348.07 | 843 | 826 | 170.9 |
| A | 0 | 23 | 55739 | 321.26 | 843 | 826 | 170.9 |
| A | 8 | 15 | 44149 | 253.46 | 843 | 826 | 170.9 |
| B | 0 | 205 | 24390 | 145.78 | 843 | 823 | 161.7 |
| B | 0 | 229 | 22699 | 135.32 | 843 | 823 | 161.7 |
| B | 12 | 111 | 19389 | 114.84 | 843 | 823 | 161.7 |
| C | 3 | 233 | 697723 | 3624.42 | 822 | 826 | 192.3 |
| C | 13 | 61 | 5907 | 26.43 | 822 | 826 | 192.3 |
| C | 0 | 207 | 3703 | 14.96 | 822 | 826 | 192.3 |
| D | 10 | 199 | 169847 | 866.53 | 817 | 799 | 195.1 |
| D | 12 | 110 | 166053 | 847.09 | 817 | 799 | 195.1 |
| D | 2 | 152 | 30085 | 150.12 | 817 | 799 | 195.1 |
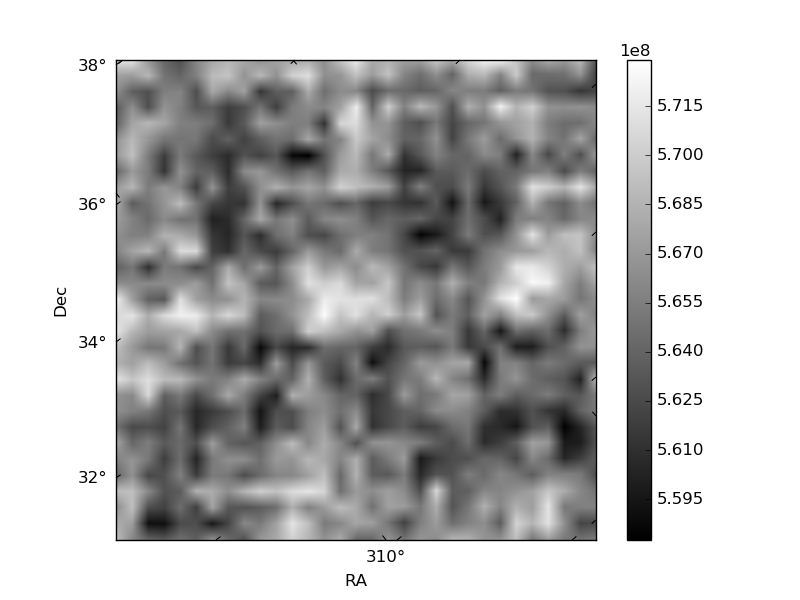
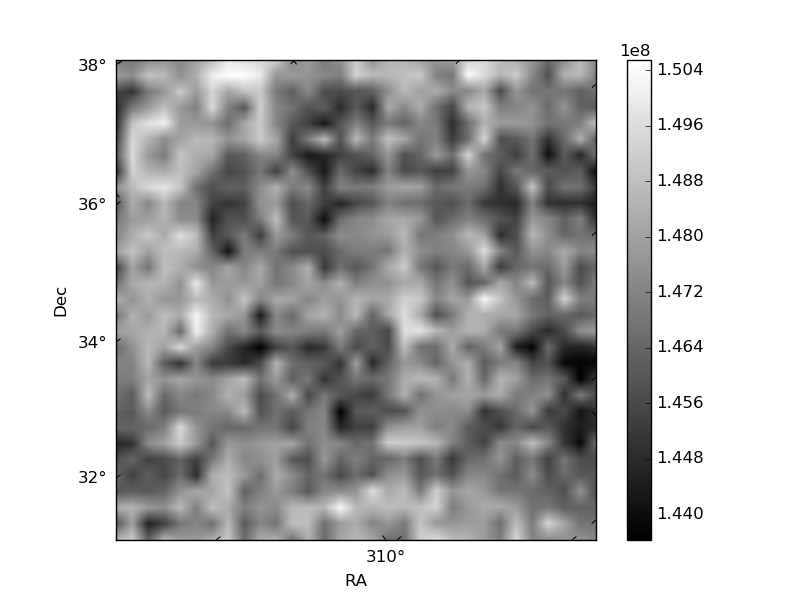
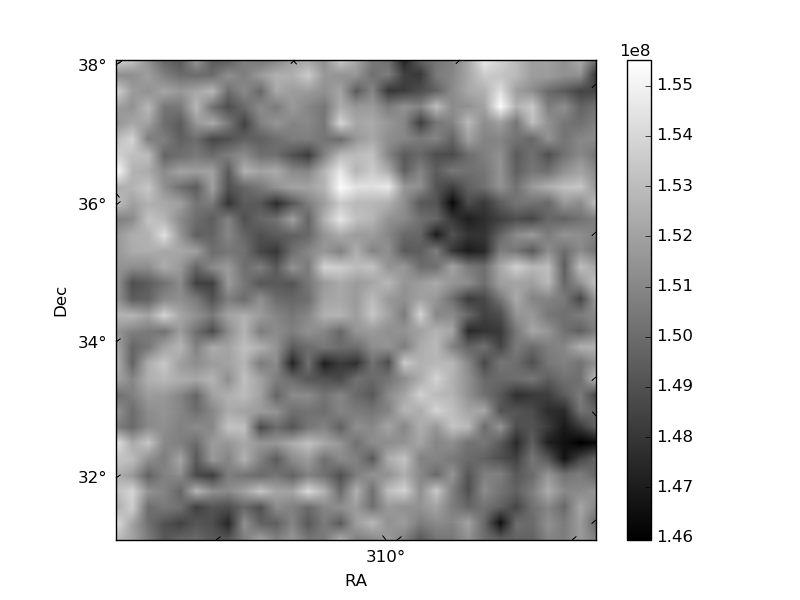
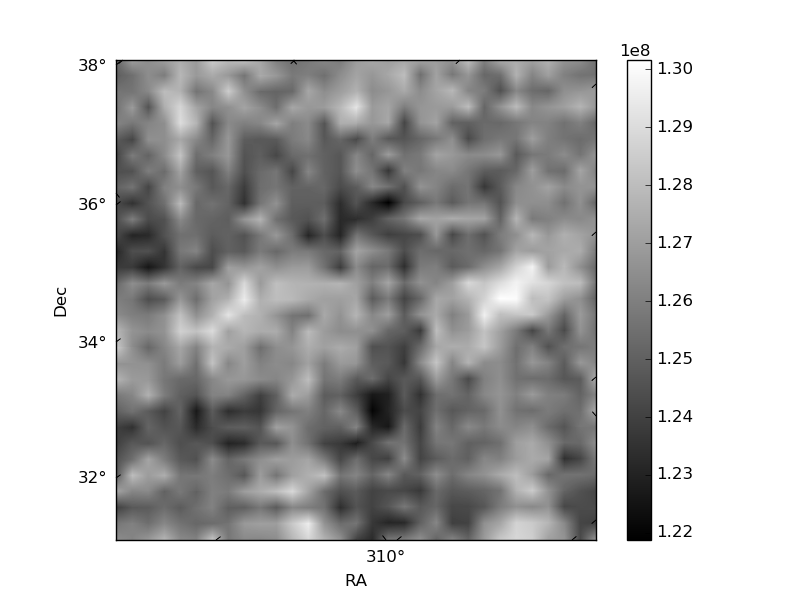
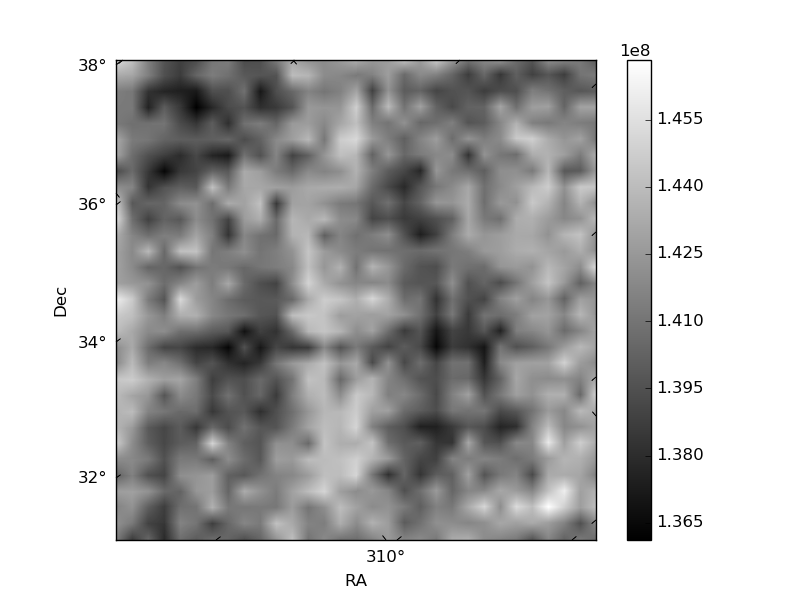
Histogram calculated using DETX and DETY for each event in the final _common_clean file
| Quadrant A | 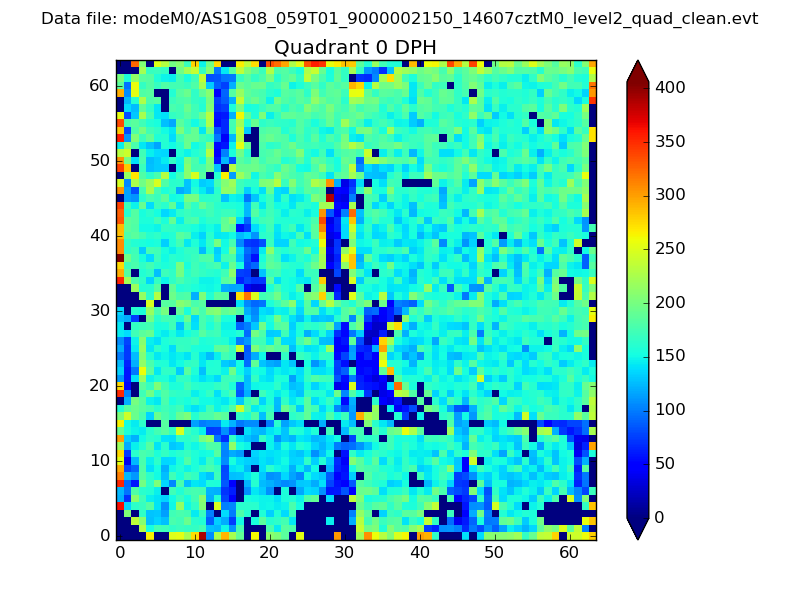 |
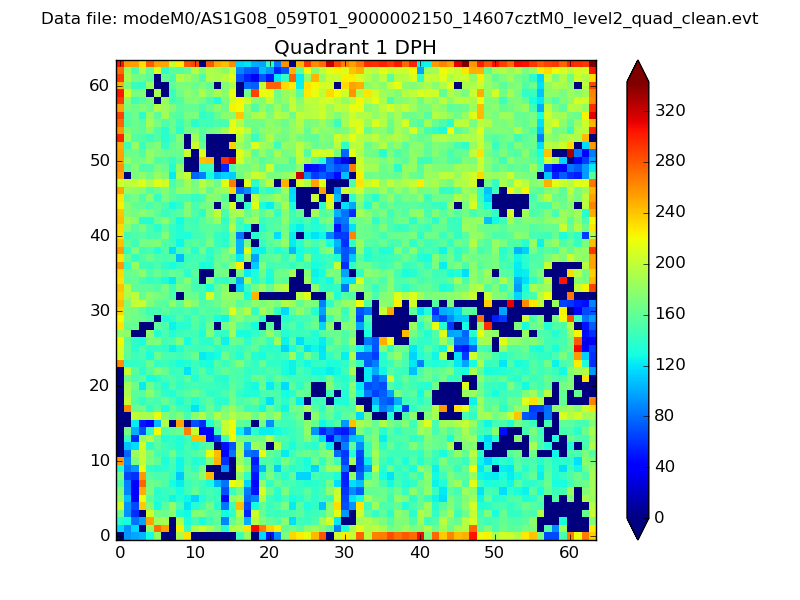 |
Quadrant B |
|---|---|---|---|
| Quadrant D | 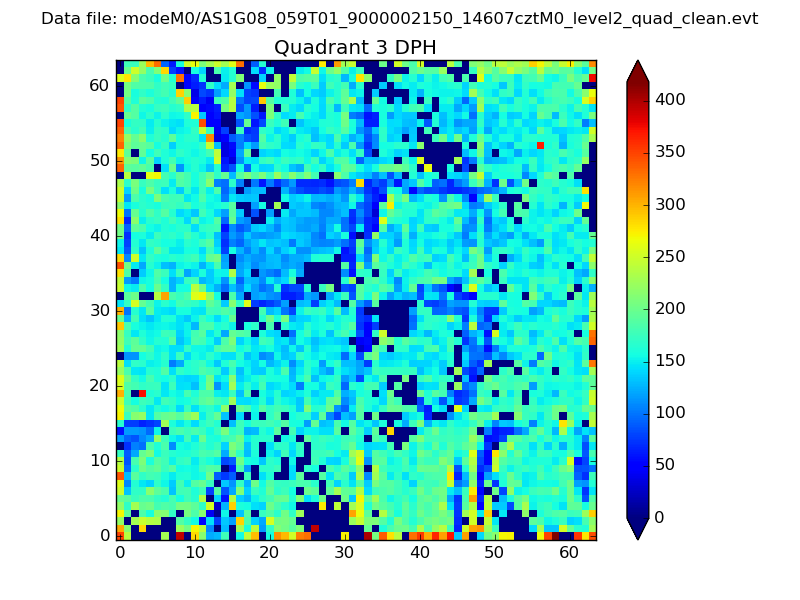 |
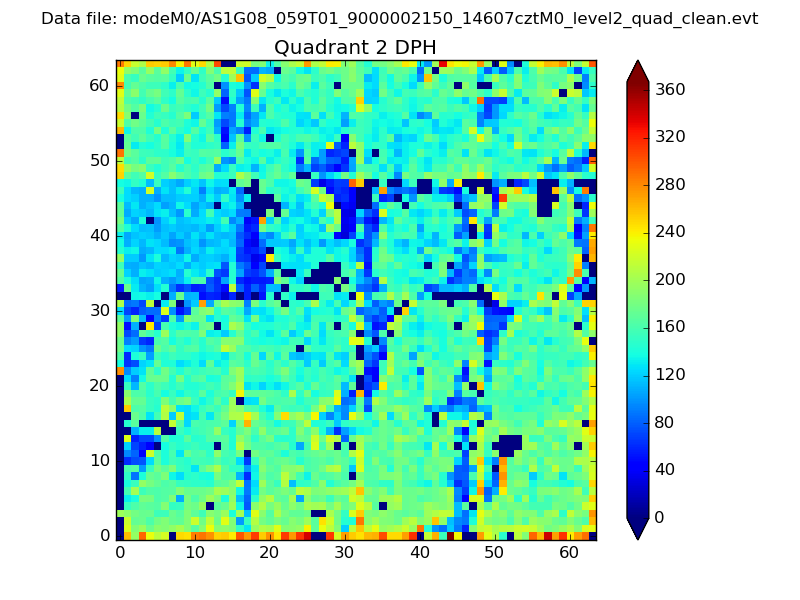 |
Quadrant C |
| Plot type | Count rate plots | Images |
|---|---|---|
| Comparison with Poisson distribution Blue bars denote a histogram of data divided into 1 sec bins. Red curve is a Poisson curve with rate = median count rate of data. |
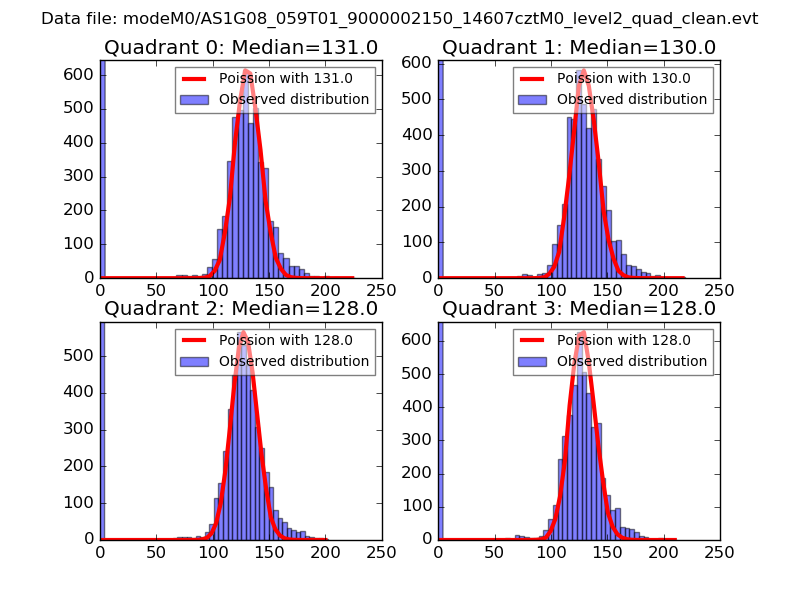 |
 |
| Quadrant-wise count rates Data is divided into 100 sec bins |
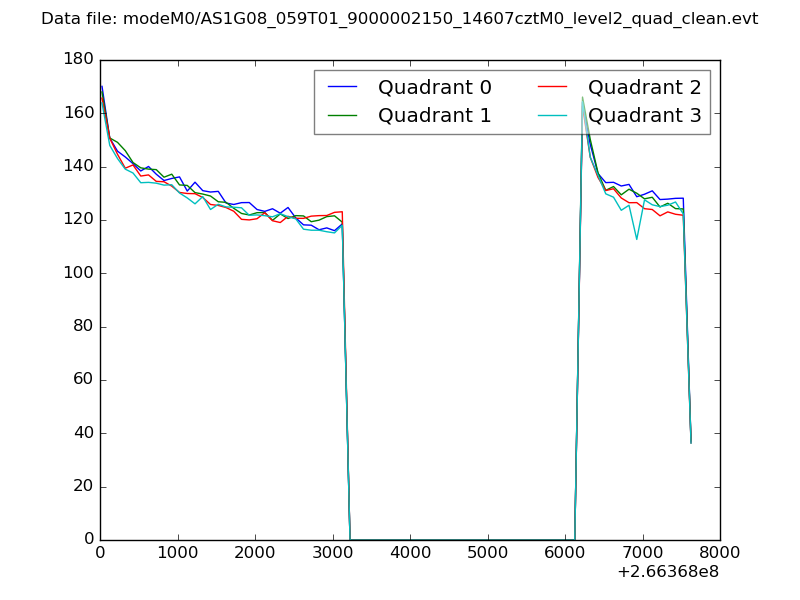 |
|
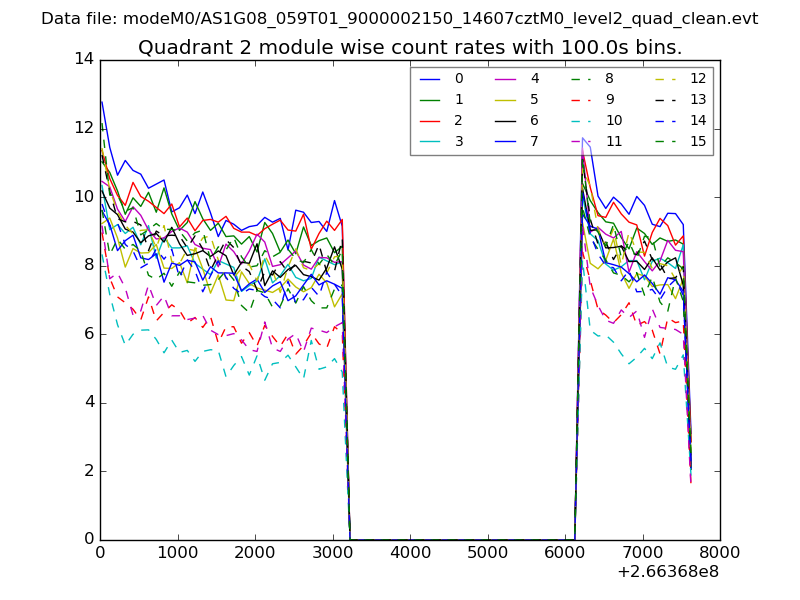
| Module-wise count rates for Quadrant A Data is divided into 100 sec bins |
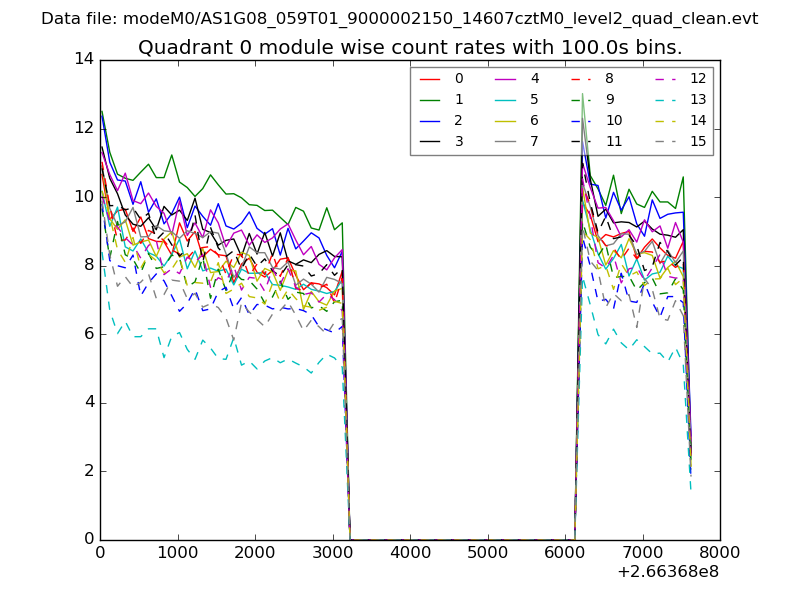 |
 |
| Module-wise count rates for Quadrant B Data is divided into 100 sec bins |
 |
 |
| Module-wise count rates for Quadrant C Data is divided into 100 sec bins |
 |
 |
| Module-wise count rates for Quadrant D Data is divided into 100 sec bins |
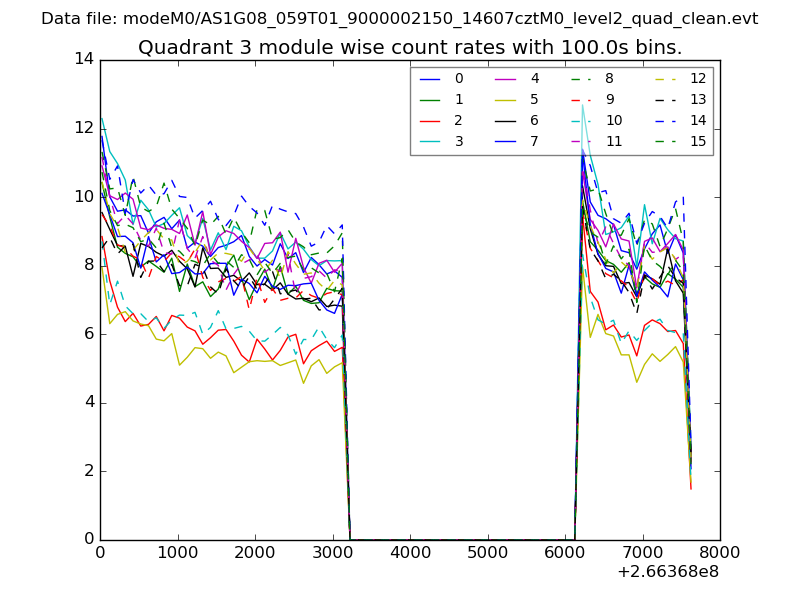 |
 |
| Parameter | Plot |
|---|---|
| CZT HV Monitor |  |
| D_VDD | 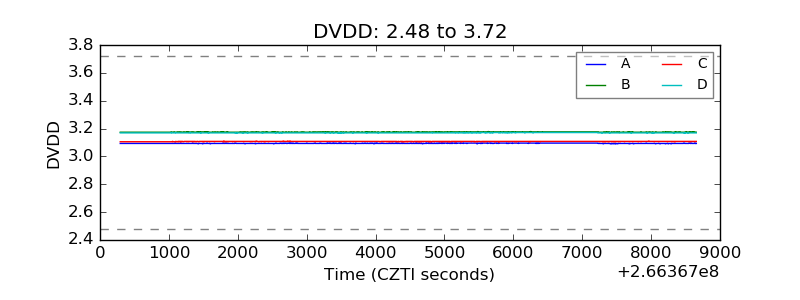 |
| Temperature 1 | 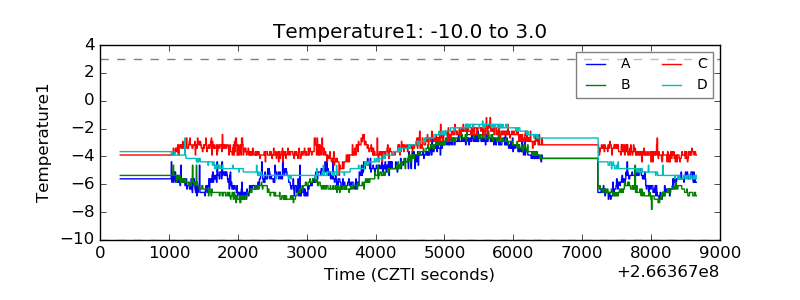 |
| Veto HV Monitor | 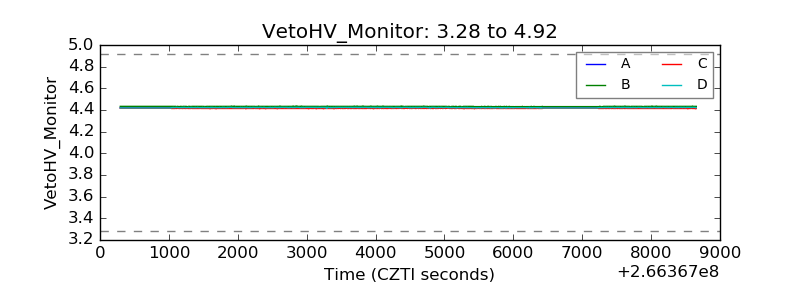 |
| Veto LLD | 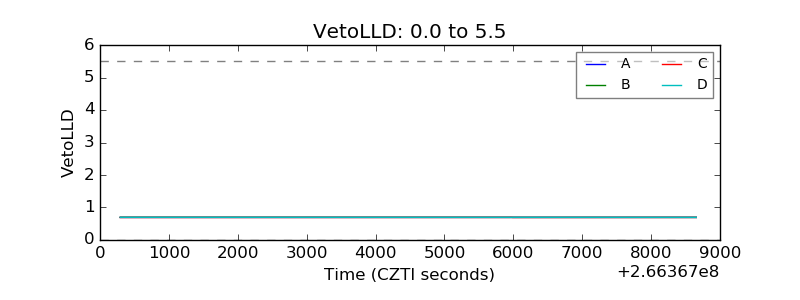 |
| Alpha Counter | 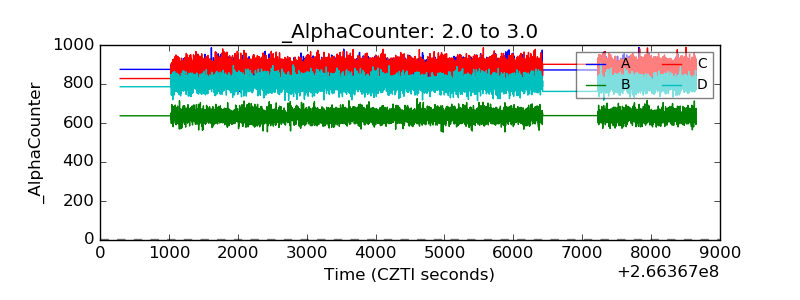 |
| _CPM_Rate | 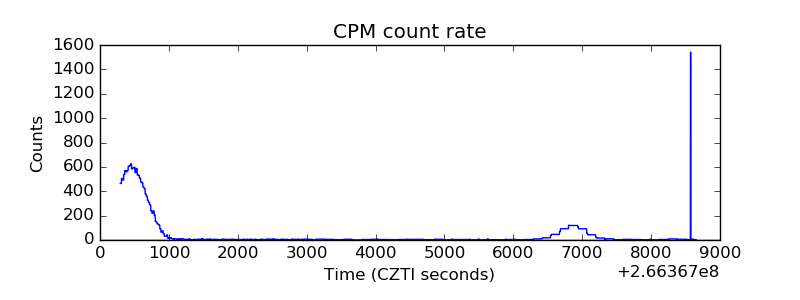 |
| CZT Counter | 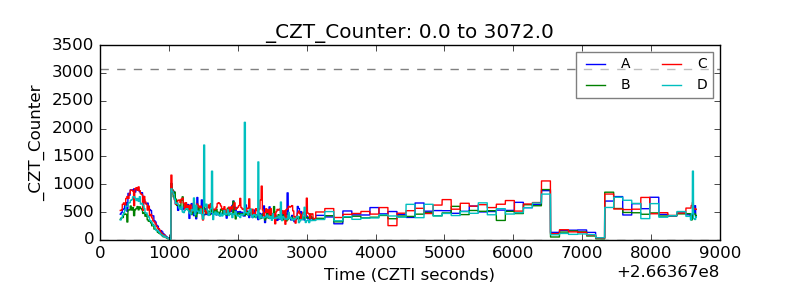 |
| +2.5 Volts monitor |  |
| +5 Volts monitor |  |
| _ROLL_ROT | 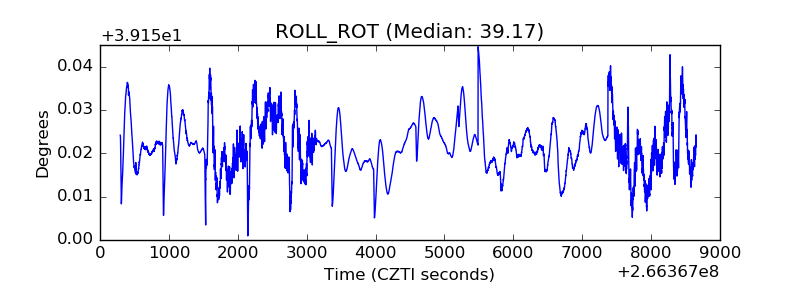 |
| _Roll_DEC | 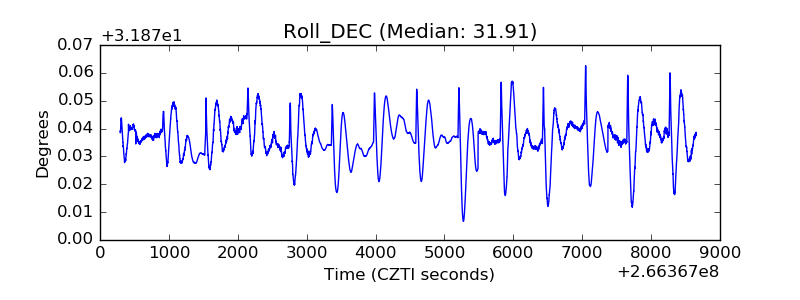 |
| _Roll_RA | 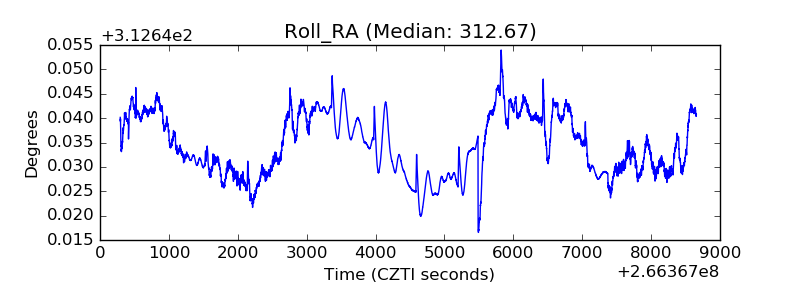 |
| Veto Counter | 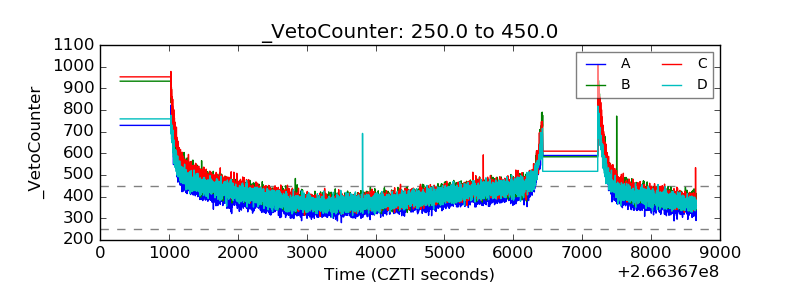 |