| Param | Original file | Final file |
|---|---|---|
| Filename | modeM0/AS1G08_059T01_9000002150_14608cztM0_level2.evt | modeM0/AS1G08_059T01_9000002150_14608cztM0_level2_quad_clean.evt |
| Size (bytes) | 548,438,400 | 102,792,960 |
| Size | 523.0 MB | 98.0 MB |
| Events in quadrant A | 3,871,957 | 664,139 |
| Events in quadrant B | 3,596,537 | 658,494 |
| Events in quadrant C | 4,488,708 | 645,443 |
| Events in quadrant D | 4,152,871 | 632,506 |
| Mode M0 | |||
|---|---|---|---|
| Quadrant | BADHDUFLAG | Total packets | Discarded packets |
| A | 0 | 16468 | 3 |
| B | 0 | 15554 | 2 |
| C | 0 | 18175 | 2 |
| D | 0 | 17587 | 2 |
| Mode M9 | |||
|---|---|---|---|
| Quadrant | BADHDUFLAG | Total packets | Discarded packets |
| A | 0 | 7 | 0 |
| B | 0 | 7 | 0 |
| C | 0 | 7 | 0 |
| D | 0 | 8 | 0 |
| Mode SS | |||
|---|---|---|---|
| Quadrant | BADHDUFLAG | Total packets | Discarded packets |
| A | 0 | 150 | 0 |
| B | 0 | 150 | 0 |
| C | 0 | 150 | 0 |
| D | 0 | 150 | 0 |
| Quadrant | Total seconds | Saturated seconds | Saturation percentage |
|---|---|---|---|
| A | 7358 | 118 | 1.603697% |
| B | 7358 | 131 | 1.780375% |
| C | 7358 | 85 | 1.155205% |
| D | 7358 | 276 | 3.751019% |
Noise dominated data is calculated using 1-second bins in cleaned event files. If a bin has >2000 counts, and if more than 50% of those come from <1% of pixels, then it is considered to be noise-dominated and hence unusable.
| Quadrant | # 1 sec bins | Bins with >0 counts | Bins with >2000 counts | High rate bins dominated by noise | Noise dominated (total time) | Noise dominated (detector-on time) | Marked lightcurve |
|---|---|---|---|---|---|---|---|
| A | 7784 | 7361 | 1 | 1 | 0.01% | 0.01% | 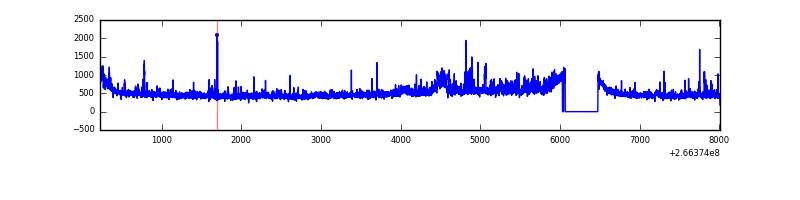 |
| B | 7784 | 7361 | 3 | 3 | 0.04% | 0.04% | 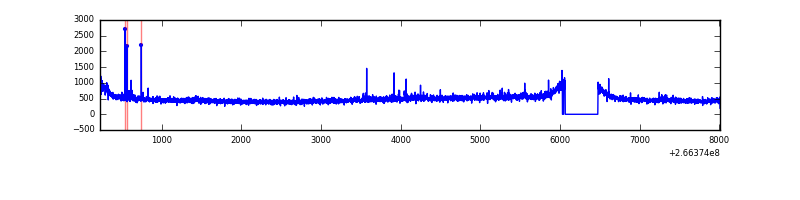 |
| C | 7784 | 7361 | 0 | 0 | 0.00% | 0.00% | 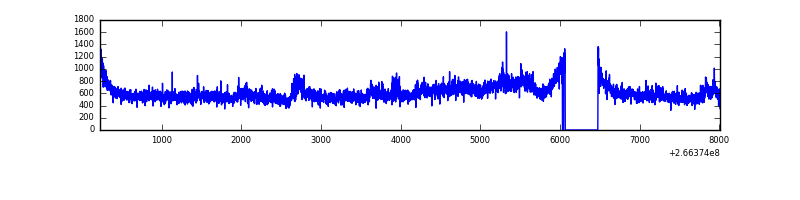 |
| D | 7784 | 7361 | 222 | 222 | 2.85% | 3.02% | 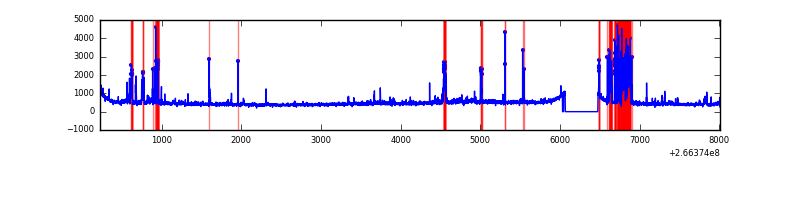 |
Top three noisy pixels from each quadrant. If the there are fewer than three noisy pixels in the level2.evt file, extra rows are filled as -1
| Pixel properties | Quadrant properties | ||||||
|---|---|---|---|---|---|---|---|
| Quadrant | DetID | PixID | Counts | Sigma | Mean | Median | Sigma |
| A | 1 | 162 | 137770 | 745.68 | 895 | 875 | 183.6 |
| A | 0 | 23 | 76151 | 410.04 | 895 | 875 | 183.6 |
| A | 8 | 15 | 61522 | 330.35 | 895 | 875 | 183.6 |
| B | 0 | 214 | 23159 | 128.27 | 895 | 872 | 173.7 |
| B | 0 | 189 | 22879 | 126.66 | 895 | 872 | 173.7 |
| B | 0 | 229 | 22736 | 125.84 | 895 | 872 | 173.7 |
| C | 3 | 233 | 1085908 | 5299.24 | 873 | 877 | 204.8 |
| C | 13 | 61 | 6340 | 26.68 | 873 | 877 | 204.8 |
| C | 3 | 232 | 2170 | 6.31 | 873 | 877 | 204.8 |
| D | 10 | 199 | 560831 | 2743.13 | 857 | 836 | 204.1 |
| D | 12 | 110 | 183732 | 895.91 | 857 | 836 | 204.1 |
| D | 2 | 152 | 54758 | 264.13 | 857 | 836 | 204.1 |
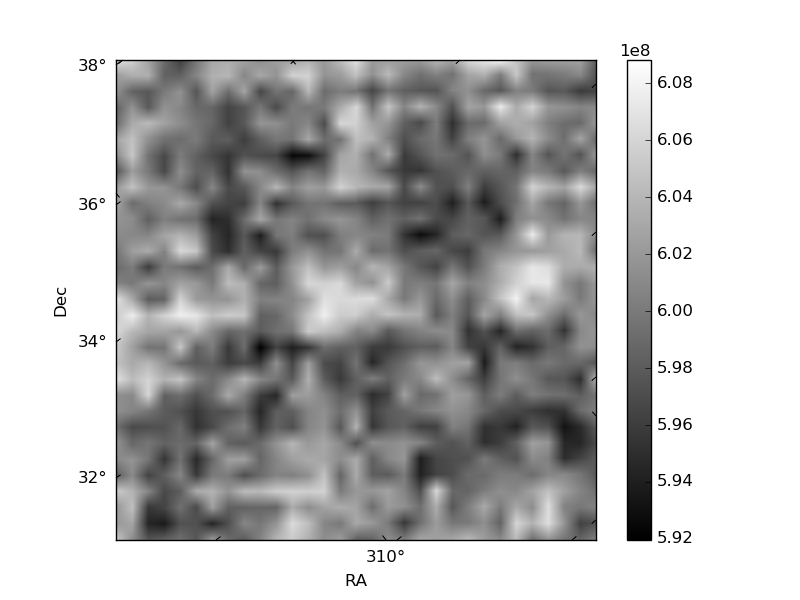
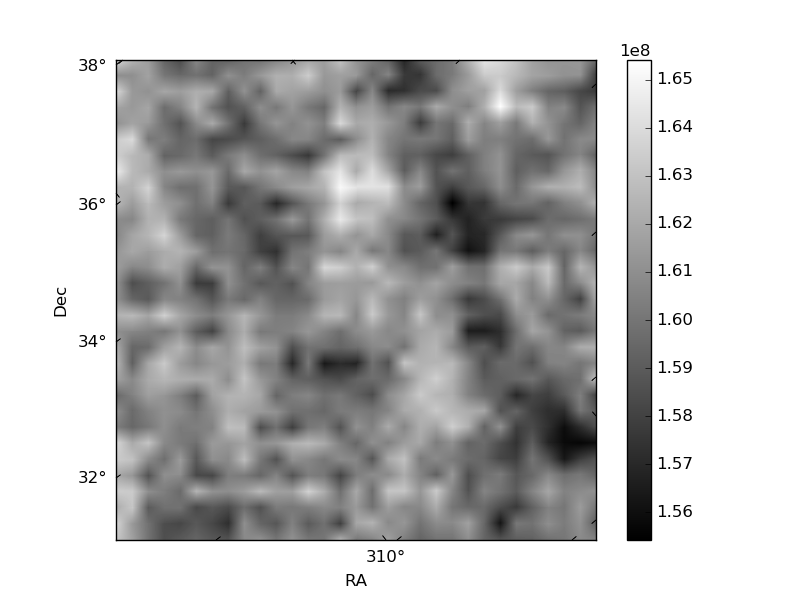
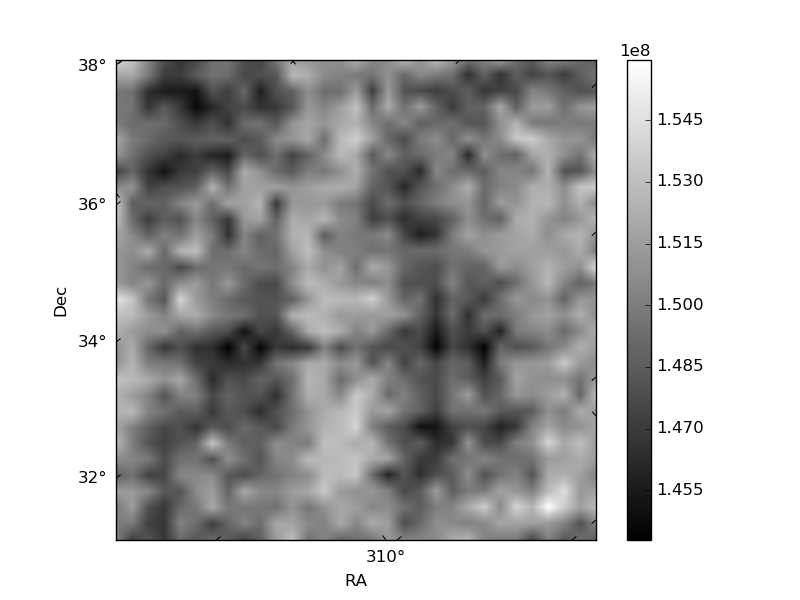
Histogram calculated using DETX and DETY for each event in the final _common_clean file
| Quadrant A | 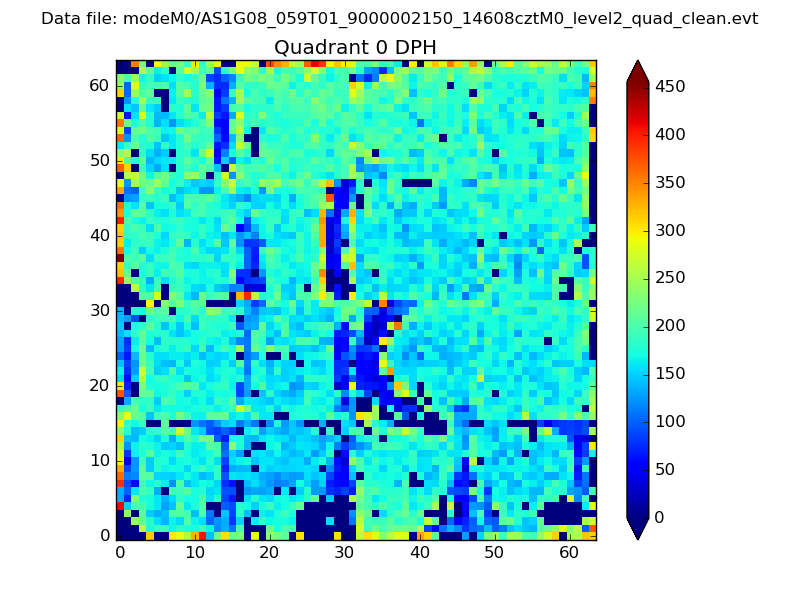 |
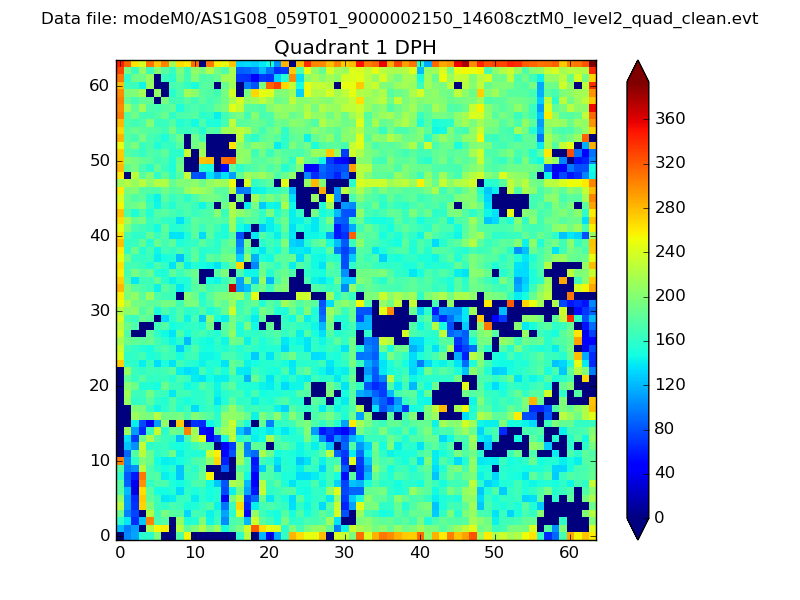 |
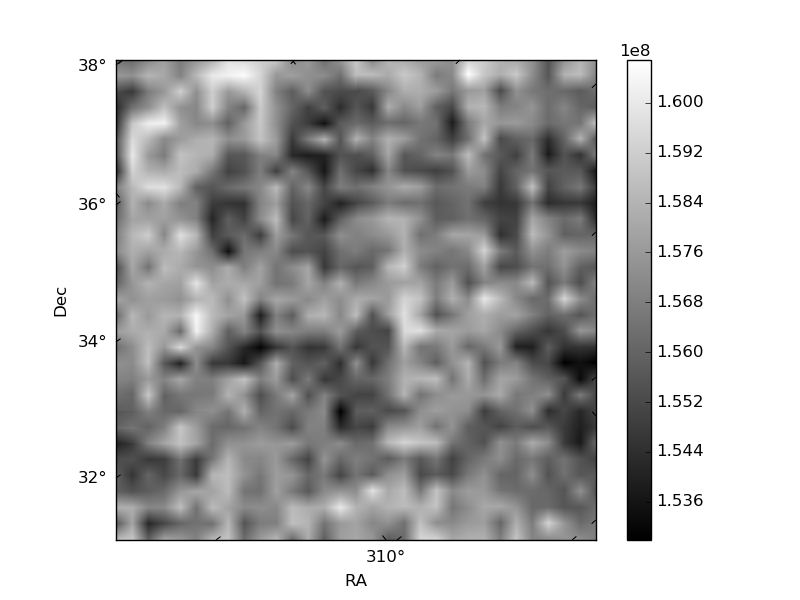
Quadrant B |
|---|---|---|---|
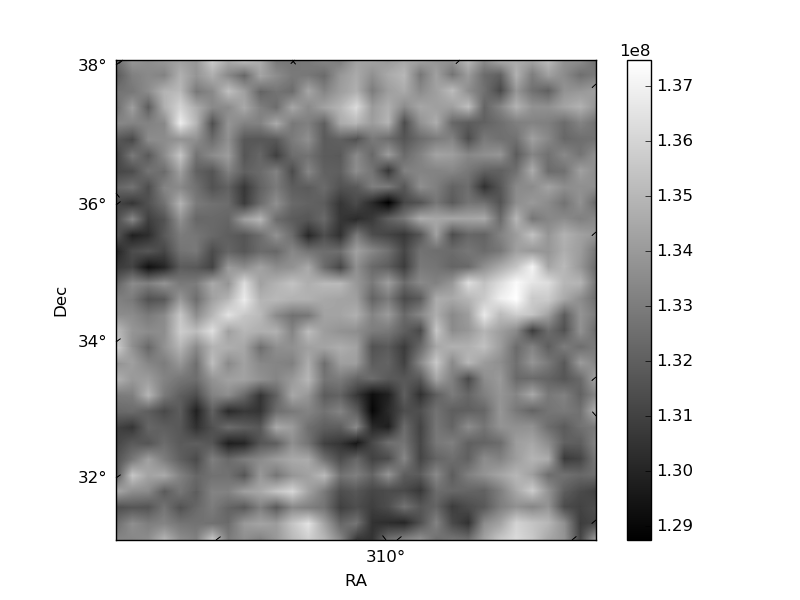
| Quadrant D | 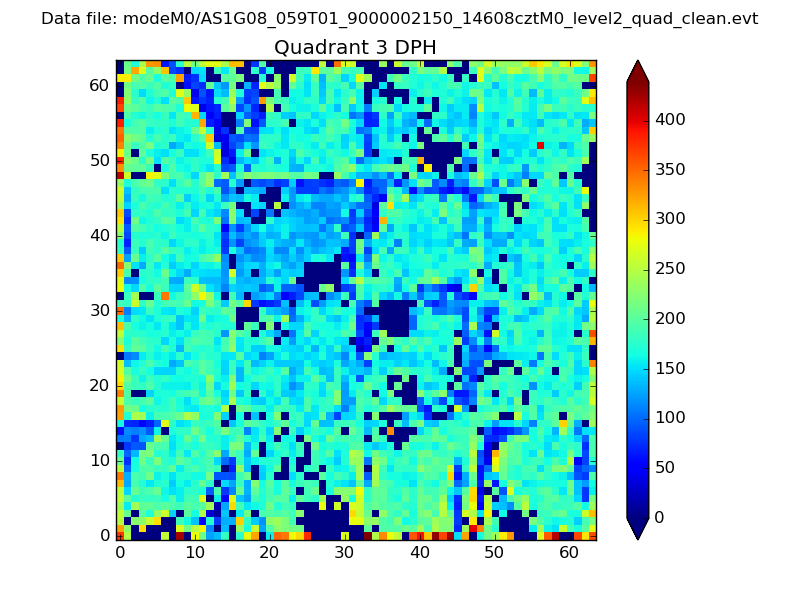 |
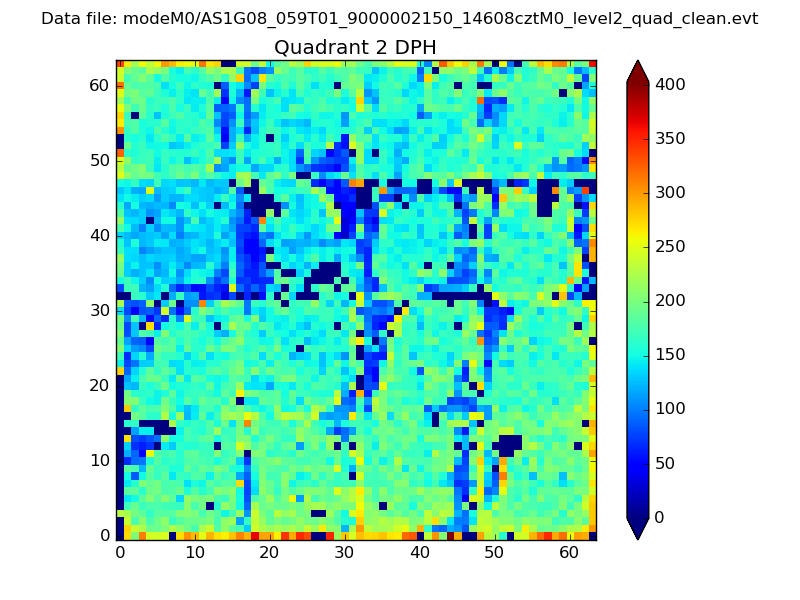 |
Quadrant C |
| Plot type | Count rate plots | Images |
|---|---|---|
| Comparison with Poisson distribution Blue bars denote a histogram of data divided into 1 sec bins. Red curve is a Poisson curve with rate = median count rate of data. |
 |
 |
| Quadrant-wise count rates Data is divided into 100 sec bins |
 |
|
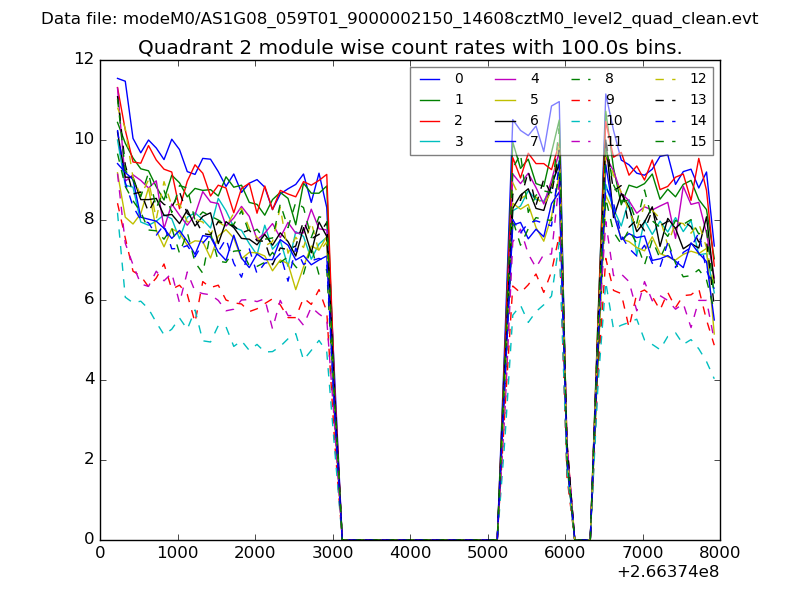
| Module-wise count rates for Quadrant A Data is divided into 100 sec bins |
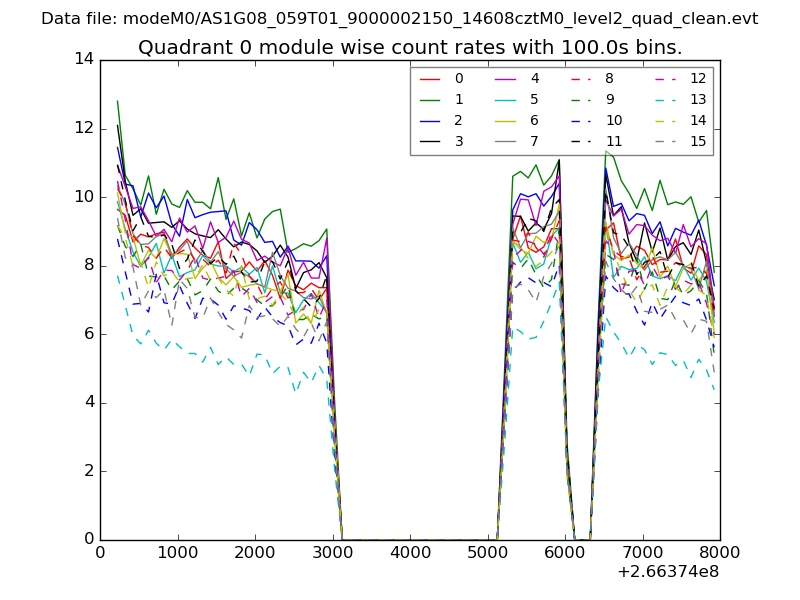 |
 |
| Module-wise count rates for Quadrant B Data is divided into 100 sec bins |
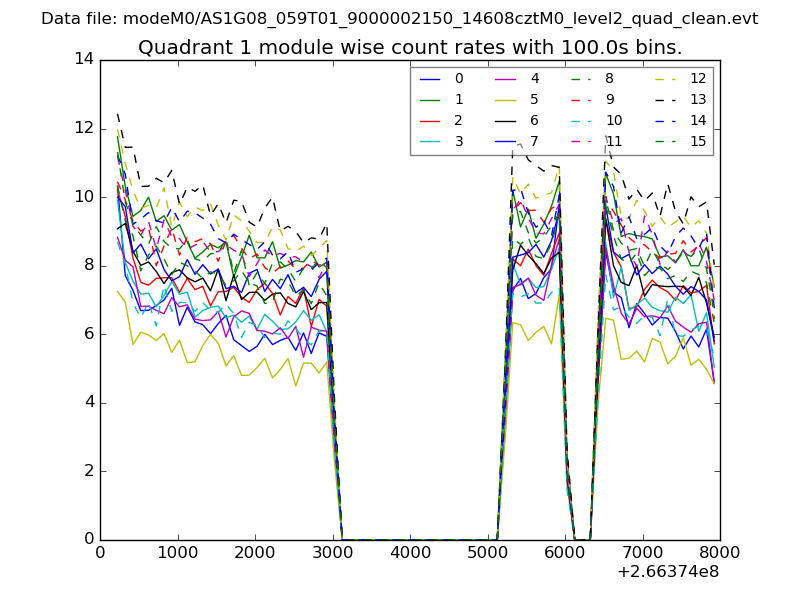 |
 |
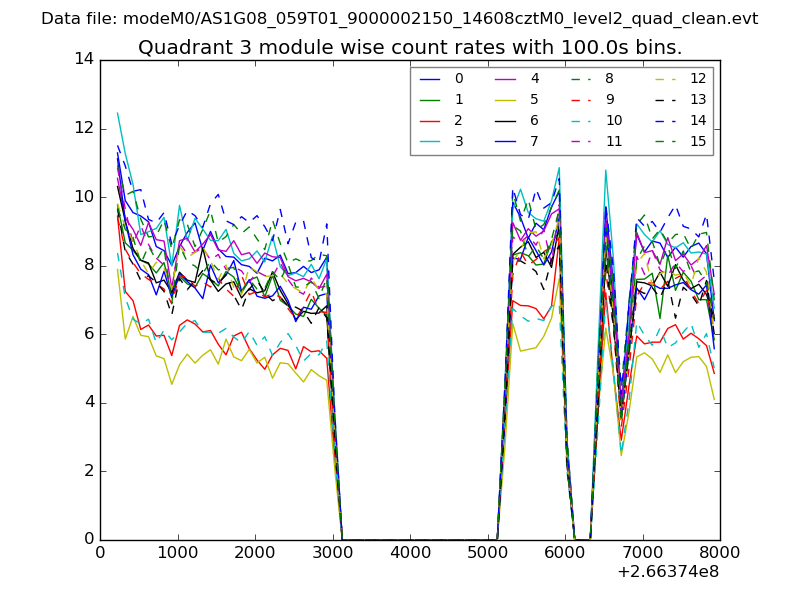
| Module-wise count rates for Quadrant C Data is divided into 100 sec bins |
 |
 |
| Module-wise count rates for Quadrant D Data is divided into 100 sec bins |
 |
 |
| Parameter | Plot |
|---|---|
| CZT HV Monitor | 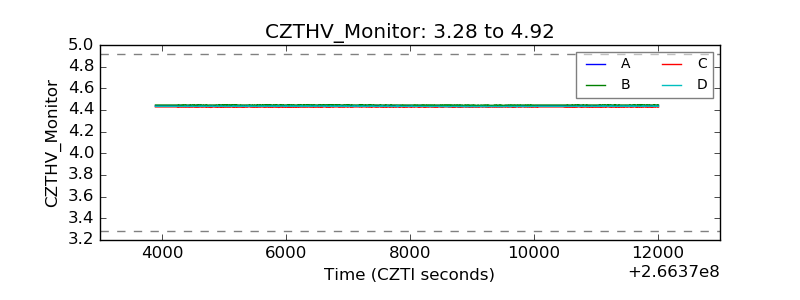 |
| D_VDD |  |
| Temperature 1 | 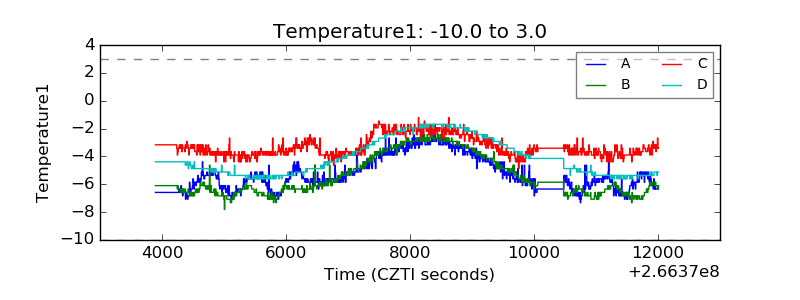 |
| Veto HV Monitor | 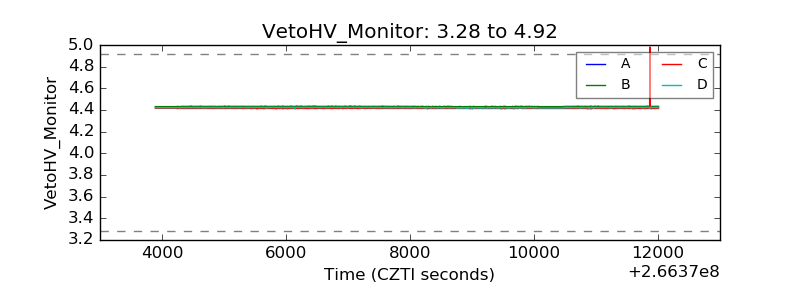 |
| Veto LLD | 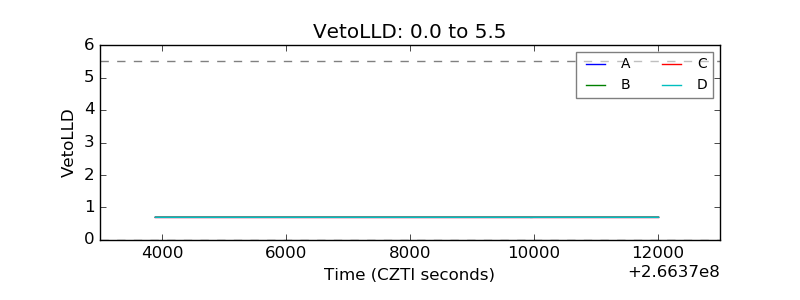 |
| Alpha Counter |  |
| _CPM_Rate |  |
| CZT Counter | 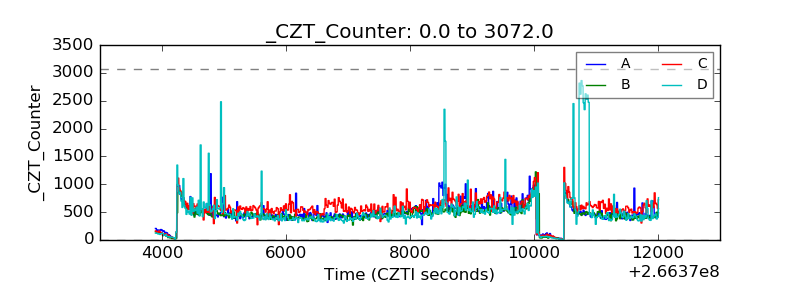 |
| +2.5 Volts monitor |  |
| +5 Volts monitor |  |
| _ROLL_ROT | 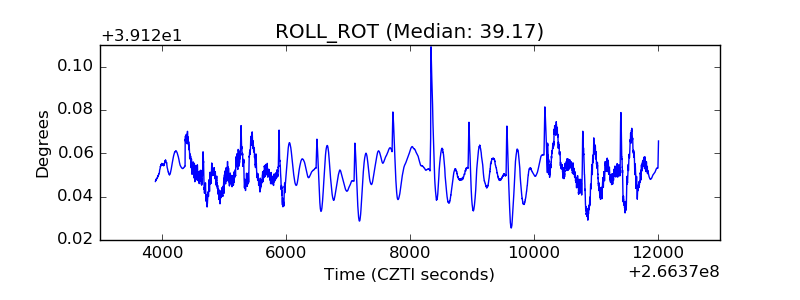 |
| _Roll_DEC | 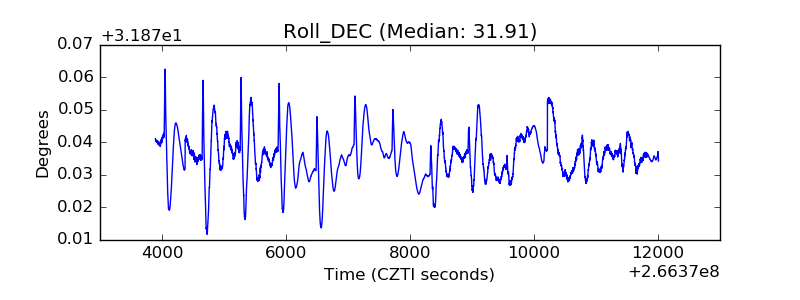 |
| _Roll_RA |  |
| Veto Counter | 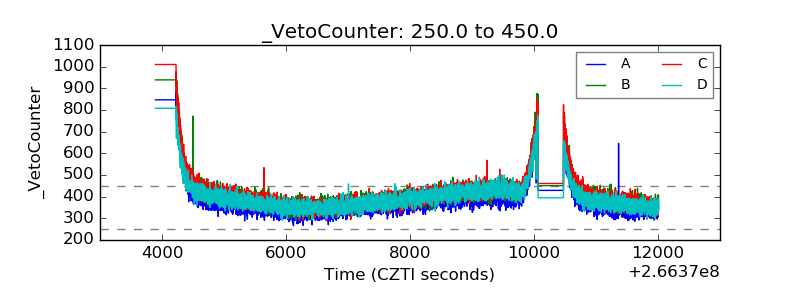 |