| Param | Original file | Final file |
|---|---|---|
| Filename | modeM0/AS1G08_059T01_9000002150_14609cztM0_level2.evt | modeM0/AS1G08_059T01_9000002150_14609cztM0_level2_quad_clean.evt |
| Size (bytes) | 553,435,200 | 106,416,000 |
| Size | 527.8 MB | 101.5 MB |
| Events in quadrant A | 3,898,853 | 683,522 |
| Events in quadrant B | 3,708,448 | 683,344 |
| Events in quadrant C | 4,526,452 | 668,727 |
| Events in quadrant D | 4,111,479 | 658,430 |
| Mode M0 | |||
|---|---|---|---|
| Quadrant | BADHDUFLAG | Total packets | Discarded packets |
| A | 0 | 16596 | 3 |
| B | 0 | 16094 | 2 |
| C | 0 | 18614 | 2 |
| D | 0 | 17519 | 2 |
| Mode M9 | |||
|---|---|---|---|
| Quadrant | BADHDUFLAG | Total packets | Discarded packets |
| A | 0 | 7 | 0 |
| B | 0 | 7 | 0 |
| C | 0 | 7 | 0 |
| D | 0 | 7 | 0 |
| Mode SS | |||
|---|---|---|---|
| Quadrant | BADHDUFLAG | Total packets | Discarded packets |
| A | 0 | 156 | 0 |
| B | 0 | 156 | 0 |
| C | 0 | 156 | 0 |
| D | 0 | 156 | 0 |
| Quadrant | Total seconds | Saturated seconds | Saturation percentage |
|---|---|---|---|
| A | 7599 | 127 | 1.671273% |
| B | 7599 | 161 | 2.118700% |
| C | 7599 | 74 | 0.973812% |
| D | 7599 | 252 | 3.316226% |
Noise dominated data is calculated using 1-second bins in cleaned event files. If a bin has >2000 counts, and if more than 50% of those come from <1% of pixels, then it is considered to be noise-dominated and hence unusable.
| Quadrant | # 1 sec bins | Bins with >0 counts | Bins with >2000 counts | High rate bins dominated by noise | Noise dominated (total time) | Noise dominated (detector-on time) | Marked lightcurve |
|---|---|---|---|---|---|---|---|
| A | 8290 | 7604 | 1 | 1 | 0.01% | 0.01% | 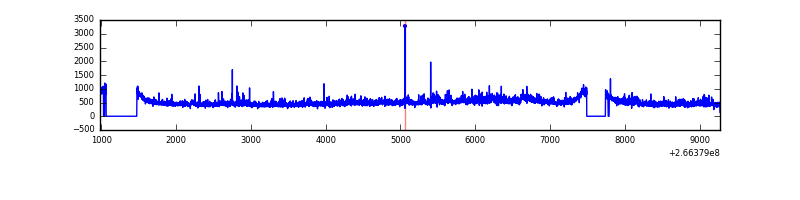 |
| B | 8290 | 7604 | 3 | 3 | 0.04% | 0.04% | 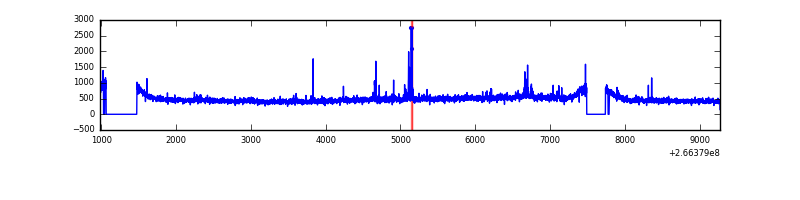 |
| C | 8290 | 7604 | 0 | 0 | 0.00% | 0.00% | 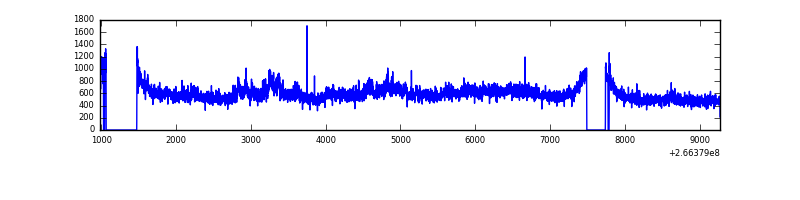 |
| D | 8290 | 7604 | 188 | 188 | 2.27% | 2.47% | 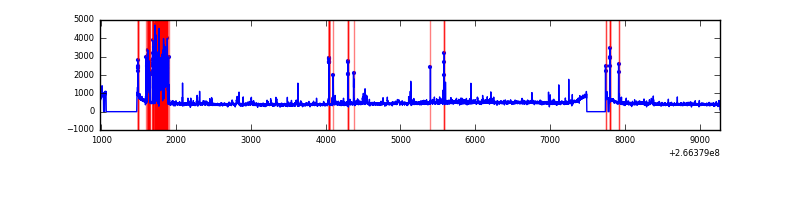 |
Top three noisy pixels from each quadrant. If the there are fewer than three noisy pixels in the level2.evt file, extra rows are filled as -1
| Pixel properties | Quadrant properties | ||||||
|---|---|---|---|---|---|---|---|
| Quadrant | DetID | PixID | Counts | Sigma | Mean | Median | Sigma |
| A | 1 | 162 | 133356 | 703.76 | 918 | 897 | 188.2 |
| A | 1 | 178 | 51282 | 267.7 | 918 | 897 | 188.2 |
| A | 1 | 161 | 46713 | 243.42 | 918 | 897 | 188.2 |
| B | 10 | 247 | 31024 | 169.21 | 915 | 892 | 178.1 |
| B | 0 | 214 | 28303 | 153.93 | 915 | 892 | 178.1 |
| B | 12 | 111 | 21282 | 114.5 | 915 | 892 | 178.1 |
| C | 3 | 233 | 1048027 | 5063.45 | 889 | 893 | 206.8 |
| C | 13 | 61 | 6334 | 26.31 | 889 | 893 | 206.8 |
| C | 8 | 128 | 4654 | 18.19 | 889 | 893 | 206.8 |
| D | 10 | 199 | 611357 | 2915.36 | 879 | 857 | 209.4 |
| D | 2 | 152 | 54363 | 255.51 | 879 | 857 | 209.4 |
| D | 12 | 110 | 40336 | 188.53 | 879 | 857 | 209.4 |
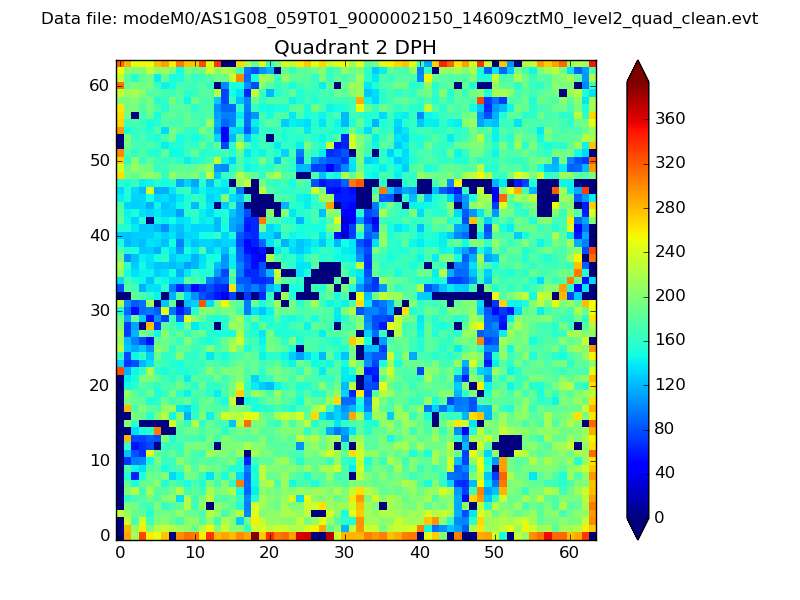
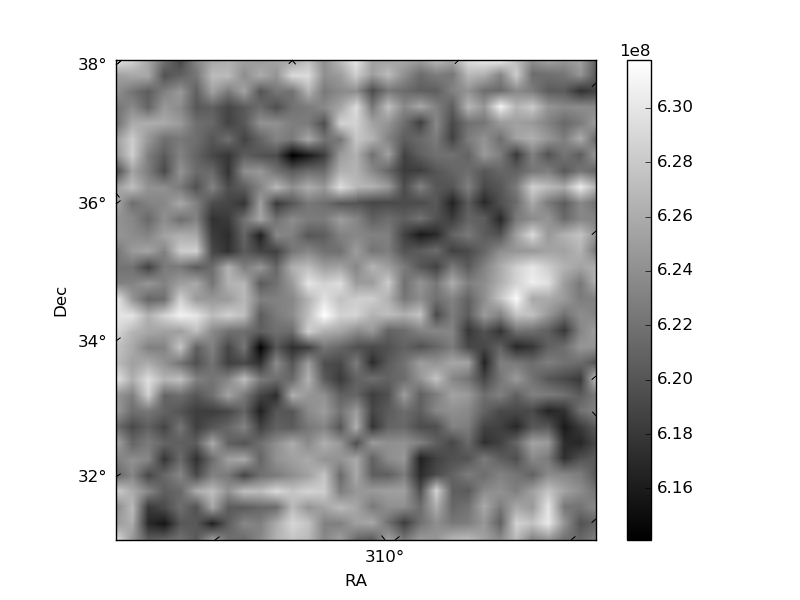
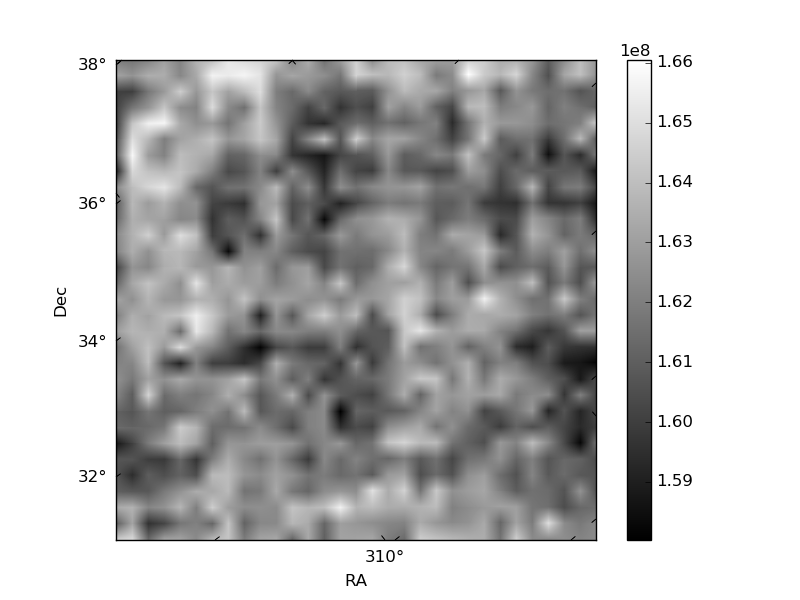
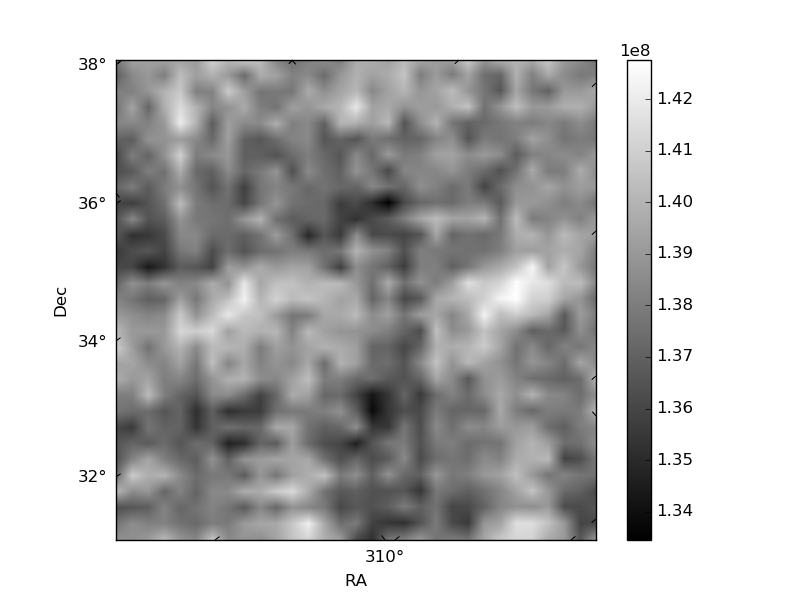
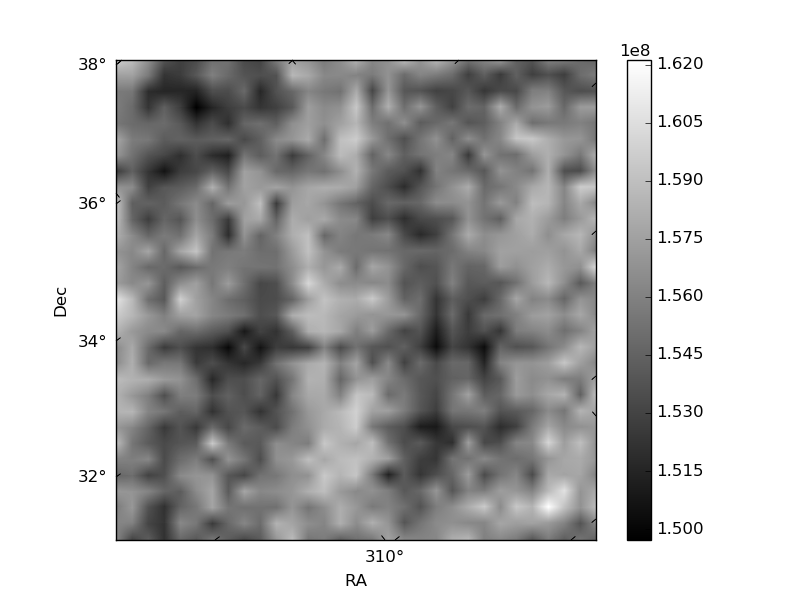
Histogram calculated using DETX and DETY for each event in the final _common_clean file
| Quadrant A | 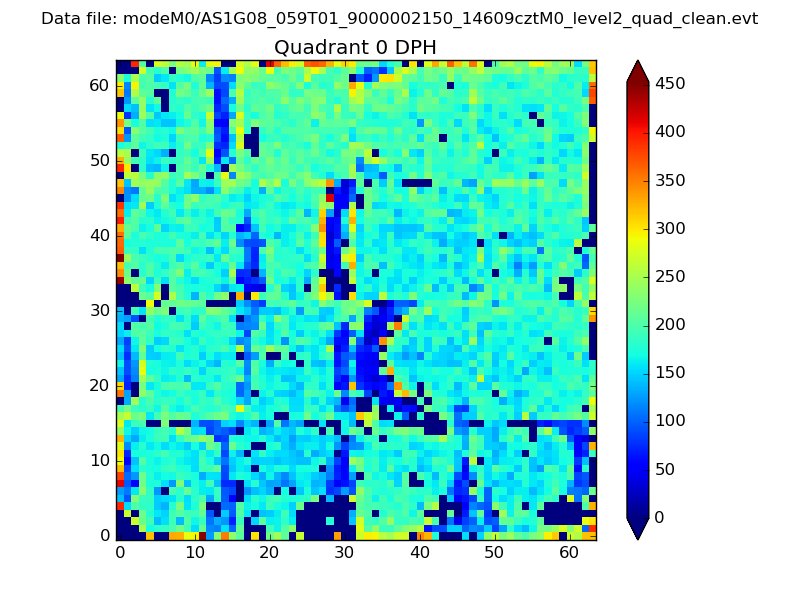 |
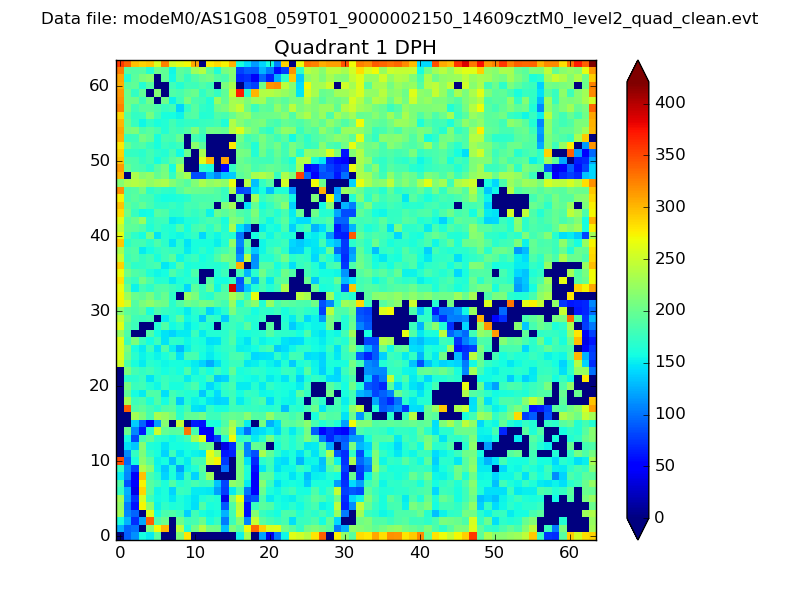 |
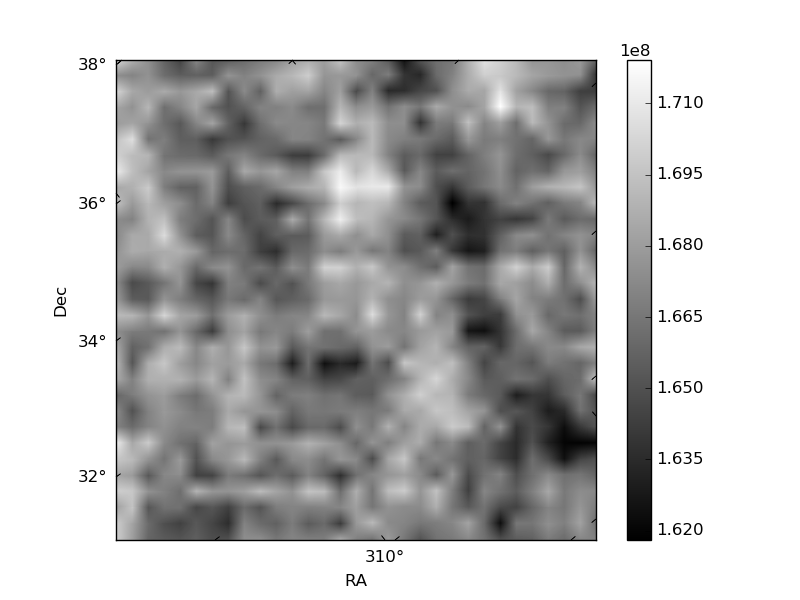
Quadrant B |
|---|---|---|---|
| Quadrant D | 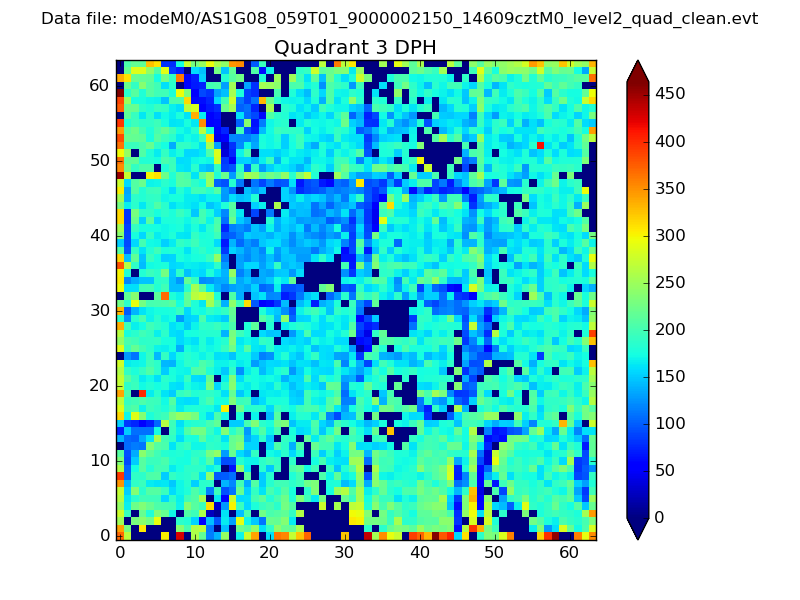 |
 |
Quadrant C |
| Plot type | Count rate plots | Images |
|---|---|---|
| Comparison with Poisson distribution Blue bars denote a histogram of data divided into 1 sec bins. Red curve is a Poisson curve with rate = median count rate of data. |
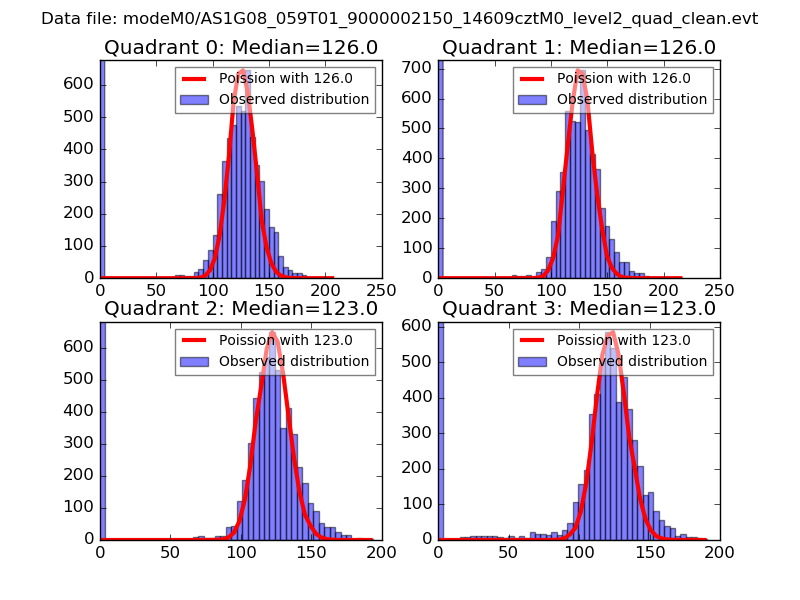 |
 |
| Quadrant-wise count rates Data is divided into 100 sec bins |
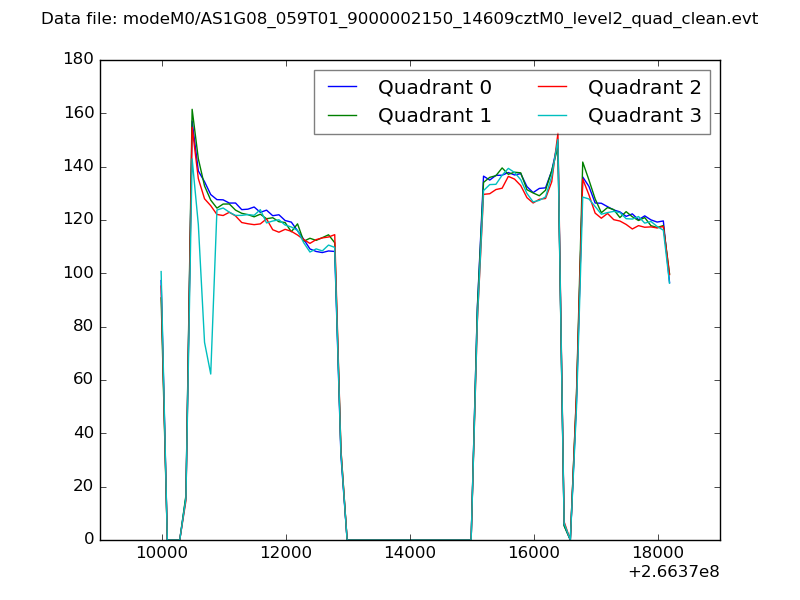 |
|
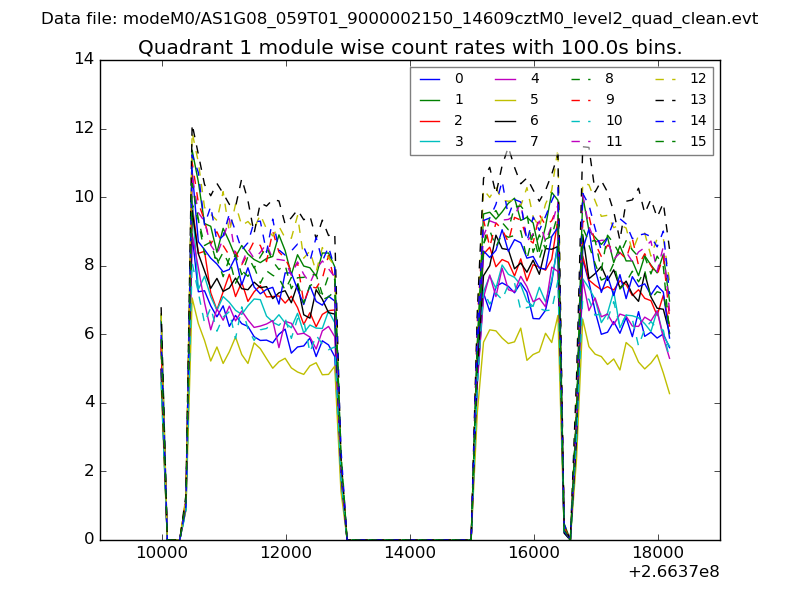
| Module-wise count rates for Quadrant A Data is divided into 100 sec bins |
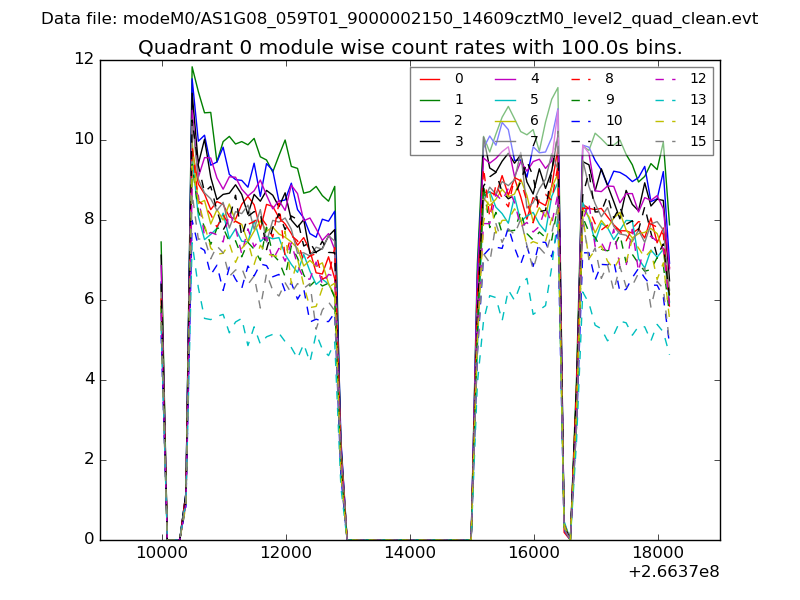 |
 |
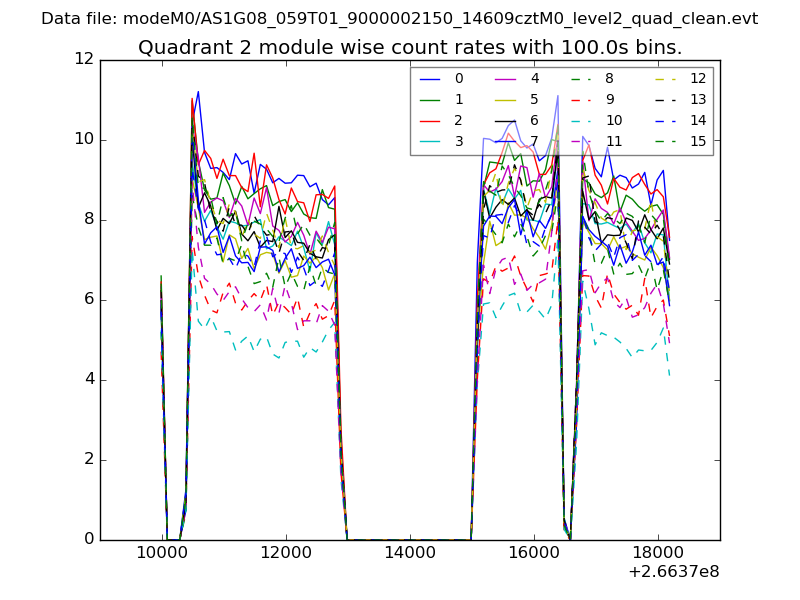
| Module-wise count rates for Quadrant B Data is divided into 100 sec bins |
 |
 |
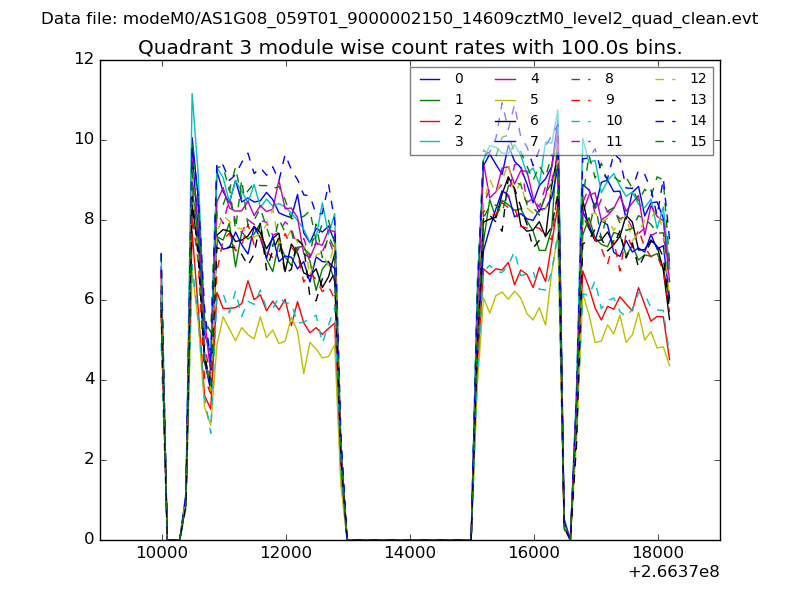
| Module-wise count rates for Quadrant C Data is divided into 100 sec bins |
 |
 |
| Module-wise count rates for Quadrant D Data is divided into 100 sec bins |
 |
 |
| Parameter | Plot |
|---|---|
| CZT HV Monitor | 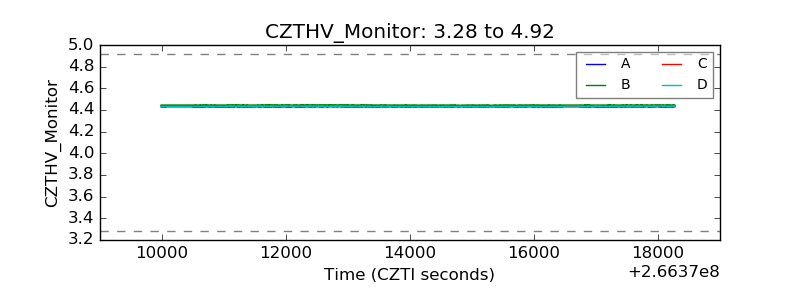 |
| D_VDD | 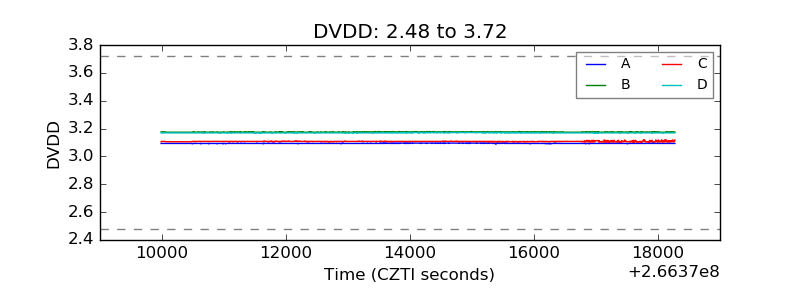 |
| Temperature 1 | 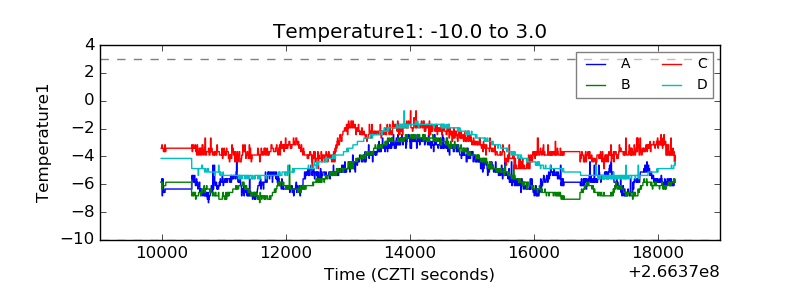 |
| Veto HV Monitor | 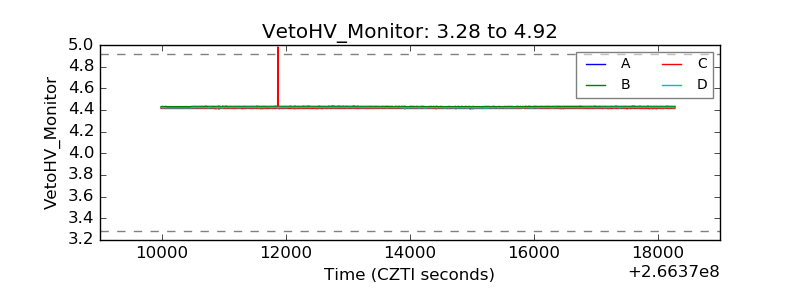 |
| Veto LLD | 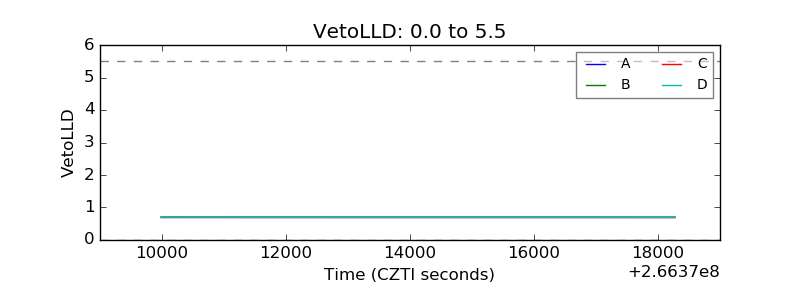 |
| Alpha Counter | 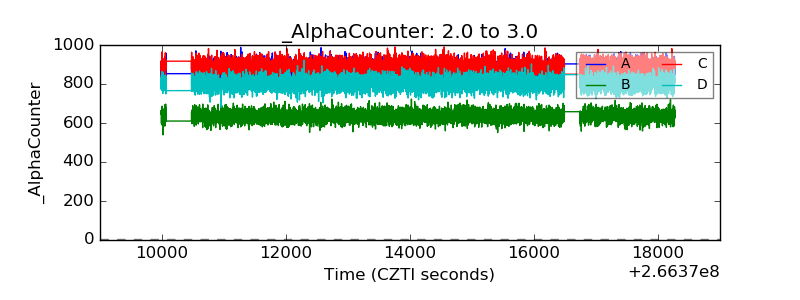 |
| _CPM_Rate | 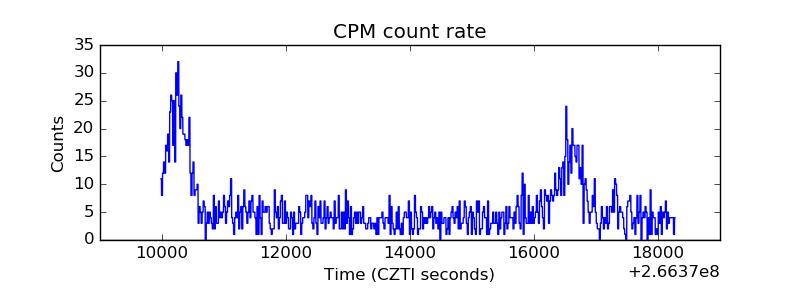 |
| CZT Counter | 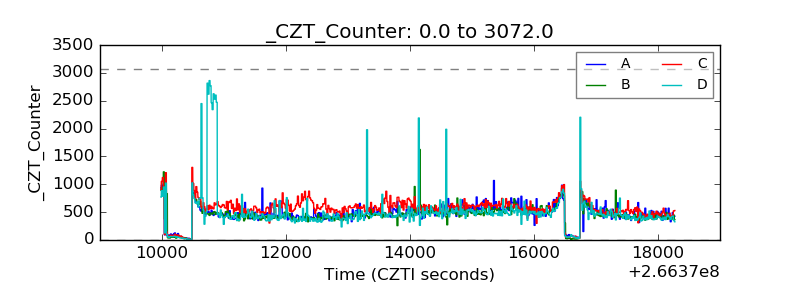 |
| +2.5 Volts monitor |  |
| +5 Volts monitor | 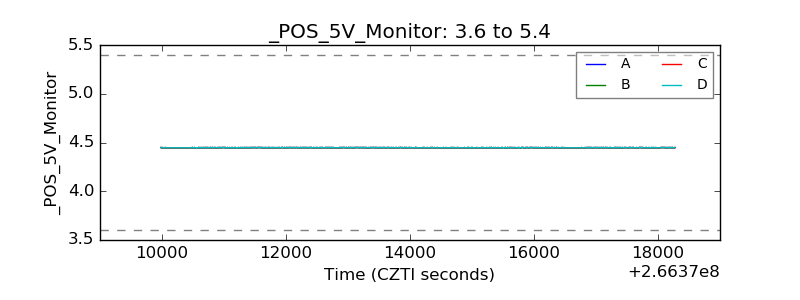 |
| _ROLL_ROT | 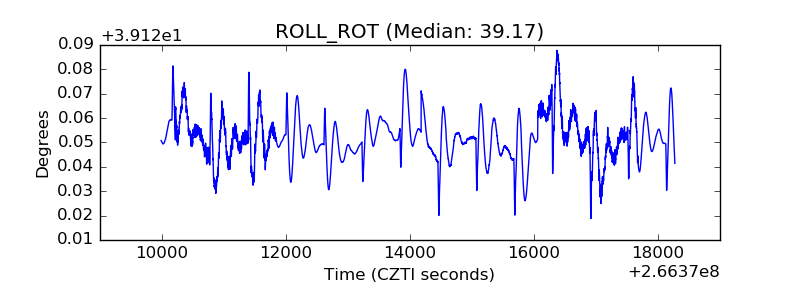 |
| _Roll_DEC | 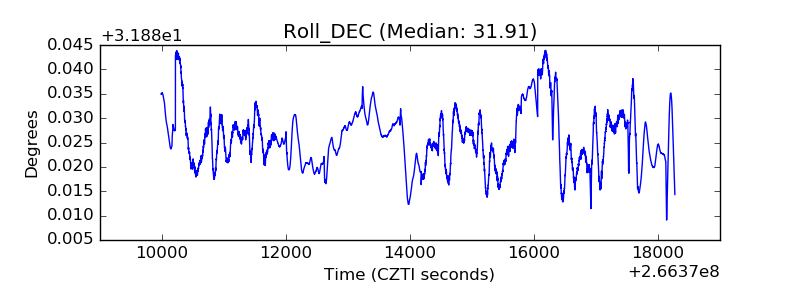 |
| _Roll_RA | 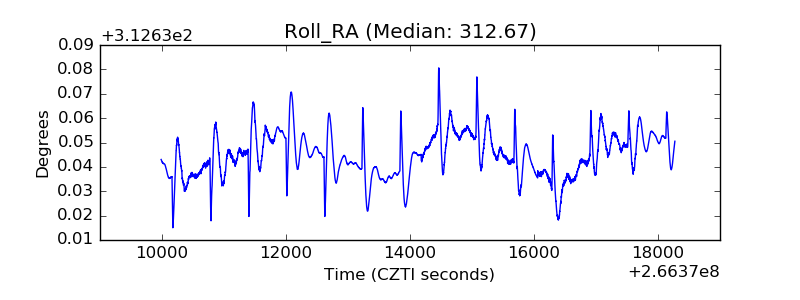 |
| Veto Counter | 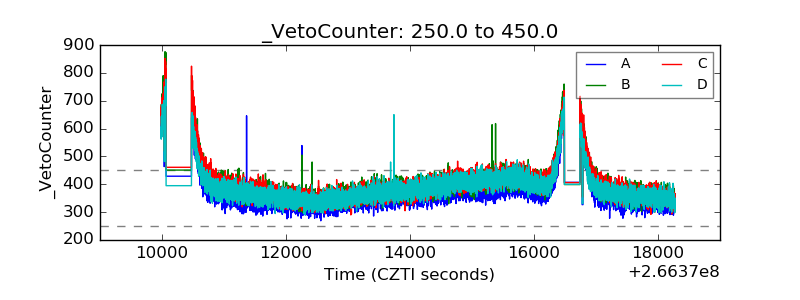 |