| Param | Original file | Final file |
|---|---|---|
| Filename | modeM0/AS1A04_016T01_9000002152cztM0_level2.fits | modeM0/AS1A04_016T01_9000002152cztM0_level2_quad_clean.evt |
| Size (bytes) | 532,506,240 | 469,304,640 |
| Size | 507.8 MB | 447.6 MB |
| Events in quadrant A | 3,251,218 | 2,756,675 |
| Events in quadrant B | 3,162,758 | 2,752,215 |
| Events in quadrant C | 3,238,564 | 2,598,841 |
| Events in quadrant D | 2,798,434 | 2,428,940 |
| Mode SS | |||
|---|---|---|---|
| Quadrant | BADHDUFLAG | Total packets | Discarded packets |
| A | 0 | 1092 | 0 |
| B | 0 | 1092 | 0 |
| C | 0 | 1092 | 0 |
| D | 0 | 1092 | 0 |
| Mode M0 | |||
|---|---|---|---|
| Quadrant | BADHDUFLAG | Total packets | Discarded packets |
| A | 0 | 117073 | 0 |
| B | 0 | 114296 | 0 |
| C | 0 | 133547 | 0 |
| D | 0 | 129754 | 0 |
| Mode M9 | |||
|---|---|---|---|
| Quadrant | BADHDUFLAG | Total packets | Discarded packets |
| A | 0 | 107 | 0 |
| B | 0 | 107 | 0 |
| C | 0 | 107 | 0 |
| D | 0 | 107 | 0 |
| Quadrant | Total seconds | Saturated seconds | Saturation percentage |
|---|---|---|---|
| A | 53581 | 635 | 1.185122% |
| B | 53581 | 787 | 1.468804% |
| C | 53581 | 594 | 1.108602% |
| D | 53581 | 1827 | 3.409791% |
Noise dominated data is calculated using 1-second bins in cleaned event files. If a bin has >2000 counts, and if more than 50% of those come from <1% of pixels, then it is considered to be noise-dominated and hence unusable.
| Quadrant | # 1 sec bins | Bins with >0 counts | Bins with >2000 counts | High rate bins dominated by noise | Noise dominated (total time) | Noise dominated (detector-on time) | Marked lightcurve |
|---|---|---|---|---|---|---|---|
| A | 64197 | 53576 | 0 | 0 | 0.00% | 0.00% |  |
| B | 64197 | 53575 | 0 | 0 | 0.00% | 0.00% |  |
| C | 64197 | 53575 | 0 | 0 | 0.00% | 0.00% |  |
| D | 64197 | 53526 | 0 | 0 | 0.00% | 0.00% |  |
Top three noisy pixels from each quadrant. If the there are fewer than three noisy pixels in the level2.evt file, extra rows are filled as -1
| Pixel properties | Quadrant properties | ||||||
|---|---|---|---|---|---|---|---|
| Quadrant | DetID | PixID | Counts | Sigma | Mean | Median | Sigma |
| A | 0 | 29 | 3055 | 10.57 | 847 | 793 | 214.0 |
| A | 7 | 110 | 2661 | 8.73 | 847 | 793 | 214.0 |
| A | 15 | 236 | 2475 | 7.86 | 847 | 793 | 214.0 |
| B | 2 | 9 | 2652 | 11.1 | 833 | 795 | 167.3 |
| B | 3 | 17 | 2175 | 8.25 | 833 | 795 | 167.3 |
| B | 5 | 128 | 2078 | 7.67 | 833 | 795 | 167.3 |
| C | 1 | 81 | 2346 | 7.12 | 854 | 799 | 217.4 |
| C | 1 | 80 | 2329 | 7.04 | 854 | 799 | 217.4 |
| C | 12 | 241 | 2249 | 6.67 | 854 | 799 | 217.4 |
| D | 3 | 14 | 2079 | 6.27 | 799 | 727 | 215.5 |
| D | 6 | 231 | 2047 | 6.13 | 799 | 727 | 215.5 |
| D | 6 | 38 | 1914 | 5.51 | 799 | 727 | 215.5 |
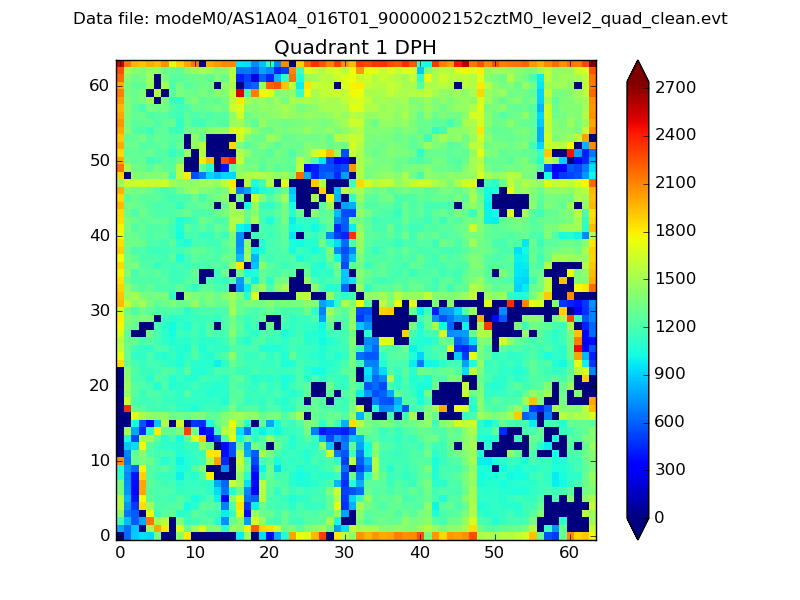
Histogram calculated using DETX and DETY for each event in the final _common_clean file
| Quadrant A |  |
 |
Quadrant B |
|---|---|---|---|
| Quadrant D | 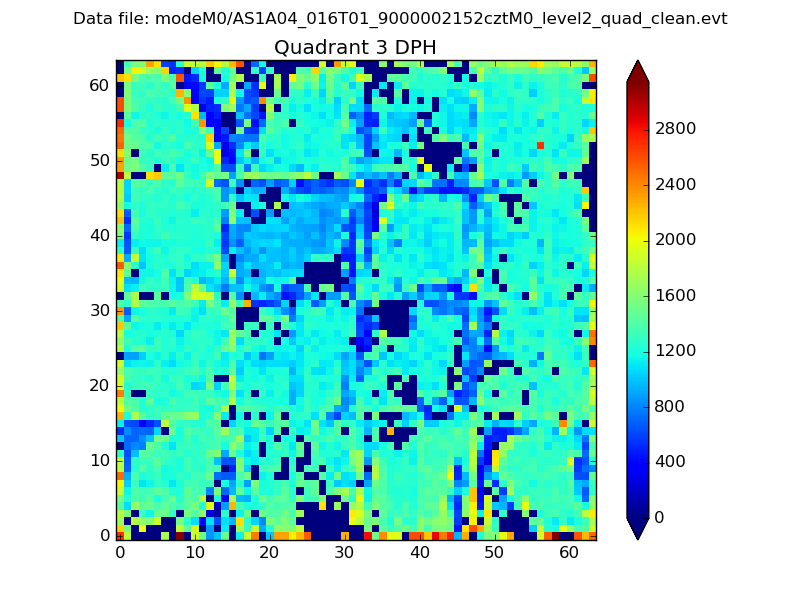 |
 |
Quadrant C |
| Plot type | Count rate plots | Images |
|---|---|---|
| Comparison with Poisson distribution Blue bars denote a histogram of data divided into 1 sec bins. Red curve is a Poisson curve with rate = median count rate of data. |
 |
 |
| Quadrant-wise count rates Data is divided into 100 sec bins |
 |
|
| Module-wise count rates for Quadrant A Data is divided into 100 sec bins |
 |
 |
| Module-wise count rates for Quadrant B Data is divided into 100 sec bins |
 |
 |
| Module-wise count rates for Quadrant C Data is divided into 100 sec bins |
 |
 |
| Module-wise count rates for Quadrant D Data is divided into 100 sec bins |
 |
 |
| Parameter | Plot |
|---|---|
| CZT HV Monitor |  |
| D_VDD |  |
| Temperature 1 |  |
| Veto HV Monitor |  |
| Veto LLD |  |
| Alpha Counter |  |
| _CPM_Rate |  |
| CZT Counter |  |
| +2.5 Volts monitor |  |
| +5 Volts monitor |  |
| _ROLL_ROT |  |
| _Roll_DEC |  |
| _Roll_RA |  |
| Veto Counter |  |