| Param | Original file | Final file |
|---|---|---|
| Filename | modeM0/AS1A04_016T01_9000002152_14610cztM0_level2.evt | modeM0/AS1A04_016T01_9000002152_14610cztM0_level2_quad_clean.evt |
| Size (bytes) | 123,428,160 | 23,958,720 |
| Size | 117.7 MB | 22.8 MB |
| Events in quadrant A | 789,845 | 153,012 |
| Events in quadrant B | 792,445 | 155,034 |
| Events in quadrant C | 1,034,937 | 151,911 |
| Events in quadrant D | 1,011,682 | 149,501 |
| Mode SS | |||
|---|---|---|---|
| Quadrant | BADHDUFLAG | Total packets | Discarded packets |
| A | 0 | 34 | 0 |
| B | 0 | 34 | 0 |
| C | 0 | 34 | 0 |
| D | 0 | 34 | 0 |
| Mode M0 | |||
|---|---|---|---|
| Quadrant | BADHDUFLAG | Total packets | Discarded packets |
| A | 0 | 3347 | 2 |
| B | 0 | 3404 | 1 |
| C | 0 | 4344 | 1 |
| D | 0 | 4087 | 1 |
| Mode M9 | |||
|---|---|---|---|
| Quadrant | BADHDUFLAG | Total packets | Discarded packets |
| A | 0 | 3 | 0 |
| B | 0 | 3 | 0 |
| C | 0 | 3 | 0 |
| D | 0 | 3 | 0 |
| Quadrant | Total seconds | Saturated seconds | Saturation percentage |
|---|---|---|---|
| A | 1560 | 90 | 5.769231% |
| B | 1560 | 98 | 6.282051% |
| C | 1560 | 88 | 5.641026% |
| D | 1560 | 192 | 12.307692% |
Noise dominated data is calculated using 1-second bins in cleaned event files. If a bin has >2000 counts, and if more than 50% of those come from <1% of pixels, then it is considered to be noise-dominated and hence unusable.
| Quadrant | # 1 sec bins | Bins with >0 counts | Bins with >2000 counts | High rate bins dominated by noise | Noise dominated (total time) | Noise dominated (detector-on time) | Marked lightcurve |
|---|---|---|---|---|---|---|---|
| A | 1876 | 1562 | 0 | 0 | 0.00% | 0.00% |  |
| B | 1876 | 1561 | 1 | 1 | 0.05% | 0.06% |  |
| C | 1876 | 1562 | 0 | 0 | 0.00% | 0.00% | 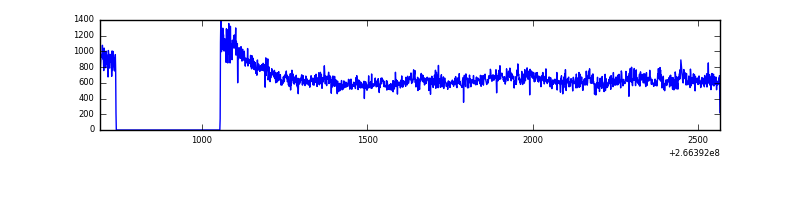 |
| D | 1875 | 1561 | 70 | 70 | 3.73% | 4.48% | 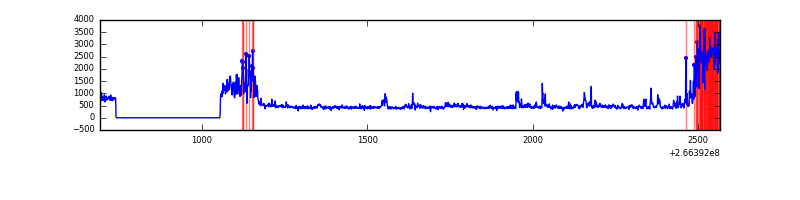 |
Top three noisy pixels from each quadrant. If the there are fewer than three noisy pixels in the level2.evt file, extra rows are filled as -1
| Pixel properties | Quadrant properties | ||||||
|---|---|---|---|---|---|---|---|
| Quadrant | DetID | PixID | Counts | Sigma | Mean | Median | Sigma |
| A | 8 | 15 | 24590 | 592.76 | 191 | 187 | 41.2 |
| A | 1 | 162 | 14357 | 344.2 | 191 | 187 | 41.2 |
| A | 1 | 178 | 4359 | 101.34 | 191 | 187 | 41.2 |
| B | 10 | 246 | 16990 | 428.0 | 188 | 182 | 39.3 |
| B | 15 | 201 | 13439 | 337.58 | 188 | 182 | 39.3 |
| B | 0 | 189 | 10219 | 255.59 | 188 | 182 | 39.3 |
| C | 3 | 233 | 321737 | 7119.52 | 182 | 183 | 45.2 |
| C | 13 | 61 | 1337 | 25.55 | 182 | 183 | 45.2 |
| C | 3 | 232 | 991 | 17.89 | 182 | 183 | 45.2 |
| D | 10 | 70 | 266222 | 5988.79 | 178 | 173 | 44.4 |
| D | 10 | 199 | 64824 | 1455.3 | 178 | 173 | 44.4 |
| D | 2 | 234 | 5038 | 109.51 | 178 | 173 | 44.4 |
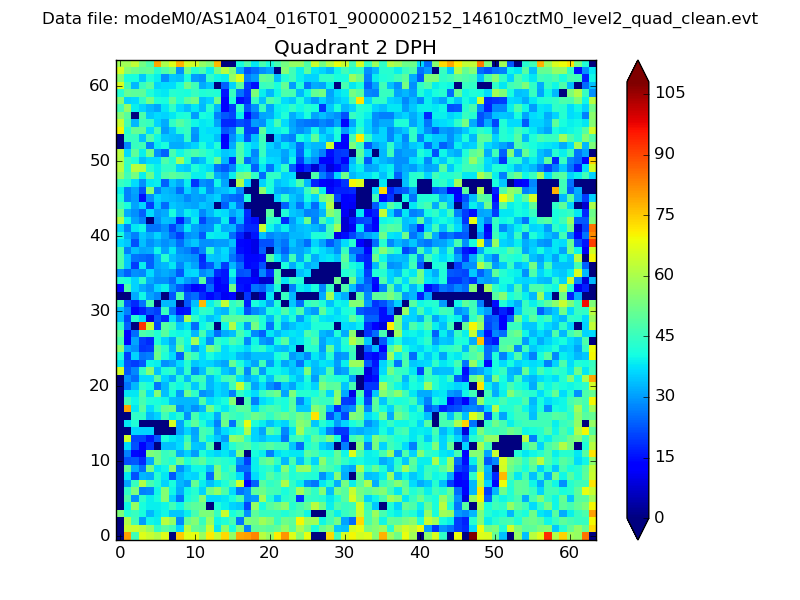
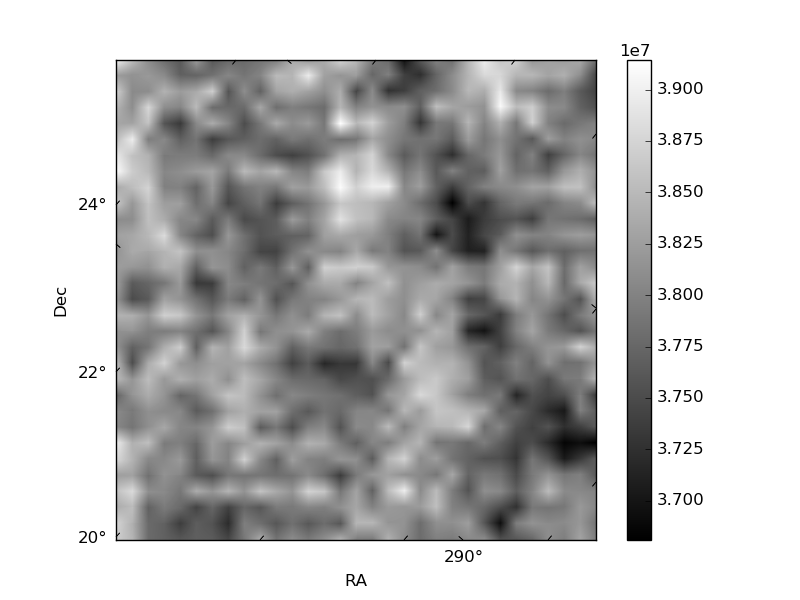
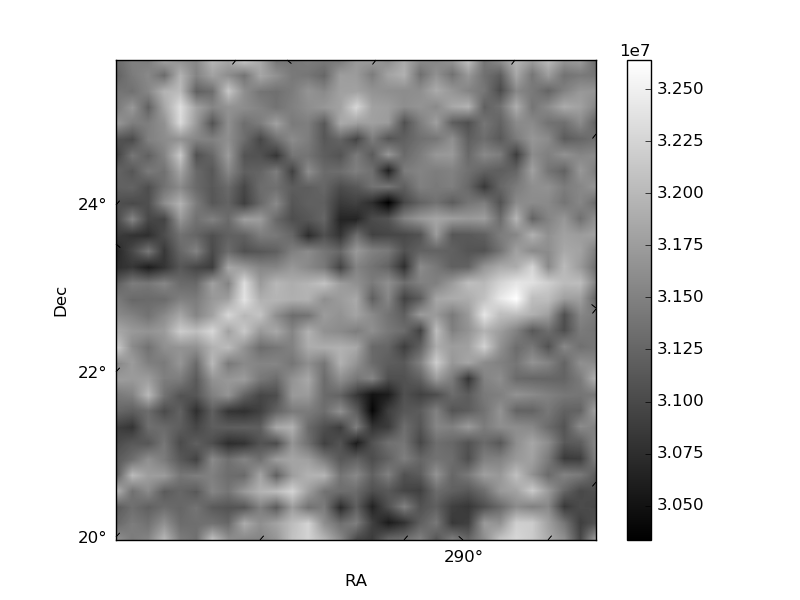
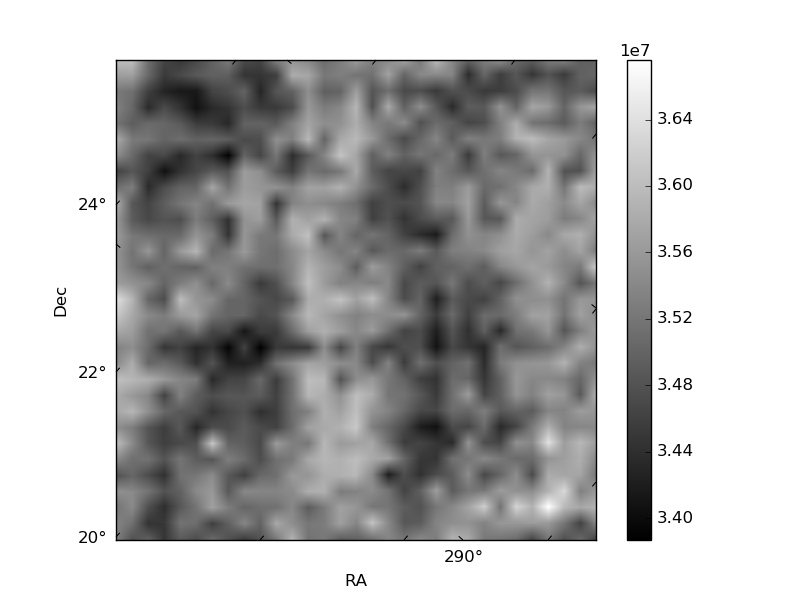
Histogram calculated using DETX and DETY for each event in the final _common_clean file
| Quadrant A | 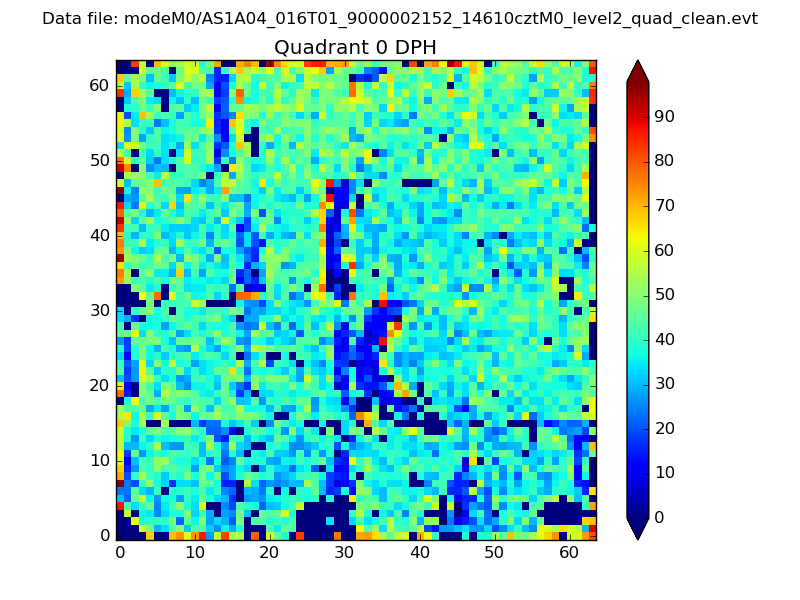 |
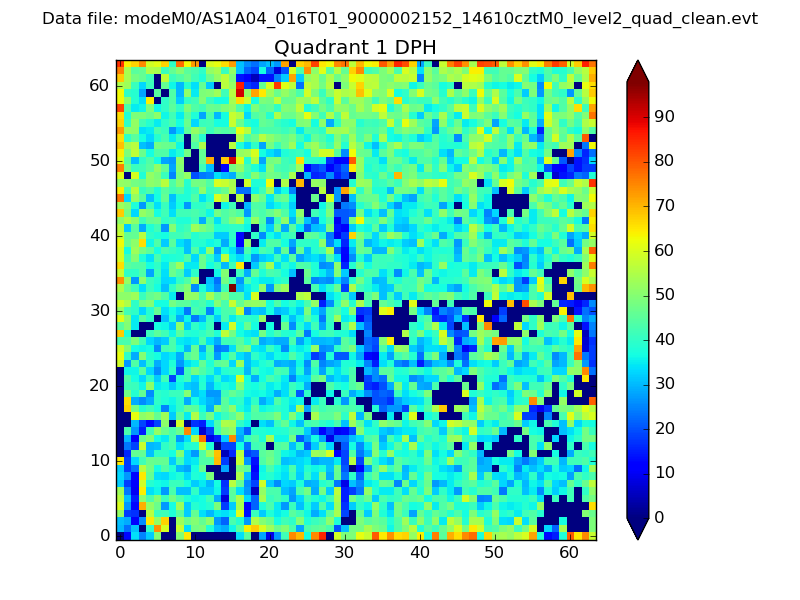 |
Quadrant B |
|---|---|---|---|
| Quadrant D | 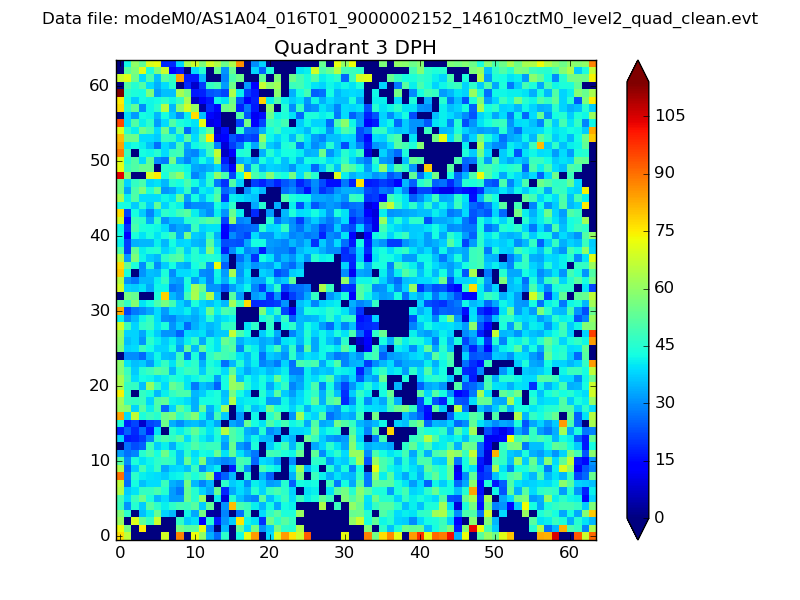 |
 |
Quadrant C |
| Plot type | Count rate plots | Images |
|---|---|---|
| Comparison with Poisson distribution Blue bars denote a histogram of data divided into 1 sec bins. Red curve is a Poisson curve with rate = median count rate of data. |
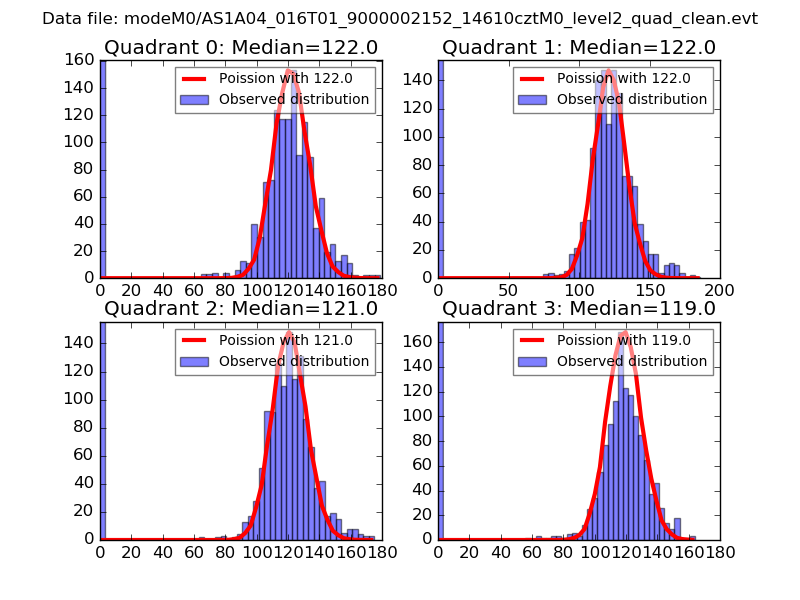 |
 |
| Quadrant-wise count rates Data is divided into 100 sec bins |
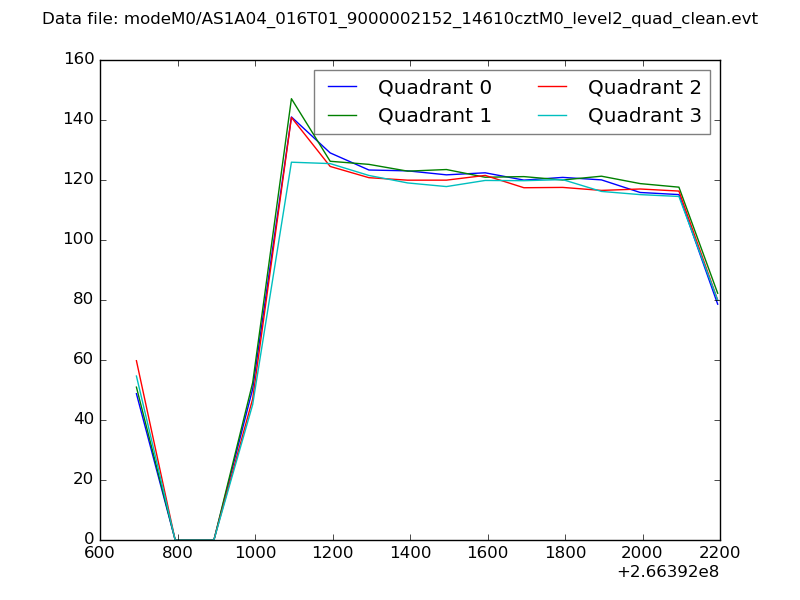 |
|
| Module-wise count rates for Quadrant A Data is divided into 100 sec bins |
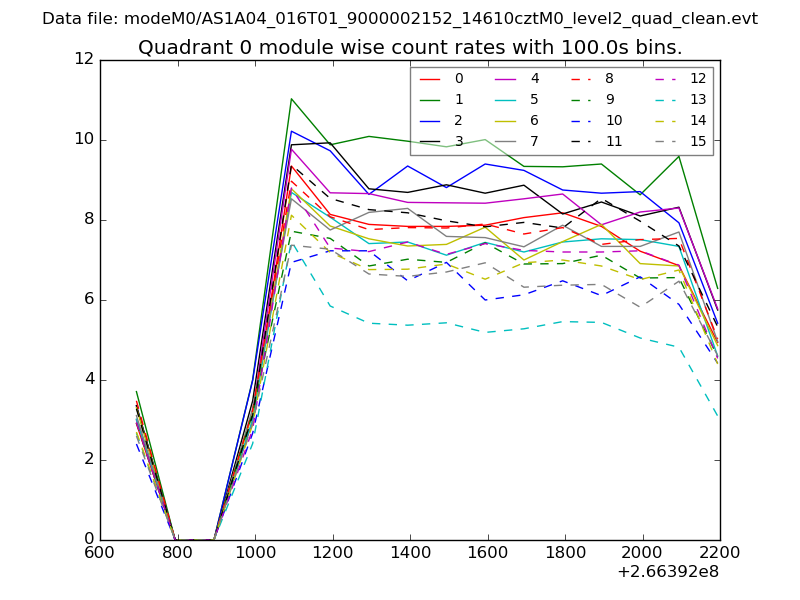 |
 |
| Module-wise count rates for Quadrant B Data is divided into 100 sec bins |
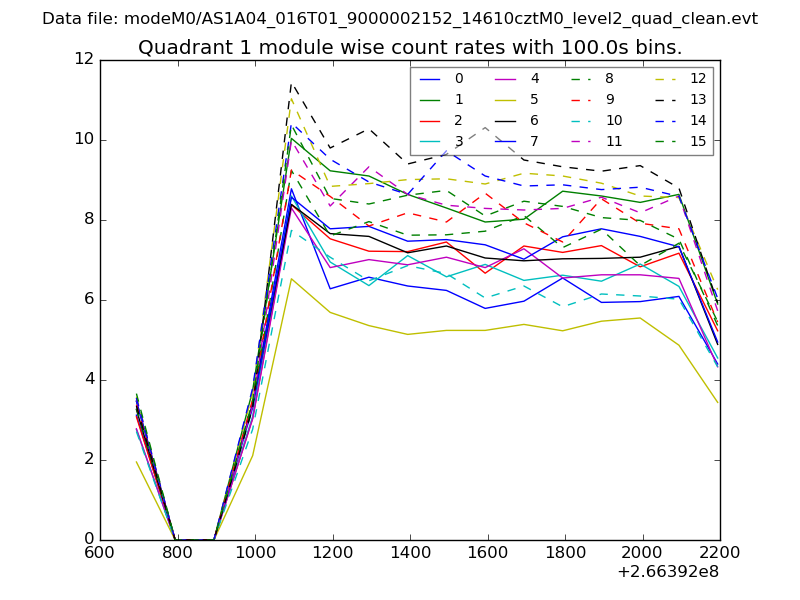 |
 |
| Module-wise count rates for Quadrant C Data is divided into 100 sec bins |
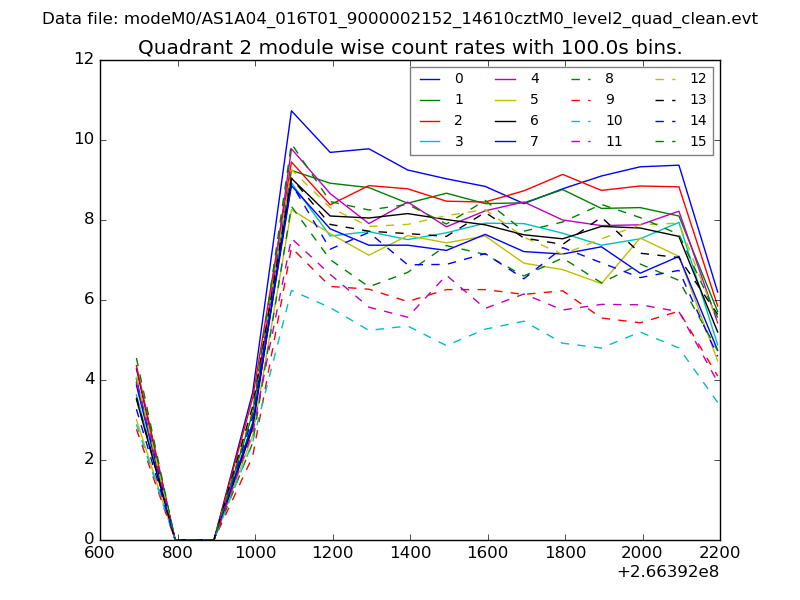 |
 |
| Module-wise count rates for Quadrant D Data is divided into 100 sec bins |
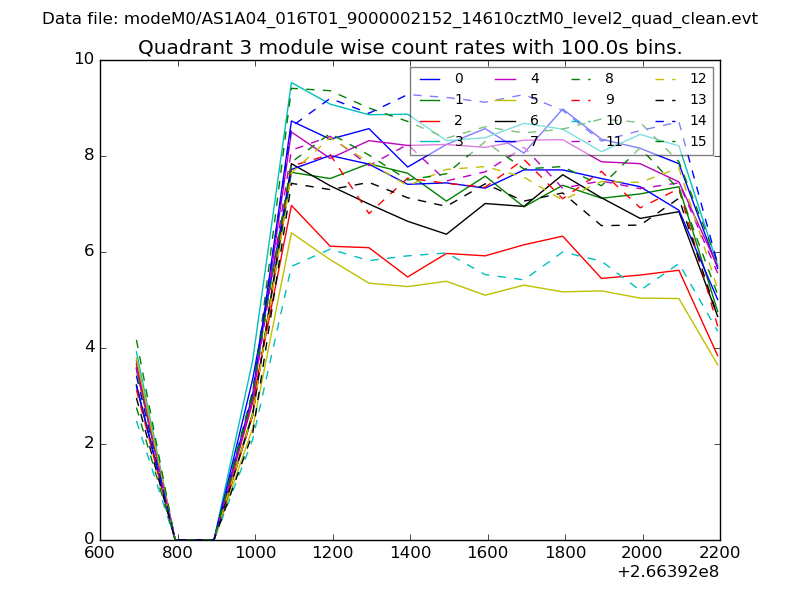 |
 |
| Parameter | Plot |
|---|---|
| CZT HV Monitor | 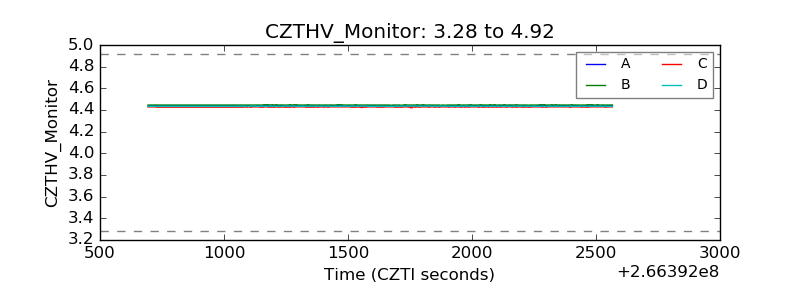 |
| D_VDD | 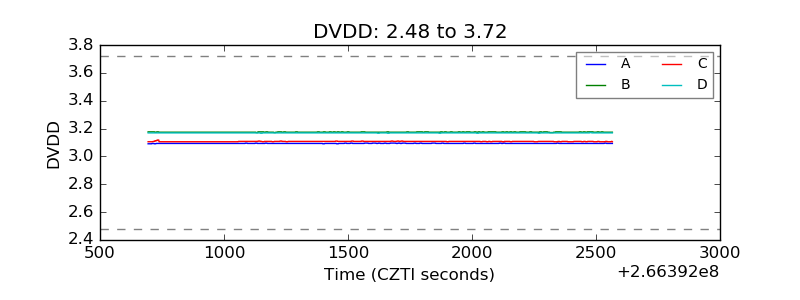 |
| Temperature 1 | 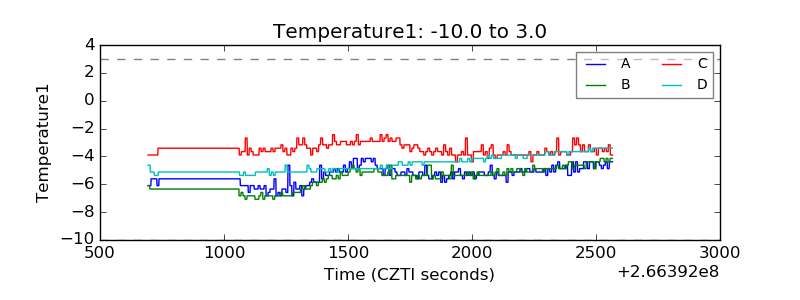 |
| Veto HV Monitor | 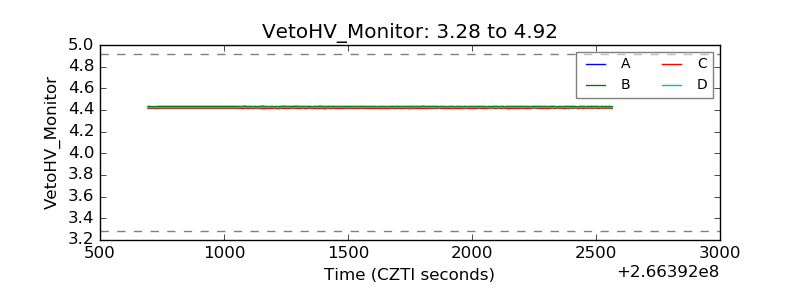 |
| Veto LLD |  |
| Alpha Counter | 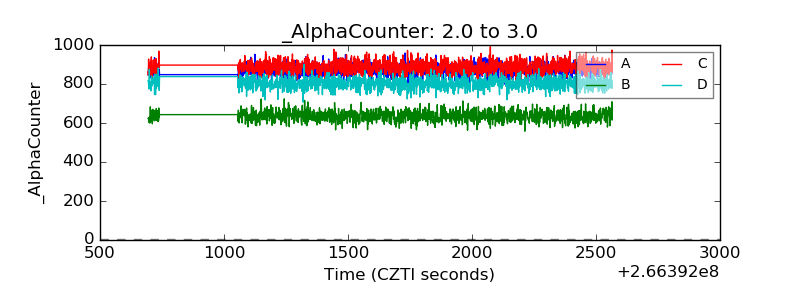 |
| _CPM_Rate | 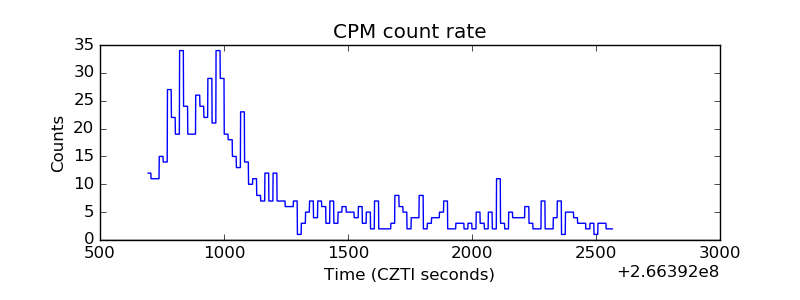 |
| CZT Counter | 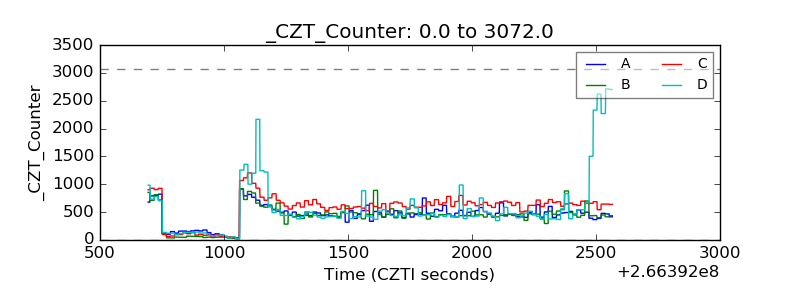 |
| +2.5 Volts monitor |  |
| +5 Volts monitor |  |
| _ROLL_ROT | 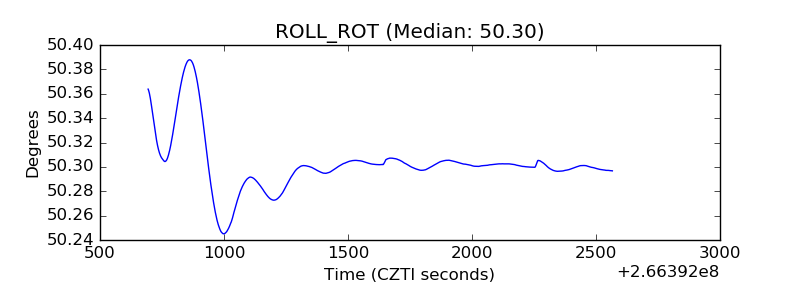 |
| _Roll_DEC | 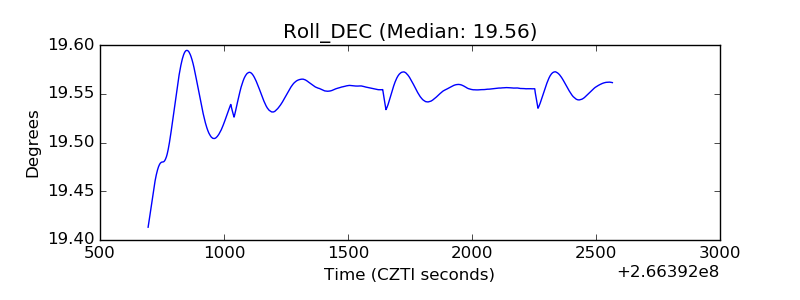 |
| _Roll_RA | 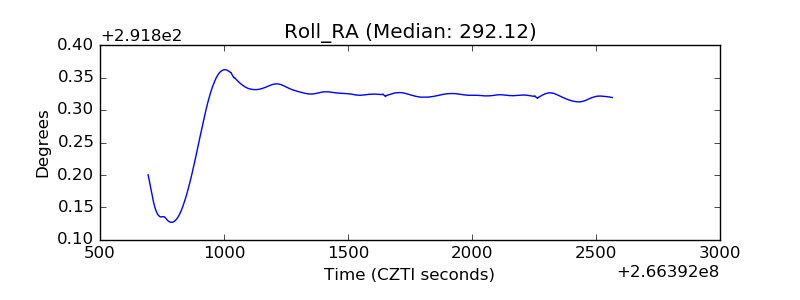 |
| Veto Counter | 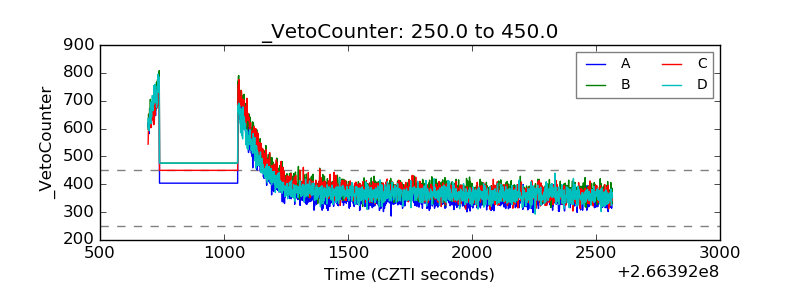 |