| Param | Original file | Final file |
|---|---|---|
| Filename | modeM0/AS1A04_016T01_9000002152_14613cztM0_level2.evt | modeM0/AS1A04_016T01_9000002152_14613cztM0_level2_quad_clean.evt |
| Size (bytes) | 1,349,573,760 | 209,125,440 |
| Size | 1.3 GB | 199.4 MB |
| Events in quadrant A | 9,622,748 | 1,279,245 |
| Events in quadrant B | 9,165,431 | 1,282,792 |
| Events in quadrant C | 11,063,059 | 1,256,743 |
| Events in quadrant D | 9,772,910 | 1,241,564 |
| Mode SS | |||
|---|---|---|---|
| Quadrant | BADHDUFLAG | Total packets | Discarded packets |
| A | 0 | 380 | 0 |
| B | 0 | 380 | 0 |
| C | 0 | 380 | 0 |
| D | 0 | 380 | 0 |
| Mode M0 | |||
|---|---|---|---|
| Quadrant | BADHDUFLAG | Total packets | Discarded packets |
| A | 0 | 40010 | 5 |
| B | 0 | 38636 | 4 |
| C | 0 | 45326 | 4 |
| D | 0 | 41609 | 4 |
| Mode M9 | |||
|---|---|---|---|
| Quadrant | BADHDUFLAG | Total packets | Discarded packets |
| A | 0 | 23 | 0 |
| B | 0 | 23 | 0 |
| C | 0 | 23 | 0 |
| D | 0 | 23 | 0 |
| Quadrant | Total seconds | Saturated seconds | Saturation percentage |
|---|---|---|---|
| A | 18462 | 319 | 1.727873% |
| B | 18462 | 333 | 1.803705% |
| C | 18462 | 276 | 1.494963% |
| D | 18462 | 574 | 3.109089% |
Noise dominated data is calculated using 1-second bins in cleaned event files. If a bin has >2000 counts, and if more than 50% of those come from <1% of pixels, then it is considered to be noise-dominated and hence unusable.
| Quadrant | # 1 sec bins | Bins with >0 counts | Bins with >2000 counts | High rate bins dominated by noise | Noise dominated (total time) | Noise dominated (detector-on time) | Marked lightcurve |
|---|---|---|---|---|---|---|---|
| A | 20819 | 18465 | 1 | 1 | 0.00% | 0.01% |  |
| B | 20819 | 18464 | 16 | 16 | 0.08% | 0.09% |  |
| C | 20819 | 18465 | 4 | 4 | 0.02% | 0.02% |  |
| D | 20819 | 18465 | 251 | 251 | 1.21% | 1.36% | 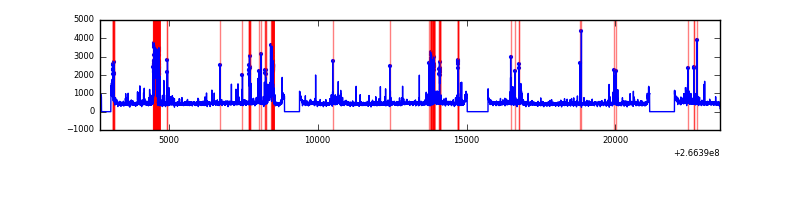 |
Top three noisy pixels from each quadrant. If the there are fewer than three noisy pixels in the level2.evt file, extra rows are filled as -1
| Pixel properties | Quadrant properties | ||||||
|---|---|---|---|---|---|---|---|
| Quadrant | DetID | PixID | Counts | Sigma | Mean | Median | Sigma |
| A | 1 | 162 | 275968 | 607.65 | 2237 | 2188 | 450.6 |
| A | 0 | 23 | 212631 | 467.08 | 2237 | 2188 | 450.6 |
| A | 8 | 15 | 168697 | 369.56 | 2237 | 2188 | 450.6 |
| B | 0 | 229 | 146857 | 338.54 | 2225 | 2167 | 427.4 |
| B | 0 | 189 | 90473 | 206.61 | 2225 | 2167 | 427.4 |
| B | 0 | 205 | 63841 | 144.3 | 2225 | 2167 | 427.4 |
| C | 3 | 233 | 2615061 | 5214.94 | 2164 | 2175 | 501.0 |
| C | 13 | 61 | 15354 | 26.3 | 2164 | 2175 | 501.0 |
| C | 14 | 225 | 9721 | 15.06 | 2164 | 2175 | 501.0 |
| D | 10 | 70 | 967874 | 1893.05 | 2156 | 2102 | 510.2 |
| D | 10 | 199 | 356409 | 694.49 | 2156 | 2102 | 510.2 |
| D | 2 | 152 | 78947 | 150.63 | 2156 | 2102 | 510.2 |
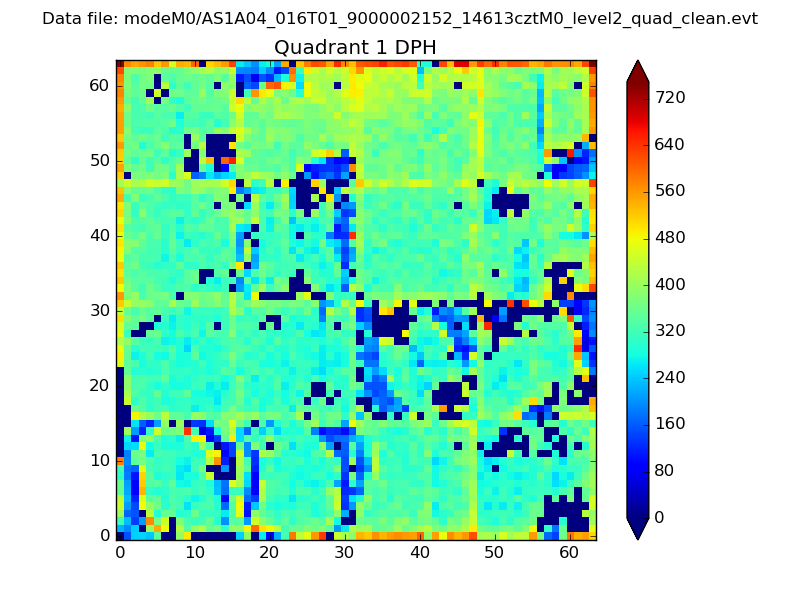
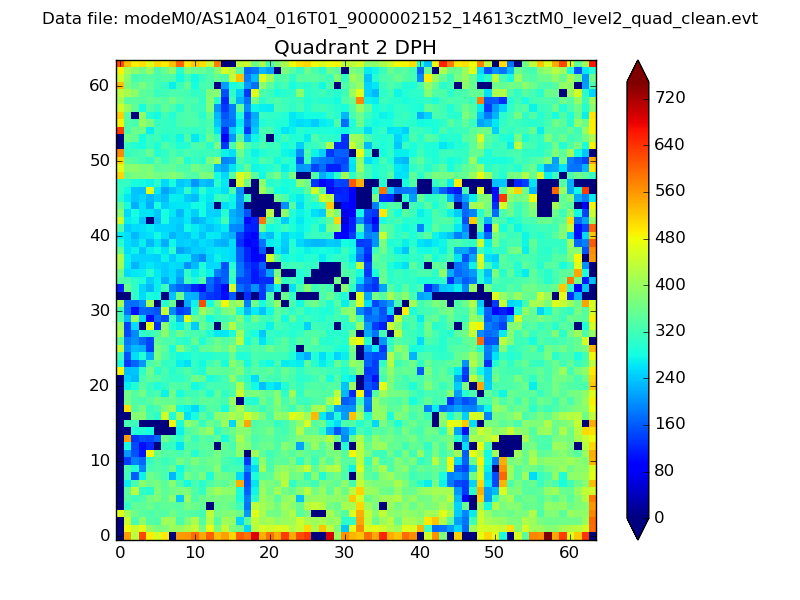
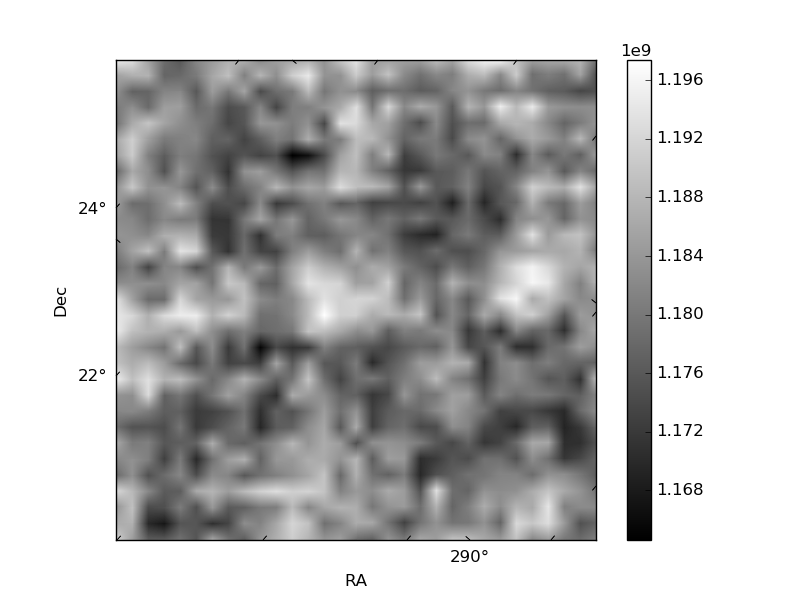
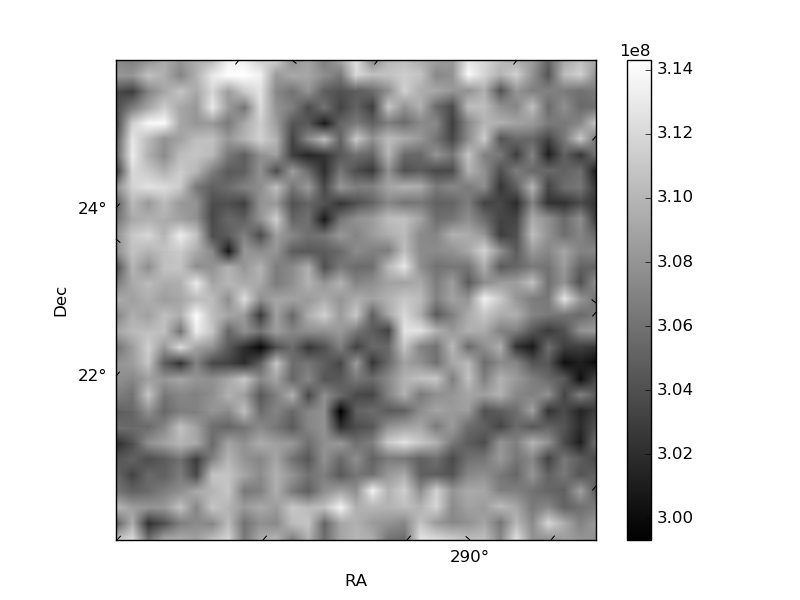
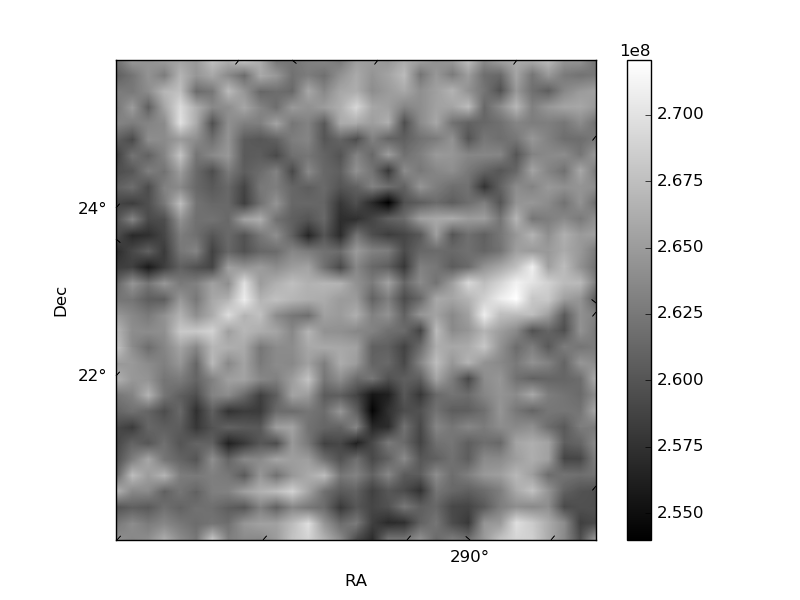
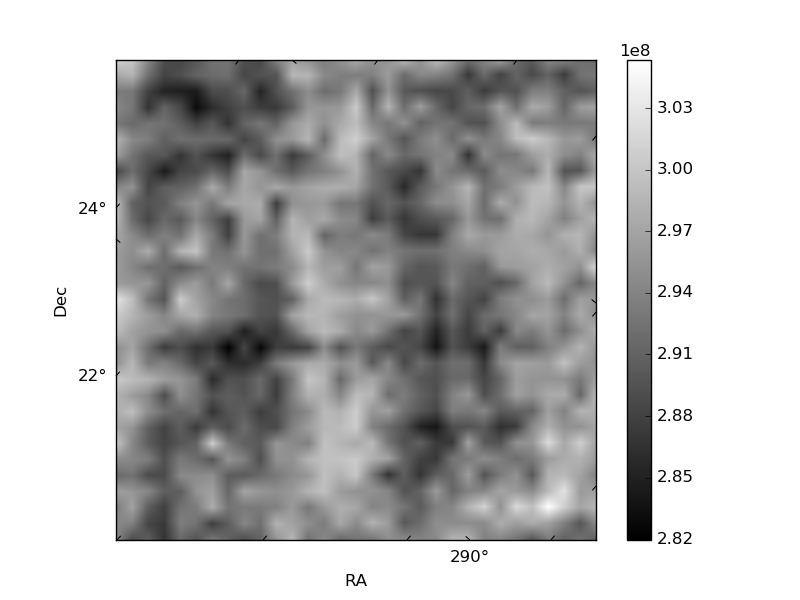
Histogram calculated using DETX and DETY for each event in the final _common_clean file
| Quadrant A |  |
 |
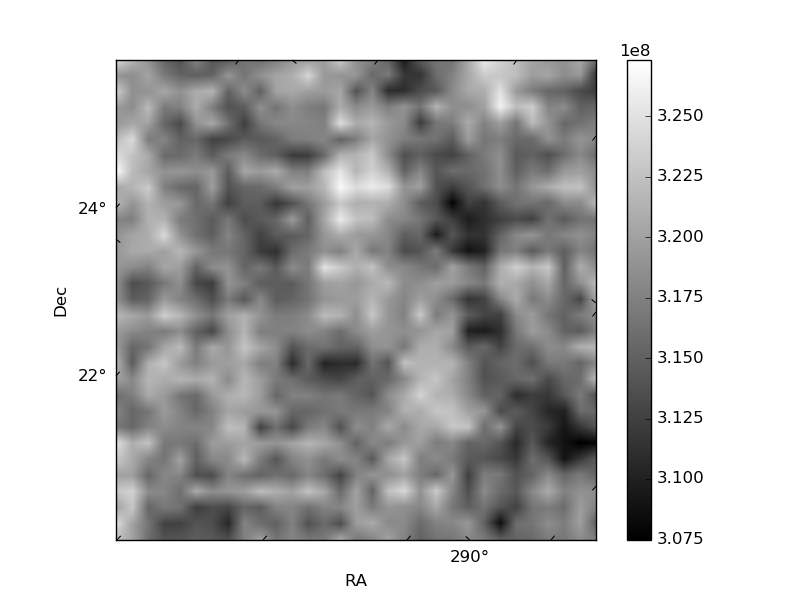
Quadrant B |
|---|---|---|---|
| Quadrant D | 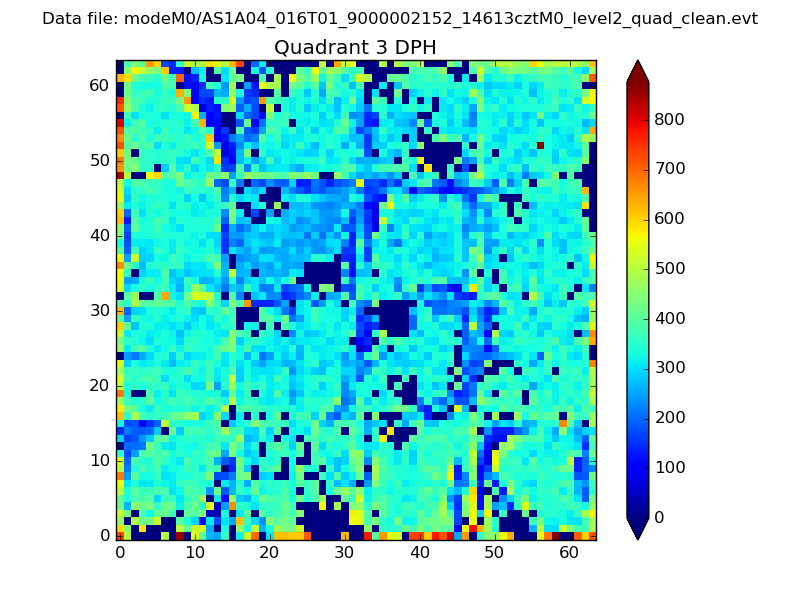 |
 |
Quadrant C |
| Plot type | Count rate plots | Images |
|---|---|---|
| Comparison with Poisson distribution Blue bars denote a histogram of data divided into 1 sec bins. Red curve is a Poisson curve with rate = median count rate of data. |
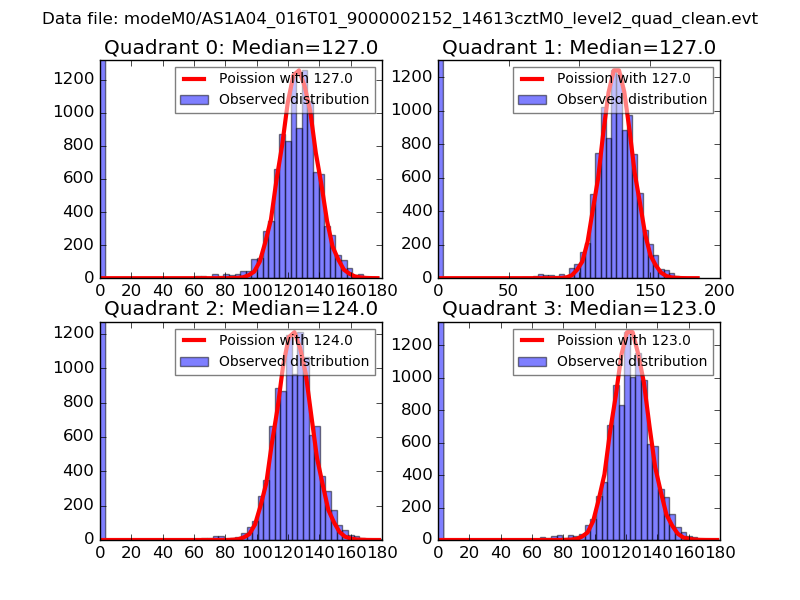 |
 |
| Quadrant-wise count rates Data is divided into 100 sec bins |
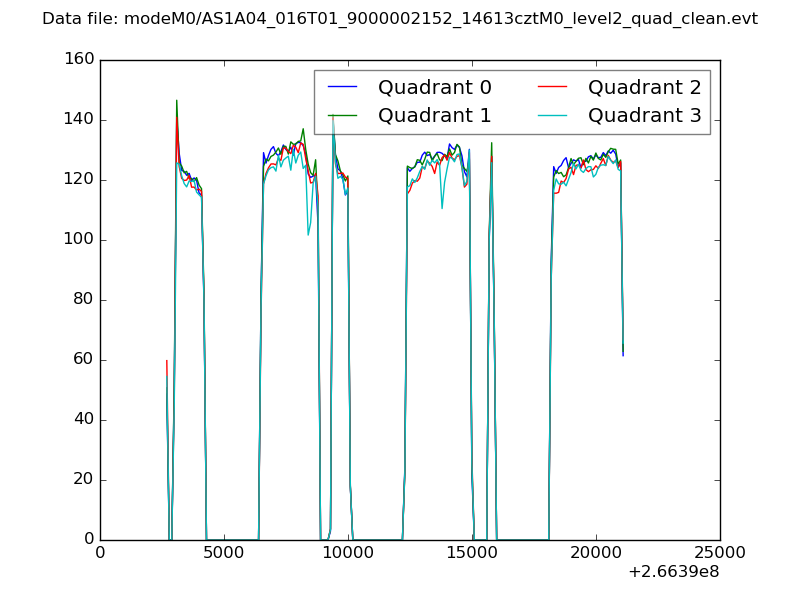 |
|
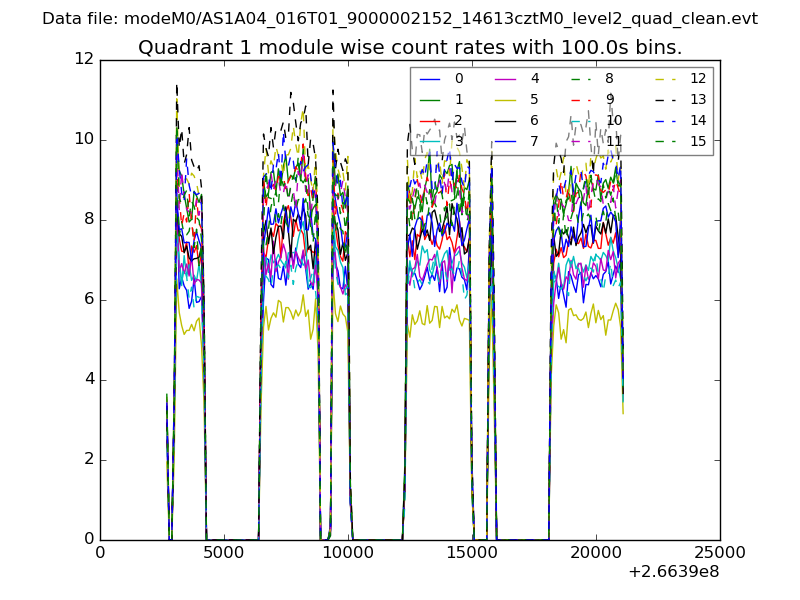
| Module-wise count rates for Quadrant A Data is divided into 100 sec bins |
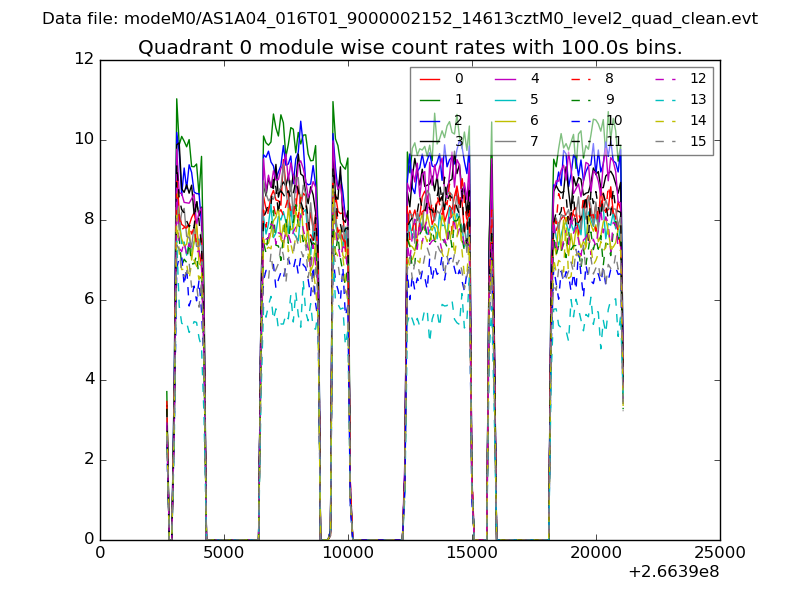 |
 |
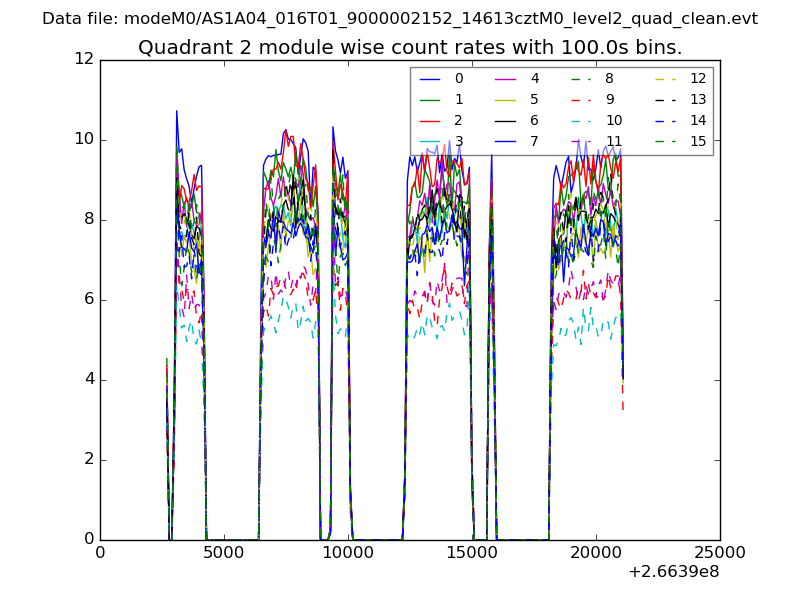
| Module-wise count rates for Quadrant B Data is divided into 100 sec bins |
 |
 |
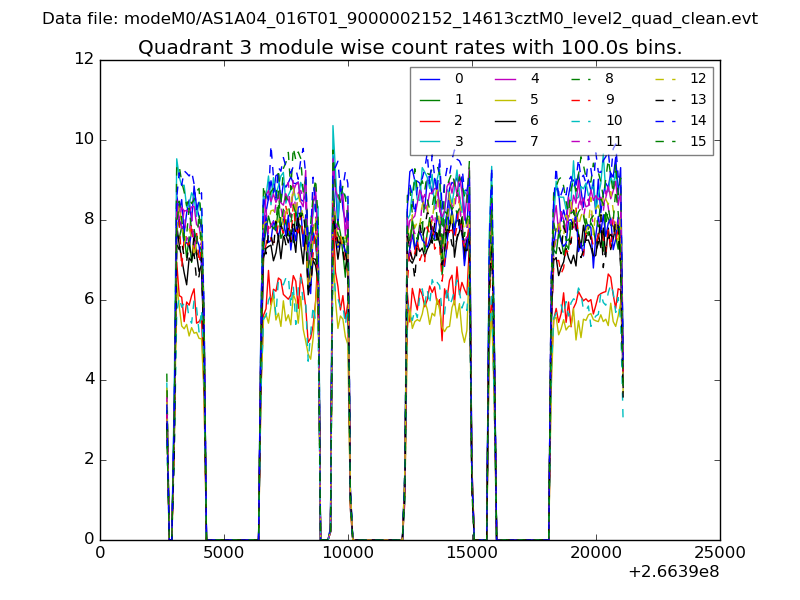
| Module-wise count rates for Quadrant C Data is divided into 100 sec bins |
 |
 |
| Module-wise count rates for Quadrant D Data is divided into 100 sec bins |
 |
 |
| Parameter | Plot |
|---|---|
| CZT HV Monitor | 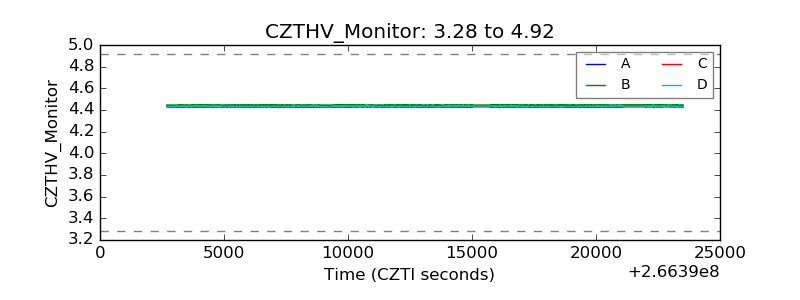 |
| D_VDD | 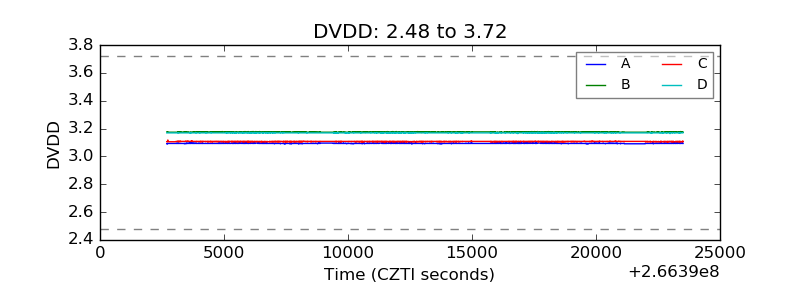 |
| Temperature 1 | 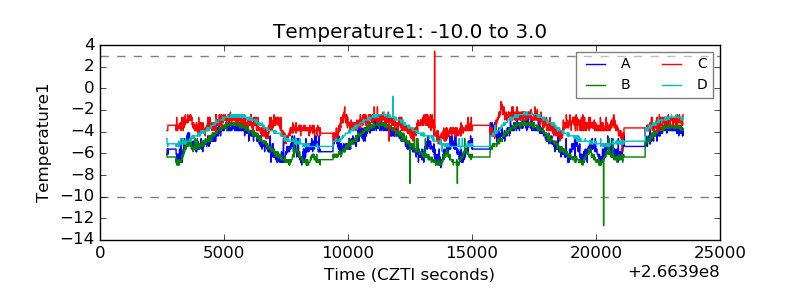 |
| Veto HV Monitor | 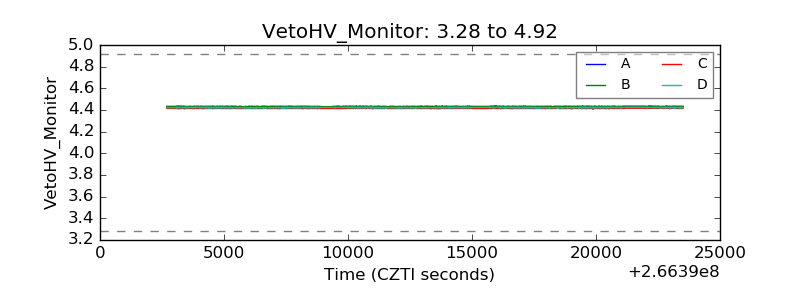 |
| Veto LLD | 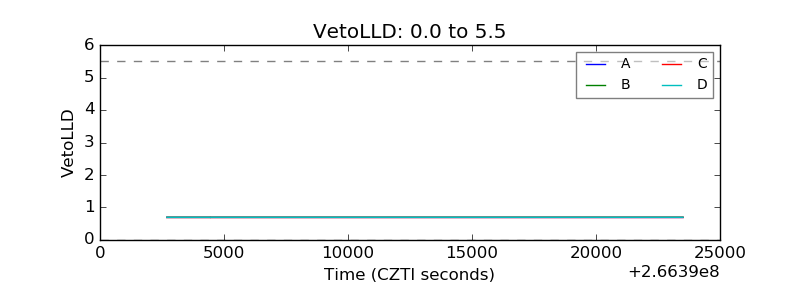 |
| Alpha Counter | 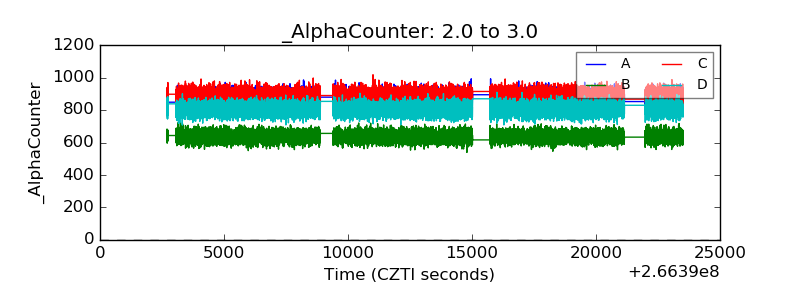 |
| _CPM_Rate | 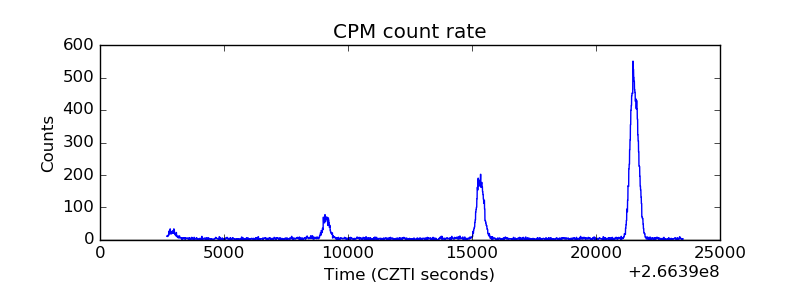 |
| CZT Counter | 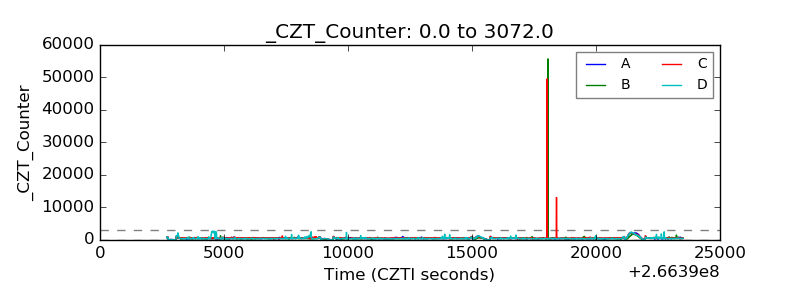 |
| +2.5 Volts monitor | 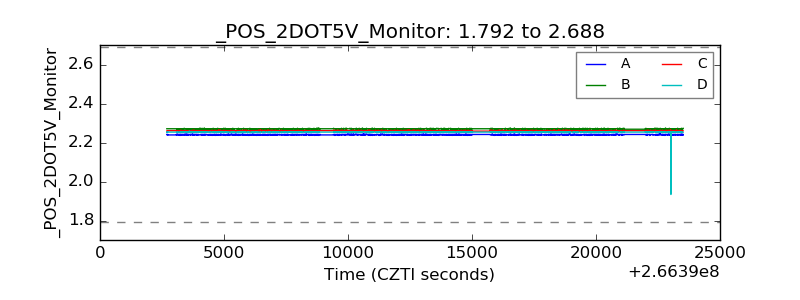 |
| +5 Volts monitor |  |
| _ROLL_ROT | 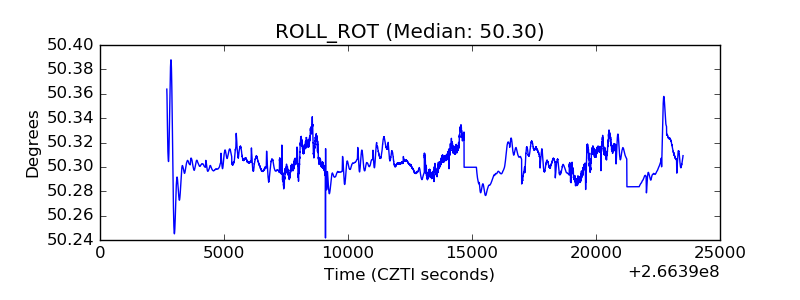 |
| _Roll_DEC | 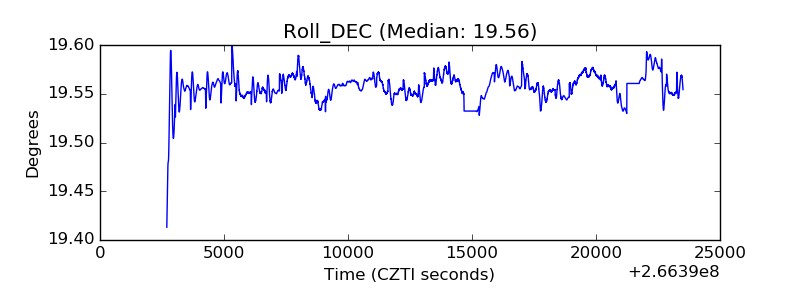 |
| _Roll_RA | 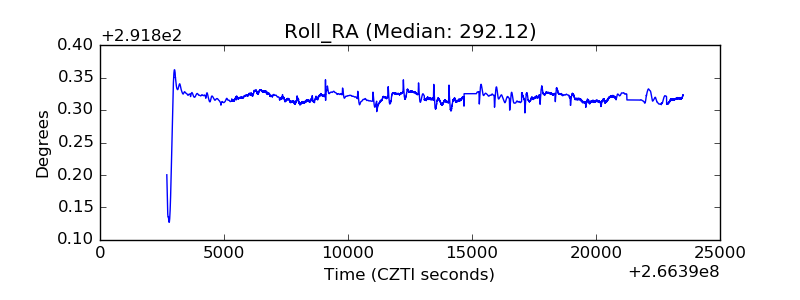 |
| Veto Counter | 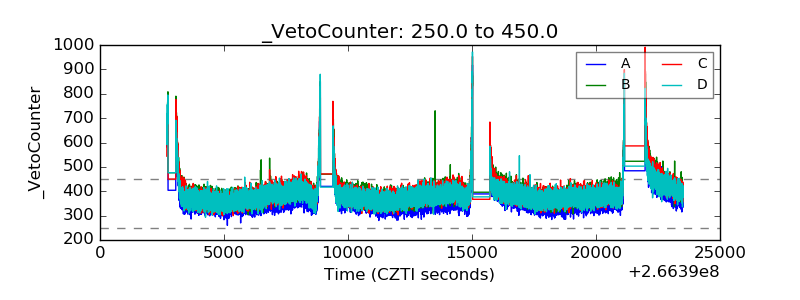 |