| Param | Original file | Final file |
|---|---|---|
| Filename | modeM0/AS1A04_016T01_9000002152_14614cztM0_level2.evt | modeM0/AS1A04_016T01_9000002152_14614cztM0_level2_quad_clean.evt |
| Size (bytes) | 500,486,400 | 68,794,560 |
| Size | 477.3 MB | 65.6 MB |
| Events in quadrant A | 3,684,990 | 410,809 |
| Events in quadrant B | 3,479,802 | 410,872 |
| Events in quadrant C | 4,076,271 | 397,066 |
| Events in quadrant D | 3,462,733 | 398,187 |
| Mode SS | |||
|---|---|---|---|
| Quadrant | BADHDUFLAG | Total packets | Discarded packets |
| A | 0 | 134 | 0 |
| B | 0 | 134 | 0 |
| C | 0 | 134 | 0 |
| D | 0 | 134 | 0 |
| Mode M0 | |||
|---|---|---|---|
| Quadrant | BADHDUFLAG | Total packets | Discarded packets |
| A | 0 | 15129 | 3 |
| B | 0 | 14468 | 2 |
| C | 0 | 16715 | 2 |
| D | 0 | 14753 | 2 |
| Mode M9 | |||
|---|---|---|---|
| Quadrant | BADHDUFLAG | Total packets | Discarded packets |
| A | 0 | 12 | 0 |
| B | 0 | 12 | 0 |
| C | 0 | 12 | 0 |
| D | 0 | 13 | 0 |
| Quadrant | Total seconds | Saturated seconds | Saturation percentage |
|---|---|---|---|
| A | 6690 | 90 | 1.345291% |
| B | 6690 | 96 | 1.434978% |
| C | 6690 | 69 | 1.031390% |
| D | 6690 | 99 | 1.479821% |
Noise dominated data is calculated using 1-second bins in cleaned event files. If a bin has >2000 counts, and if more than 50% of those come from <1% of pixels, then it is considered to be noise-dominated and hence unusable.
| Quadrant | # 1 sec bins | Bins with >0 counts | Bins with >2000 counts | High rate bins dominated by noise | Noise dominated (total time) | Noise dominated (detector-on time) | Marked lightcurve |
|---|---|---|---|---|---|---|---|
| A | 7706 | 6691 | 0 | 0 | 0.00% | 0.00% | 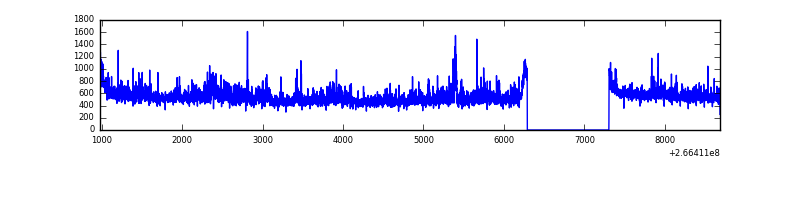 |
| B | 7706 | 6691 | 8 | 8 | 0.10% | 0.12% | 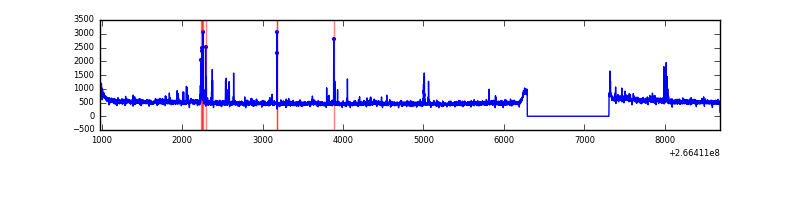 |
| C | 7706 | 6691 | 1 | 1 | 0.01% | 0.01% |  |
| D | 7706 | 6691 | 17 | 17 | 0.22% | 0.25% | 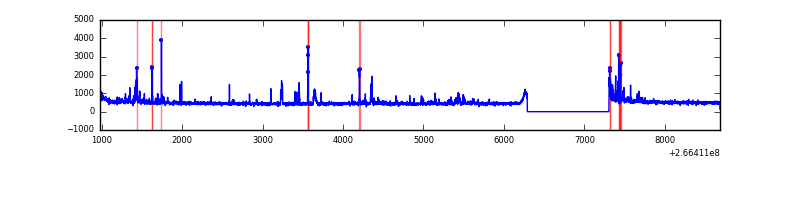 |
Top three noisy pixels from each quadrant. If the there are fewer than three noisy pixels in the level2.evt file, extra rows are filled as -1
| Pixel properties | Quadrant properties | ||||||
|---|---|---|---|---|---|---|---|
| Quadrant | DetID | PixID | Counts | Sigma | Mean | Median | Sigma |
| A | 1 | 162 | 154397 | 891.77 | 845 | 828 | 172.2 |
| A | 1 | 178 | 61029 | 349.59 | 845 | 828 | 172.2 |
| A | 1 | 161 | 54951 | 314.29 | 845 | 828 | 172.2 |
| B | 0 | 229 | 77297 | 473.0 | 841 | 818 | 161.7 |
| B | 0 | 189 | 45850 | 278.51 | 841 | 818 | 161.7 |
| B | 12 | 111 | 19261 | 114.06 | 841 | 818 | 161.7 |
| C | 3 | 233 | 898278 | 4715.38 | 815 | 819 | 190.3 |
| C | 13 | 61 | 5763 | 25.98 | 815 | 819 | 190.3 |
| C | 3 | 232 | 2328 | 7.93 | 815 | 819 | 190.3 |
| D | 10 | 199 | 138975 | 713.01 | 818 | 800 | 193.8 |
| D | 10 | 70 | 120796 | 619.2 | 818 | 800 | 193.8 |
| D | 12 | 110 | 67452 | 343.94 | 818 | 800 | 193.8 |
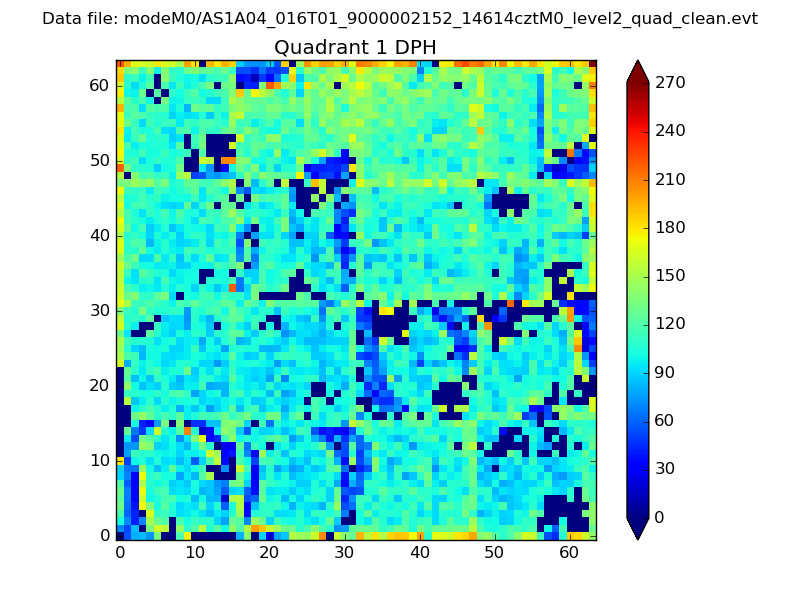
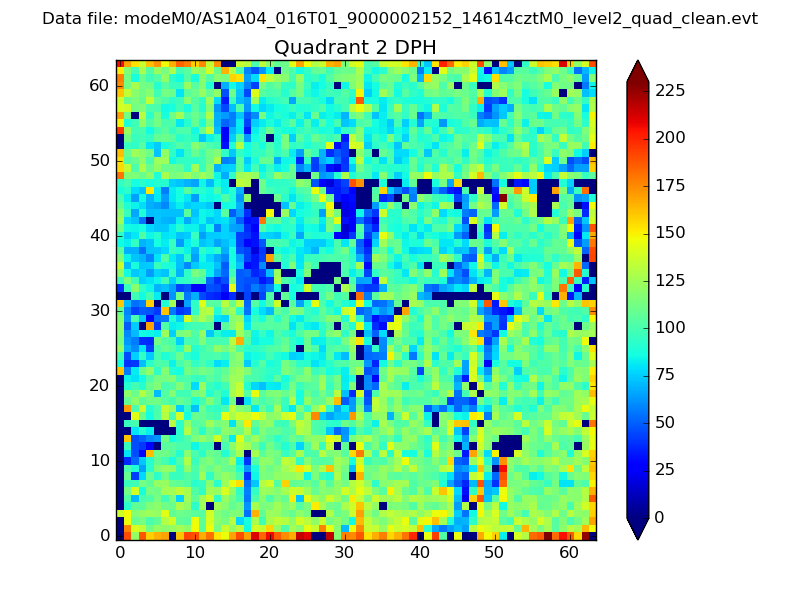
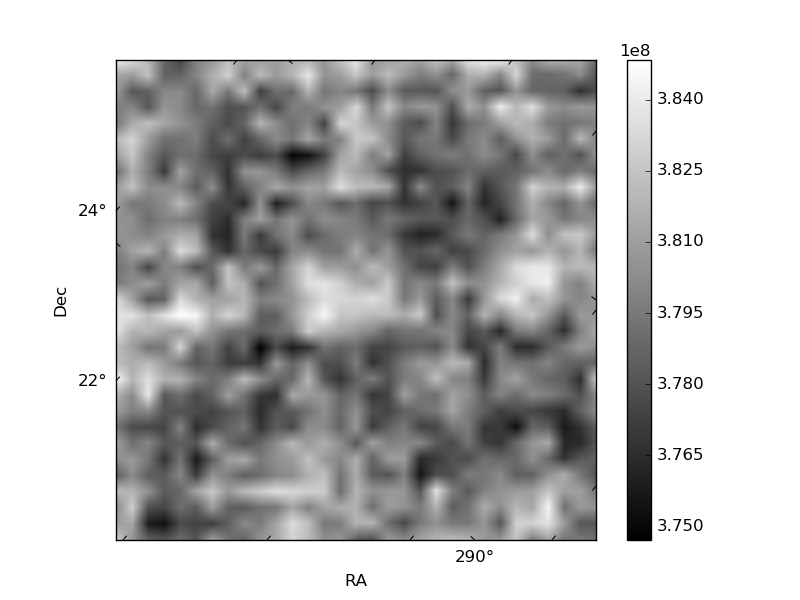
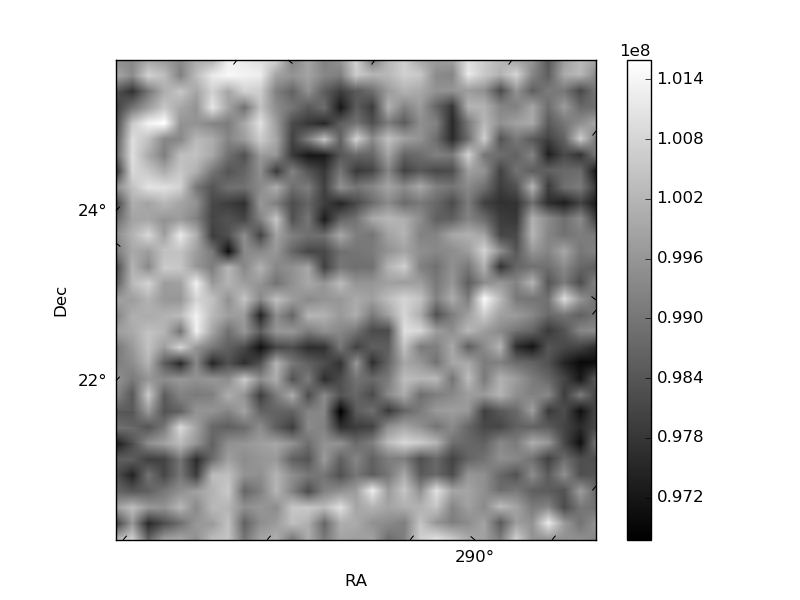
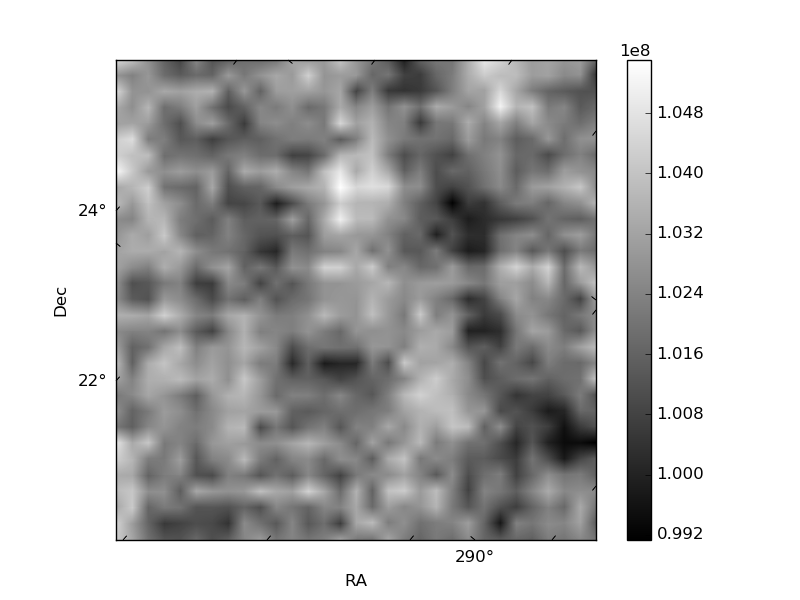
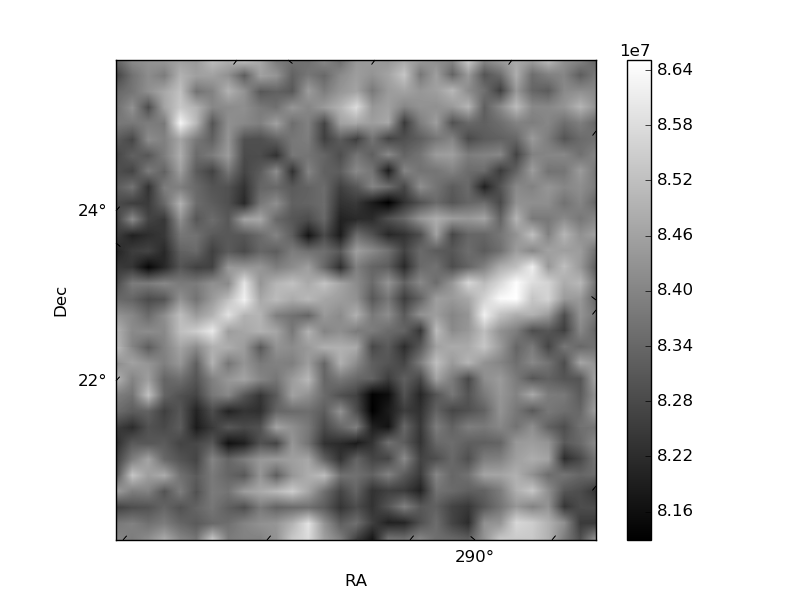
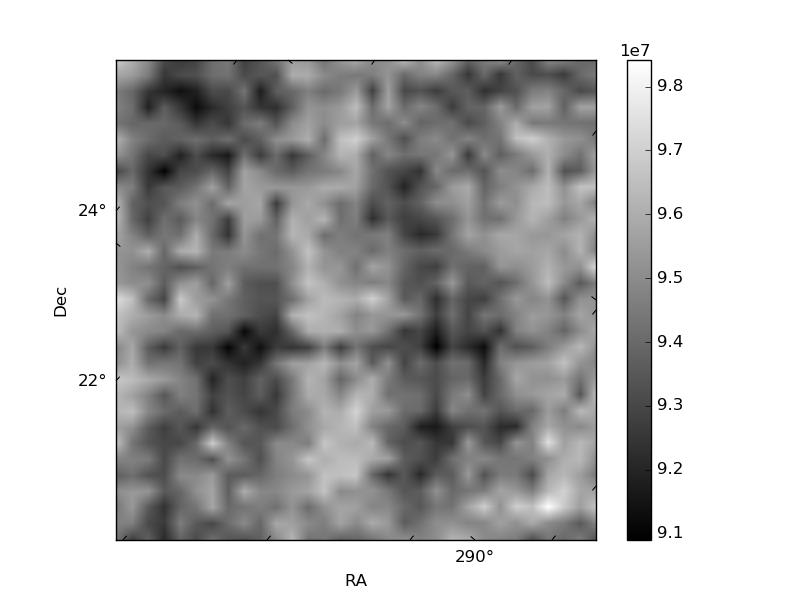
Histogram calculated using DETX and DETY for each event in the final _common_clean file
| Quadrant A | 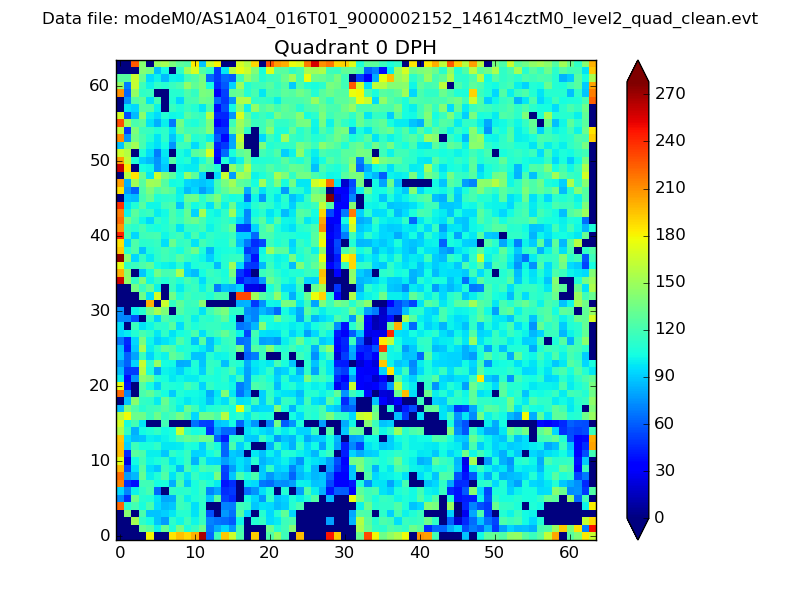 |
 |
Quadrant B |
|---|---|---|---|
| Quadrant D | 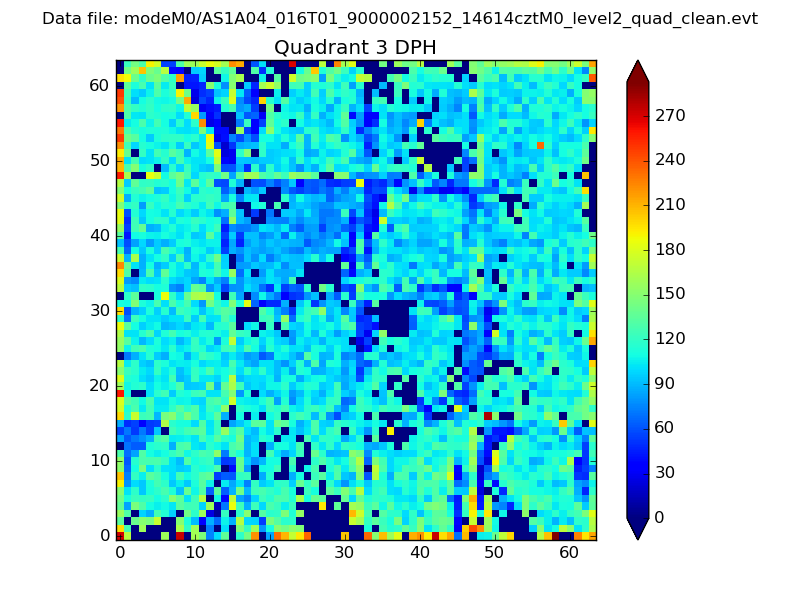 |
 |
Quadrant C |
| Plot type | Count rate plots | Images |
|---|---|---|
| Comparison with Poisson distribution Blue bars denote a histogram of data divided into 1 sec bins. Red curve is a Poisson curve with rate = median count rate of data. |
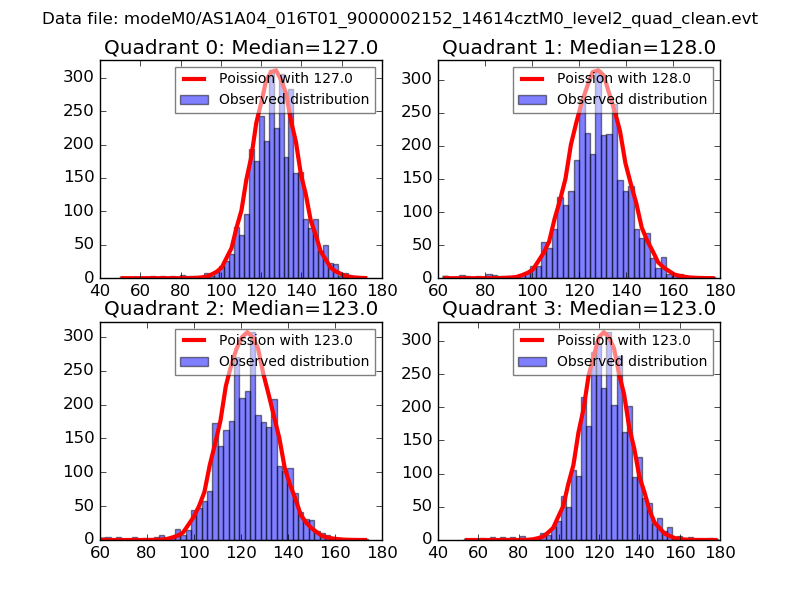 |
 |
| Quadrant-wise count rates Data is divided into 100 sec bins |
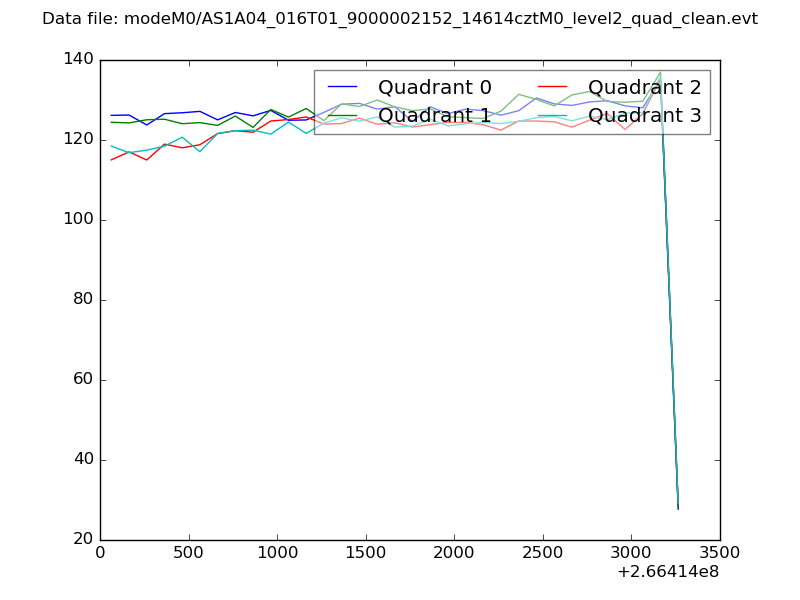 |
|
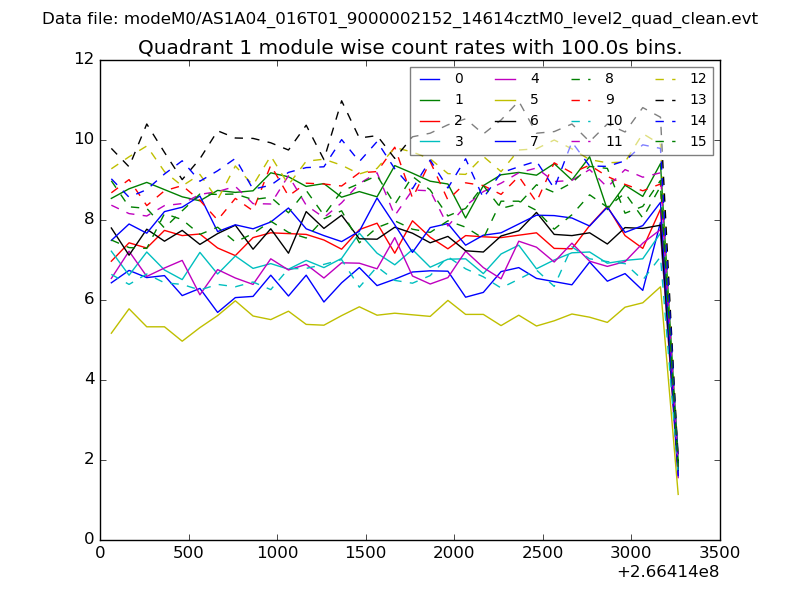
| Module-wise count rates for Quadrant A Data is divided into 100 sec bins |
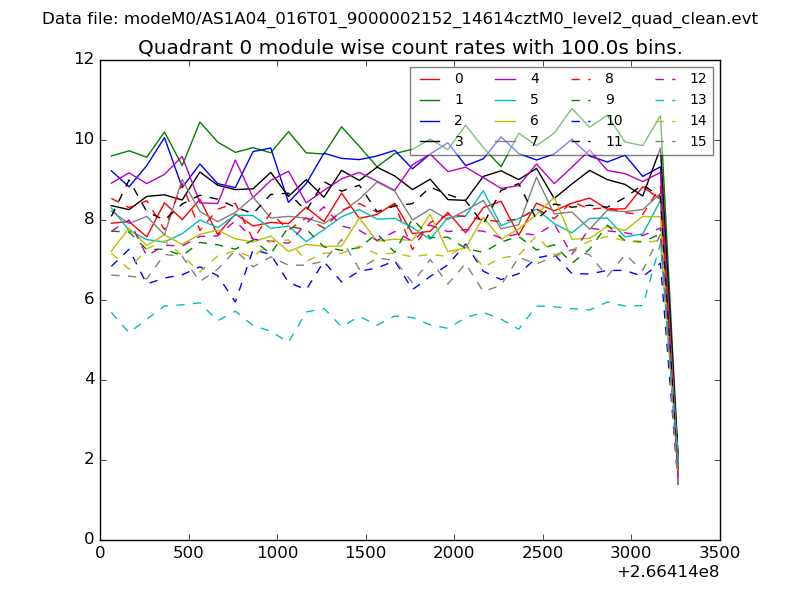 |
 |
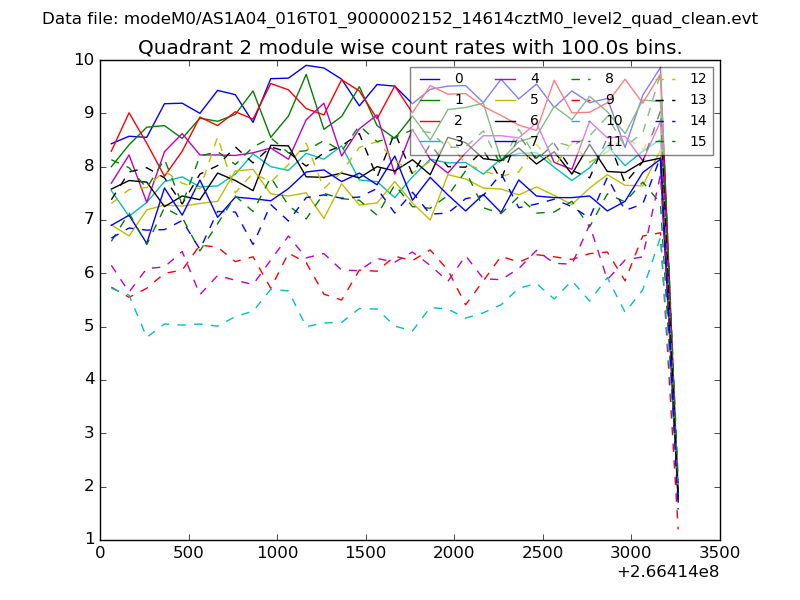
| Module-wise count rates for Quadrant B Data is divided into 100 sec bins |
 |
 |
| Module-wise count rates for Quadrant C Data is divided into 100 sec bins |
 |
 |
| Module-wise count rates for Quadrant D Data is divided into 100 sec bins |
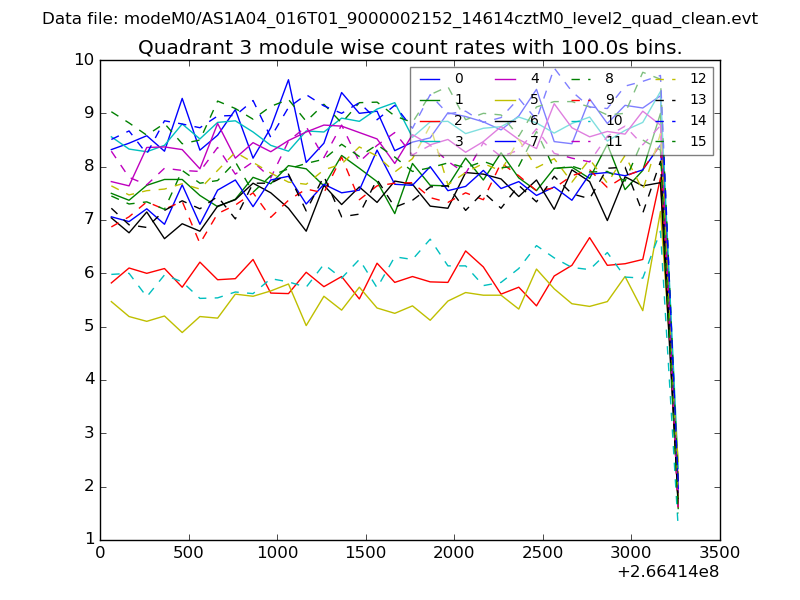 |
 |
| Parameter | Plot |
|---|---|
| CZT HV Monitor | 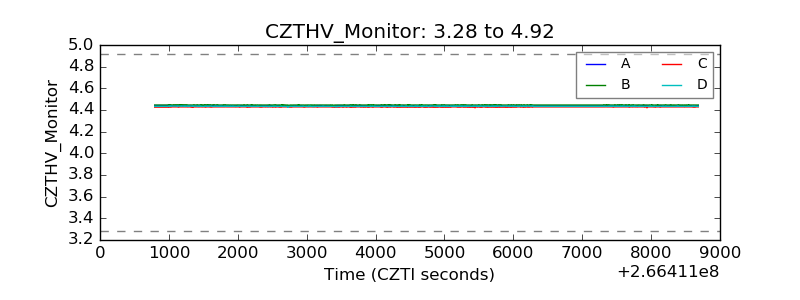 |
| D_VDD | 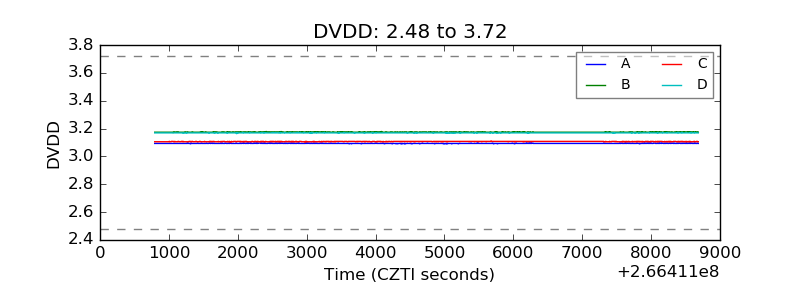 |
| Temperature 1 | 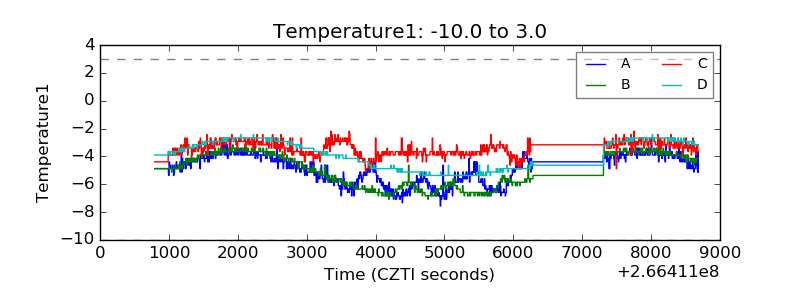 |
| Veto HV Monitor | 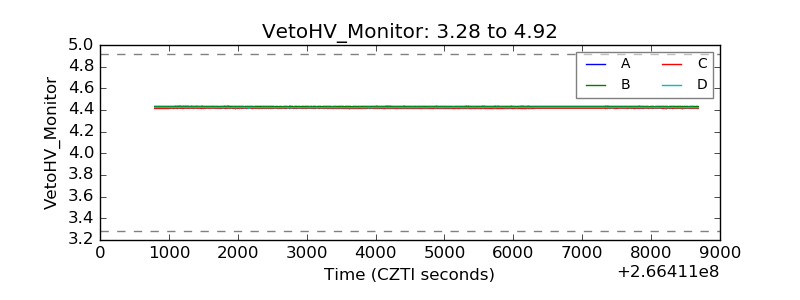 |
| Veto LLD |  |
| Alpha Counter | 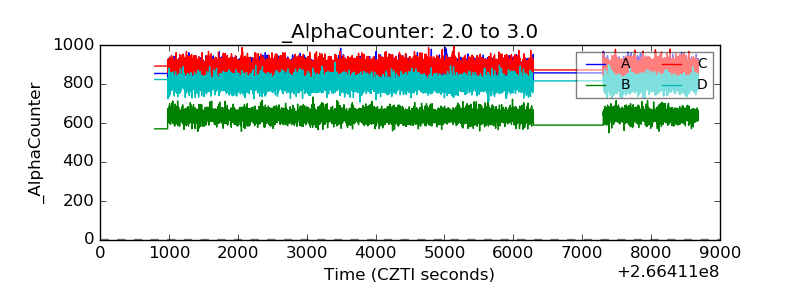 |
| _CPM_Rate | 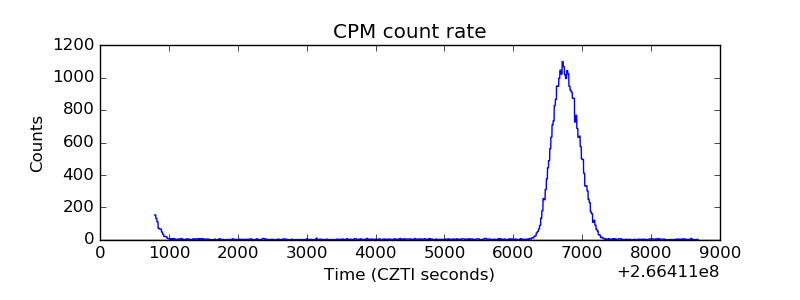 |
| CZT Counter | 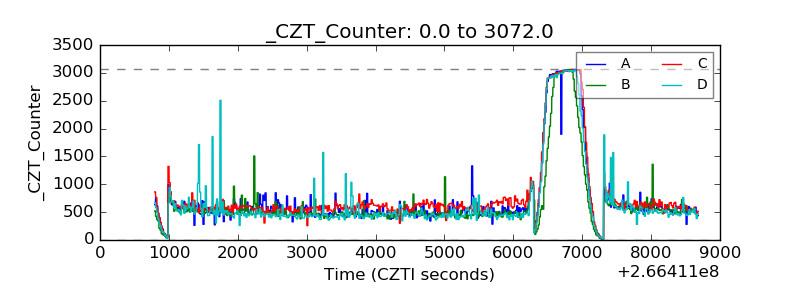 |
| +2.5 Volts monitor |  |
| +5 Volts monitor |  |
| _ROLL_ROT | 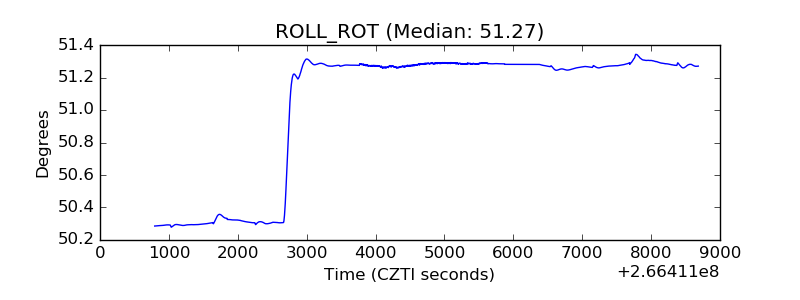 |
| _Roll_DEC | 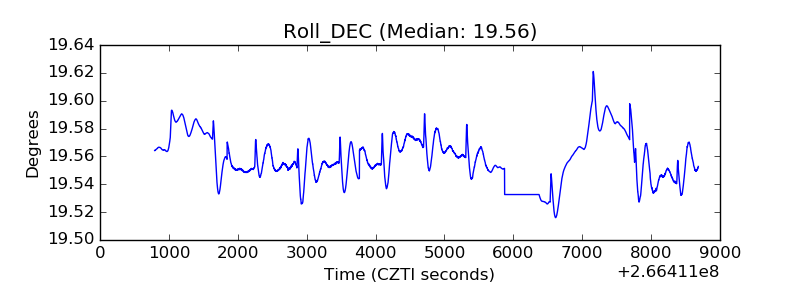 |
| _Roll_RA | 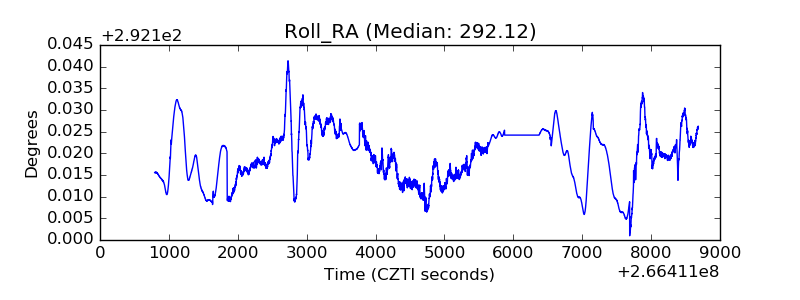 |
| Veto Counter | 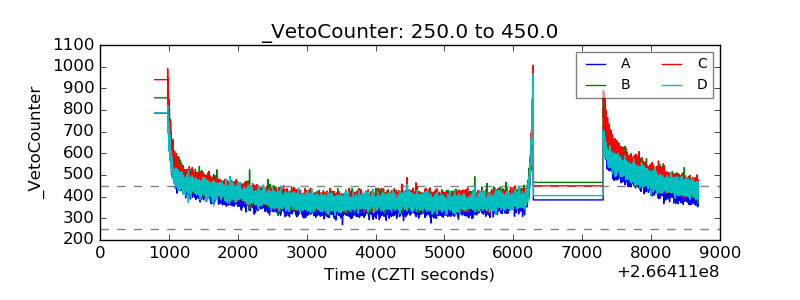 |