| Param | Original file | Final file |
|---|---|---|
| Filename | modeM0/AS1A04_016T01_9000002152_14615cztM0_level2.evt | modeM0/AS1A04_016T01_9000002152_14615cztM0_level2_quad_clean.evt |
| Size (bytes) | 480,286,080 | 75,409,920 |
| Size | 458.0 MB | 71.9 MB |
| Events in quadrant A | 3,413,378 | 467,492 |
| Events in quadrant B | 3,336,796 | 469,193 |
| Events in quadrant C | 3,853,011 | 454,995 |
| Events in quadrant D | 3,512,110 | 449,375 |
| Mode SS | |||
|---|---|---|---|
| Quadrant | BADHDUFLAG | Total packets | Discarded packets |
| A | 0 | 128 | 0 |
| B | 0 | 128 | 0 |
| C | 0 | 128 | 0 |
| D | 0 | 128 | 0 |
| Mode M0 | |||
|---|---|---|---|
| Quadrant | BADHDUFLAG | Total packets | Discarded packets |
| A | 0 | 14240 | 3 |
| B | 0 | 14008 | 2 |
| C | 0 | 15773 | 2 |
| D | 0 | 14485 | 2 |
| Mode M9 | |||
|---|---|---|---|
| Quadrant | BADHDUFLAG | Total packets | Discarded packets |
| A | 0 | 20 | 0 |
| B | 0 | 20 | 0 |
| C | 0 | 20 | 0 |
| D | 0 | 21 | 0 |
| Quadrant | Total seconds | Saturated seconds | Saturation percentage |
|---|---|---|---|
| A | 6341 | 57 | 0.898912% |
| B | 6341 | 62 | 0.977764% |
| C | 6341 | 44 | 0.693897% |
| D | 6341 | 177 | 2.791358% |
Noise dominated data is calculated using 1-second bins in cleaned event files. If a bin has >2000 counts, and if more than 50% of those come from <1% of pixels, then it is considered to be noise-dominated and hence unusable.
| Quadrant | # 1 sec bins | Bins with >0 counts | Bins with >2000 counts | High rate bins dominated by noise | Noise dominated (total time) | Noise dominated (detector-on time) | Marked lightcurve |
|---|---|---|---|---|---|---|---|
| A | 7487 | 6342 | 0 | 0 | 0.00% | 0.00% | 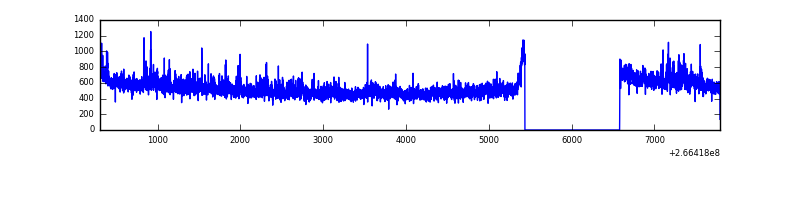 |
| B | 7487 | 6342 | 2 | 2 | 0.03% | 0.03% | 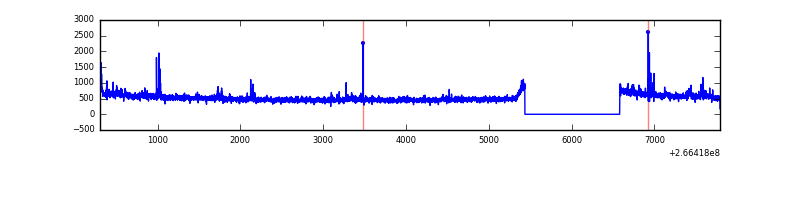 |
| C | 7487 | 6342 | 0 | 0 | 0.00% | 0.00% |  |
| D | 7487 | 6342 | 86 | 86 | 1.15% | 1.36% | 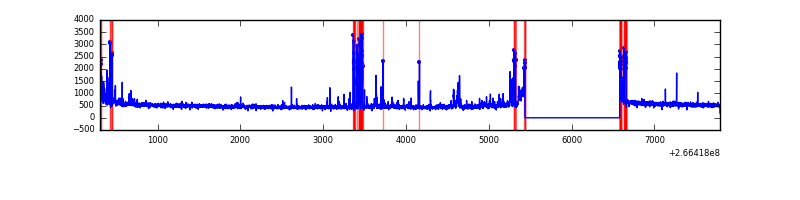 |
Top three noisy pixels from each quadrant. If the there are fewer than three noisy pixels in the level2.evt file, extra rows are filled as -1
| Pixel properties | Quadrant properties | ||||||
|---|---|---|---|---|---|---|---|
| Quadrant | DetID | PixID | Counts | Sigma | Mean | Median | Sigma |
| A | 1 | 162 | 90773 | 537.37 | 824 | 807 | 167.4 |
| A | 1 | 178 | 35680 | 208.3 | 824 | 807 | 167.4 |
| A | 1 | 161 | 31919 | 185.83 | 824 | 807 | 167.4 |
| B | 0 | 189 | 46669 | 296.91 | 820 | 800 | 154.5 |
| B | 0 | 229 | 35575 | 225.1 | 820 | 800 | 154.5 |
| B | 12 | 111 | 18144 | 112.27 | 820 | 800 | 154.5 |
| C | 3 | 233 | 734913 | 3973.64 | 799 | 805 | 184.7 |
| C | 13 | 61 | 5586 | 25.88 | 799 | 805 | 184.7 |
| C | 14 | 234 | 2493 | 9.14 | 799 | 805 | 184.7 |
| D | 10 | 199 | 396978 | 2112.66 | 793 | 774 | 187.5 |
| D | 10 | 70 | 71288 | 376.0 | 793 | 774 | 187.5 |
| D | 14 | 35 | 24496 | 126.49 | 793 | 774 | 187.5 |
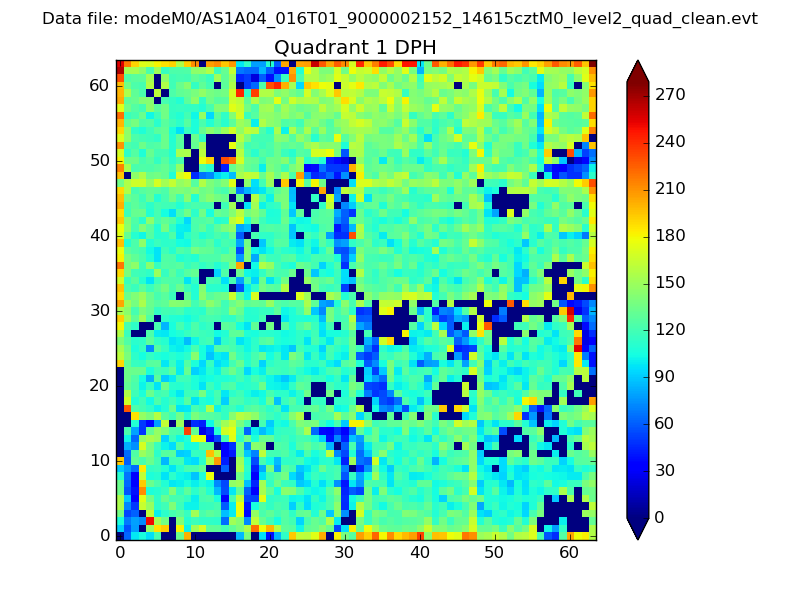
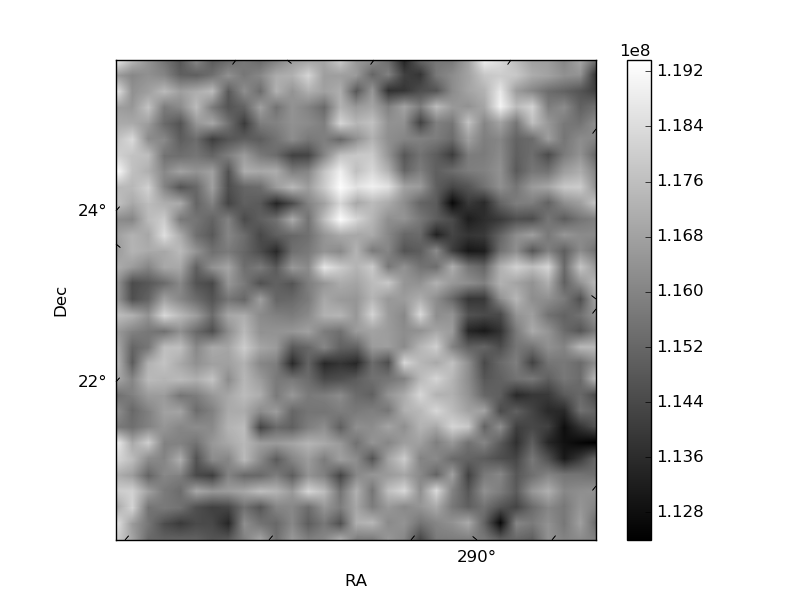
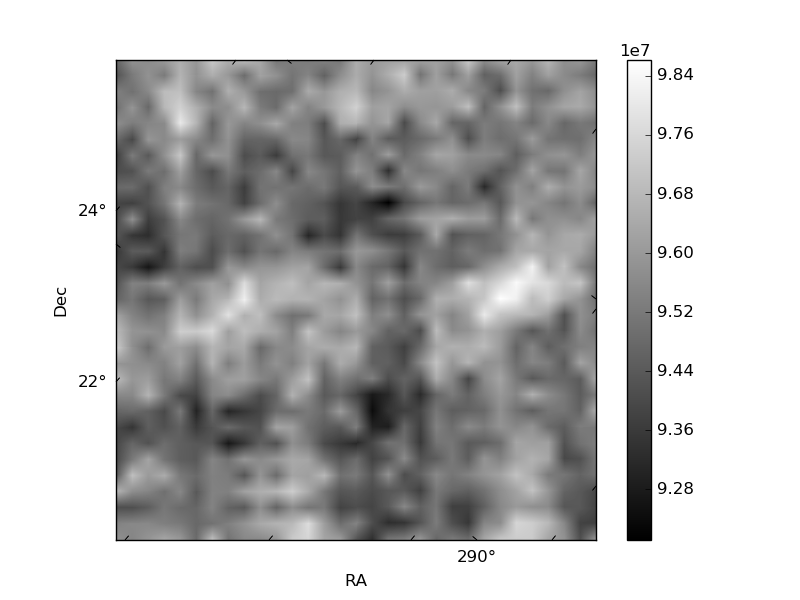
Histogram calculated using DETX and DETY for each event in the final _common_clean file
| Quadrant A | 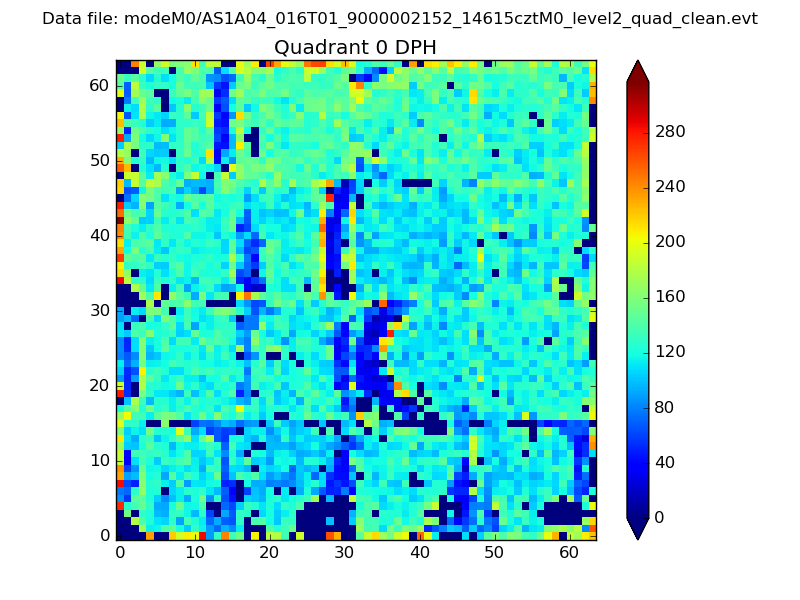 |
 |
Quadrant B |
|---|---|---|---|
| Quadrant D | 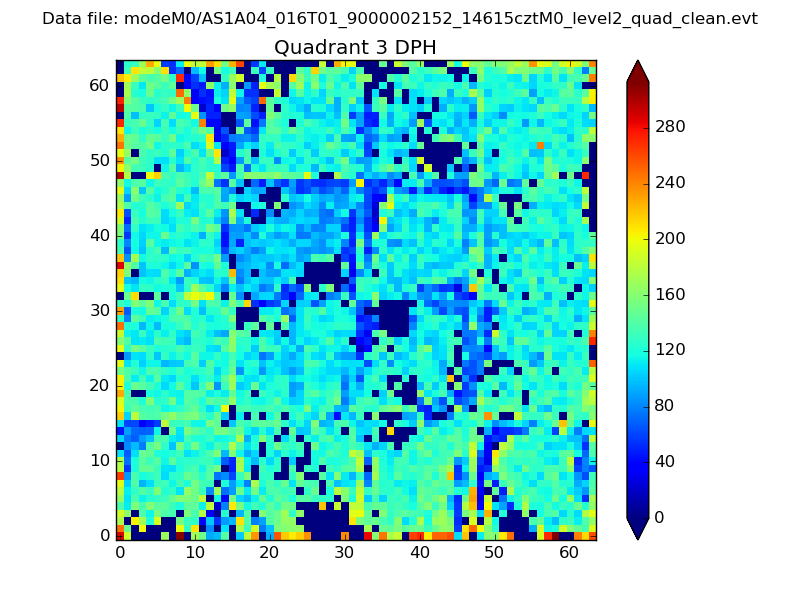 |
 |
Quadrant C |
| Plot type | Count rate plots | Images |
|---|---|---|
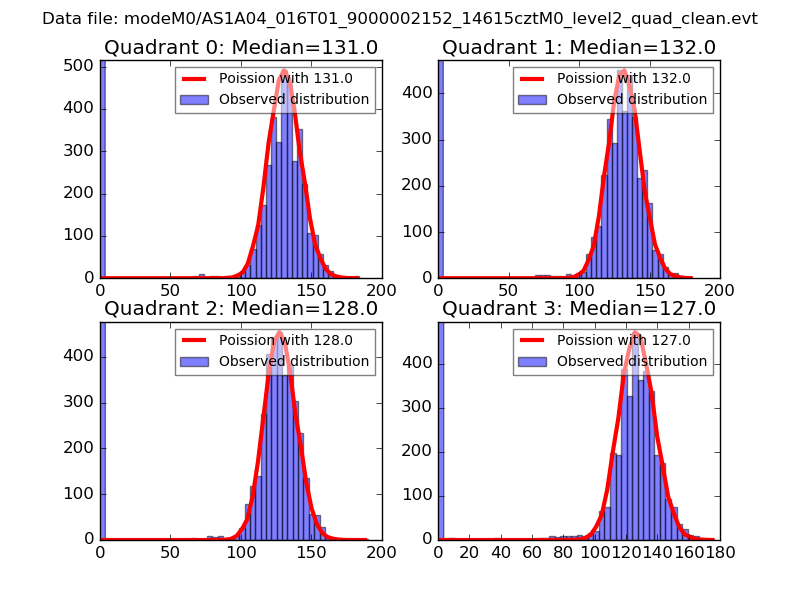
| Comparison with Poisson distribution Blue bars denote a histogram of data divided into 1 sec bins. Red curve is a Poisson curve with rate = median count rate of data. |
 |
 |
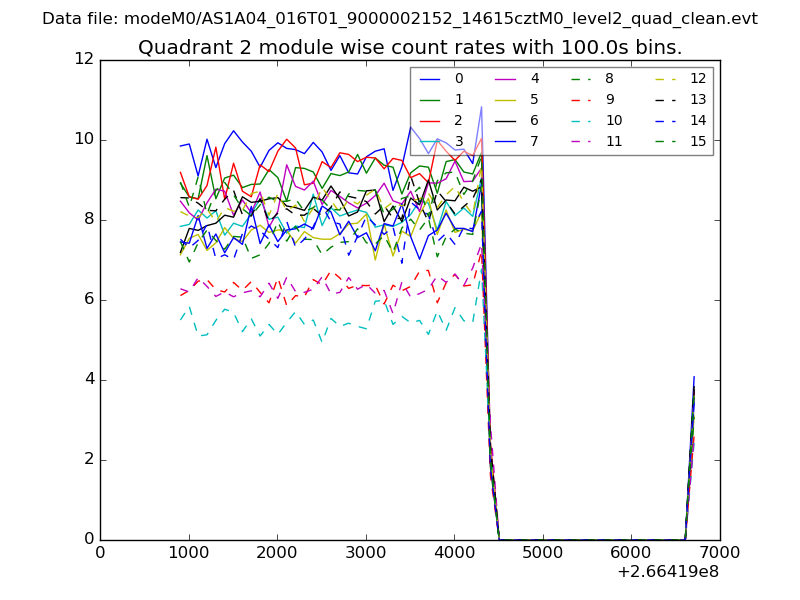
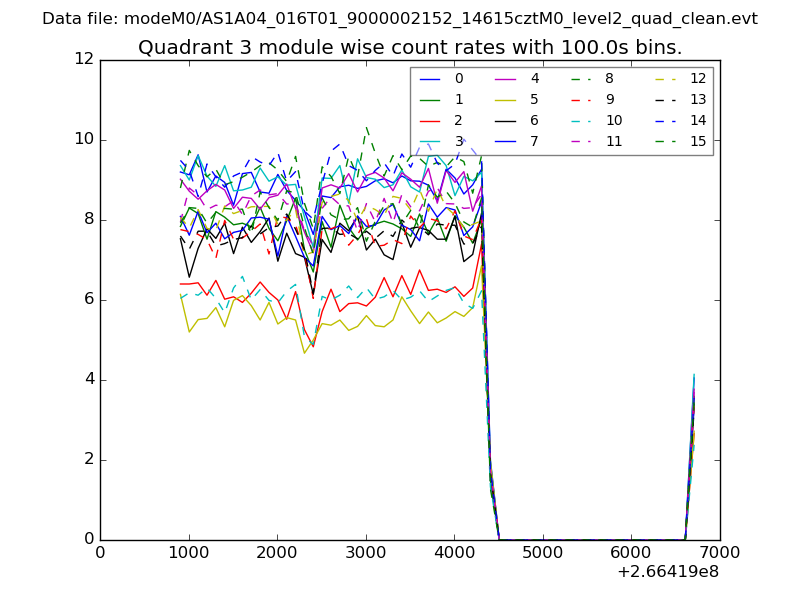
| Quadrant-wise count rates Data is divided into 100 sec bins |
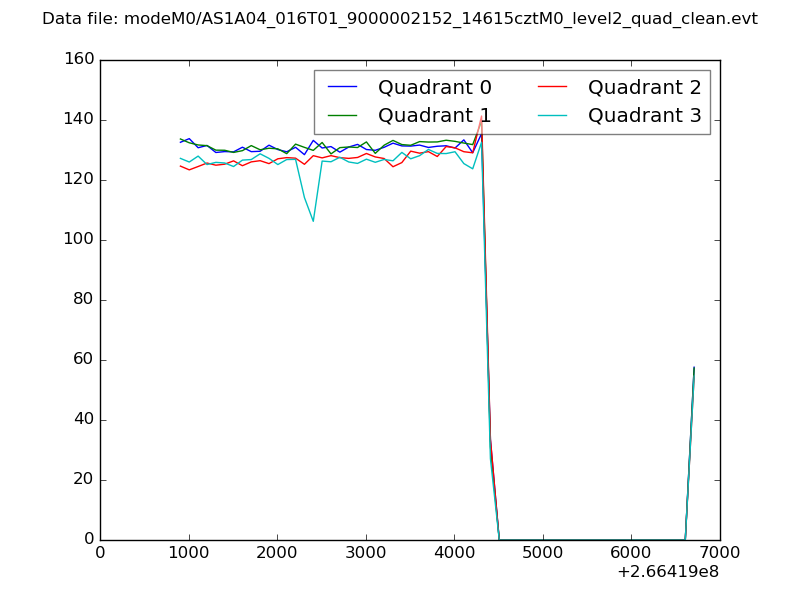 |
|
| Module-wise count rates for Quadrant A Data is divided into 100 sec bins |
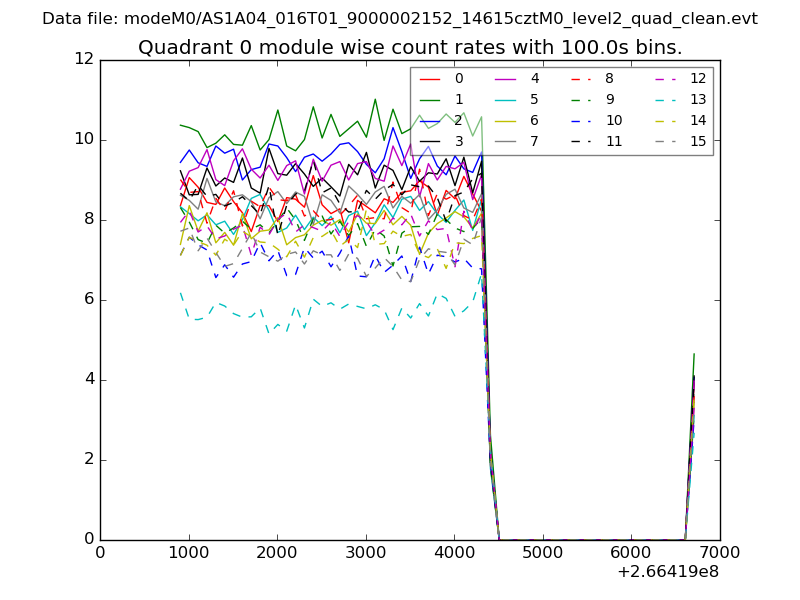 |
 |
| Module-wise count rates for Quadrant B Data is divided into 100 sec bins |
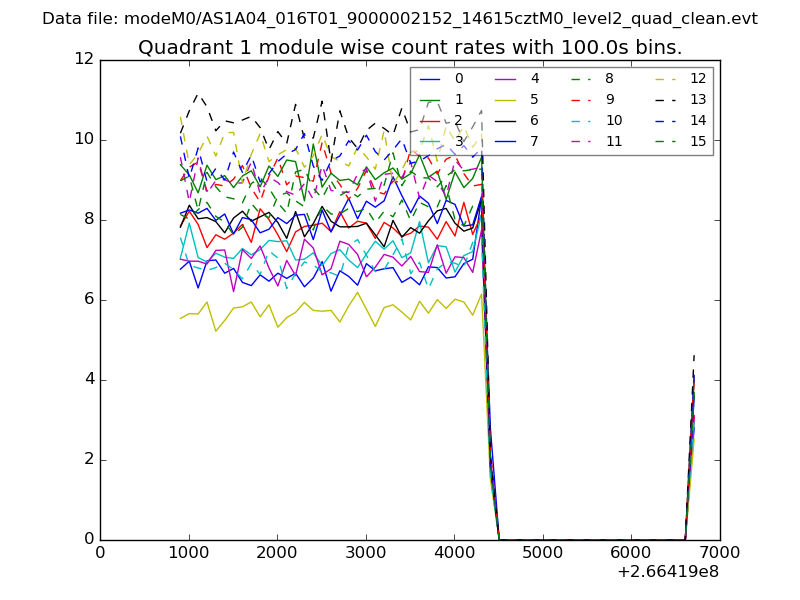 |
 |
| Module-wise count rates for Quadrant C Data is divided into 100 sec bins |
 |
 |
| Module-wise count rates for Quadrant D Data is divided into 100 sec bins |
 |
 |
| Parameter | Plot |
|---|---|
| CZT HV Monitor | 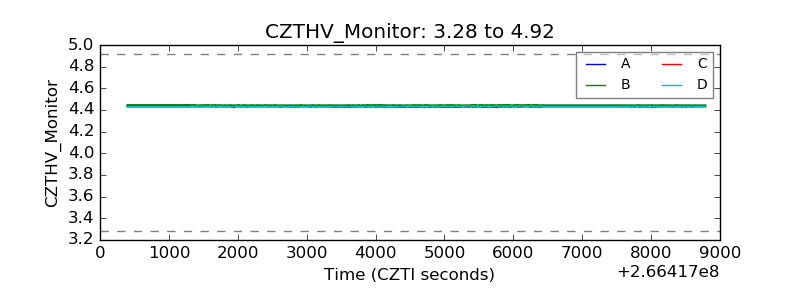 |
| D_VDD | 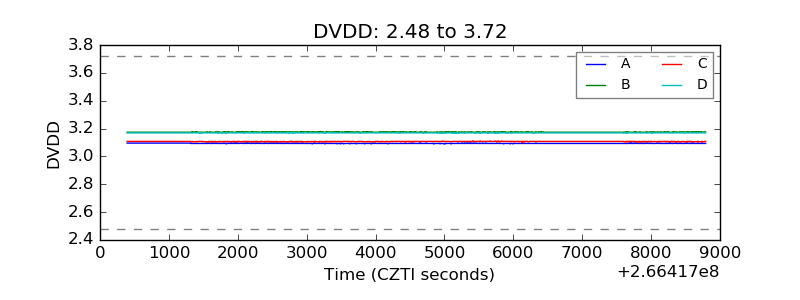 |
| Temperature 1 | 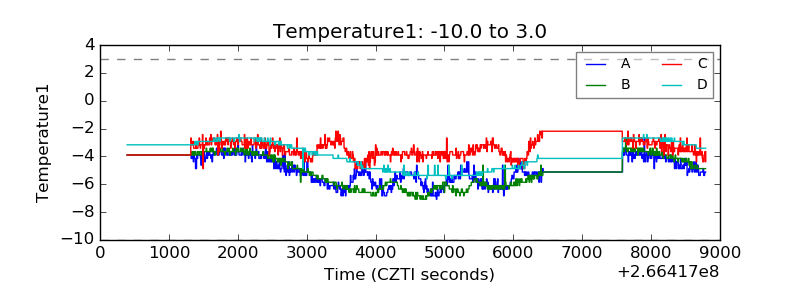 |
| Veto HV Monitor | 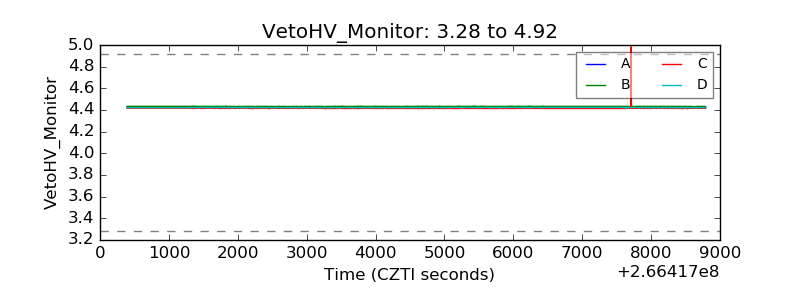 |
| Veto LLD | 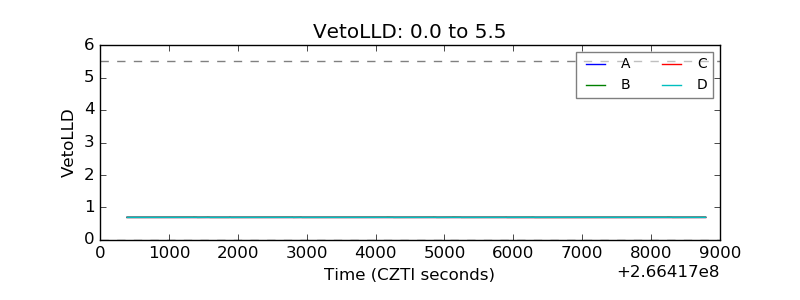 |
| Alpha Counter | 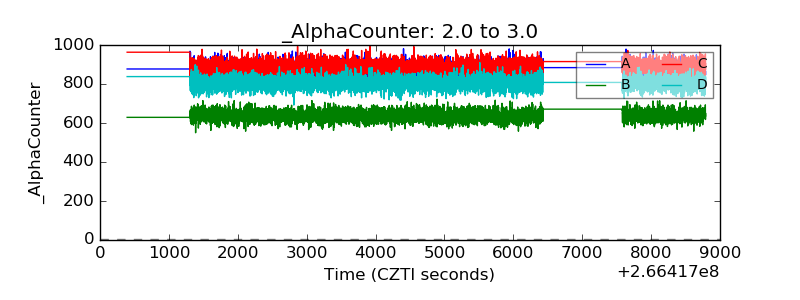 |
| _CPM_Rate |  |
| CZT Counter |  |
| +2.5 Volts monitor | 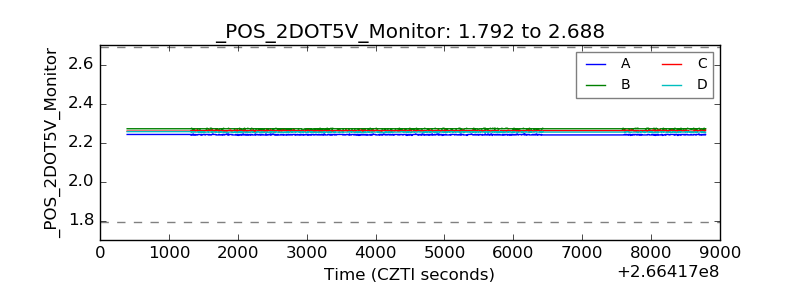 |
| +5 Volts monitor |  |
| _ROLL_ROT | 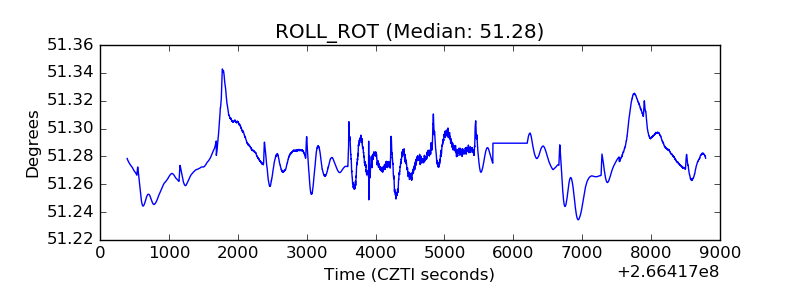 |
| _Roll_DEC | 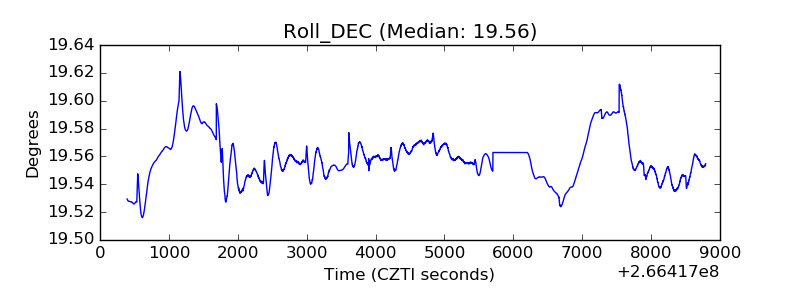 |
| _Roll_RA | 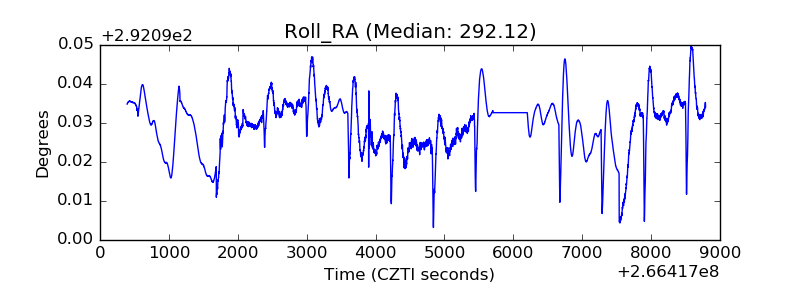 |
| Veto Counter | 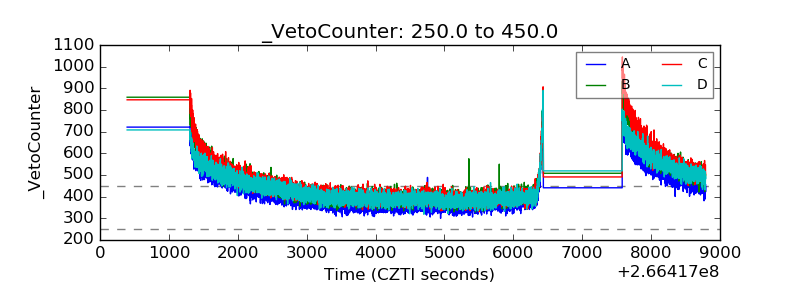 |