| Param | Original file | Final file |
|---|---|---|
| Filename | modeM0/AS1A04_016T01_9000002152_14619cztM0_level2.evt | modeM0/AS1A04_016T01_9000002152_14619cztM0_level2_quad_clean.evt |
| Size (bytes) | 500,123,520 | 109,653,120 |
| Size | 477.0 MB | 104.6 MB |
| Events in quadrant A | 3,395,218 | 720,888 |
| Events in quadrant B | 3,309,442 | 740,983 |
| Events in quadrant C | 3,941,760 | 726,615 |
| Events in quadrant D | 4,079,235 | 699,485 |
| Mode SS | |||
|---|---|---|---|
| Quadrant | BADHDUFLAG | Total packets | Discarded packets |
| A | 0 | 126 | 0 |
| B | 0 | 126 | 0 |
| C | 0 | 126 | 0 |
| D | 0 | 126 | 0 |
| Mode M0 | |||
|---|---|---|---|
| Quadrant | BADHDUFLAG | Total packets | Discarded packets |
| A | 0 | 14026 | 3 |
| B | 0 | 13741 | 2 |
| C | 0 | 16628 | 2 |
| D | 0 | 16360 | 2 |
| Mode M9 | |||
|---|---|---|---|
| Quadrant | BADHDUFLAG | Total packets | Discarded packets |
| A | 0 | 19 | 0 |
| B | 0 | 19 | 0 |
| C | 0 | 19 | 0 |
| D | 0 | 20 | 0 |
| Quadrant | Total seconds | Saturated seconds | Saturation percentage |
|---|---|---|---|
| A | 6206 | 47 | 0.757332% |
| B | 6206 | 68 | 1.095714% |
| C | 6206 | 45 | 0.725105% |
| D | 6206 | 152 | 2.449243% |
Noise dominated data is calculated using 1-second bins in cleaned event files. If a bin has >2000 counts, and if more than 50% of those come from <1% of pixels, then it is considered to be noise-dominated and hence unusable.
| Quadrant | # 1 sec bins | Bins with >0 counts | Bins with >2000 counts | High rate bins dominated by noise | Noise dominated (total time) | Noise dominated (detector-on time) | Marked lightcurve |
|---|---|---|---|---|---|---|---|
| A | 7547 | 6208 | 1 | 1 | 0.01% | 0.02% | 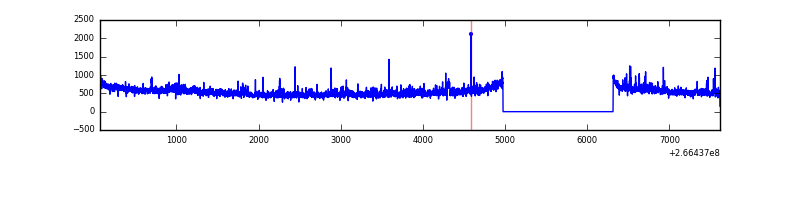 |
| B | 7547 | 6208 | 1 | 1 | 0.01% | 0.02% | 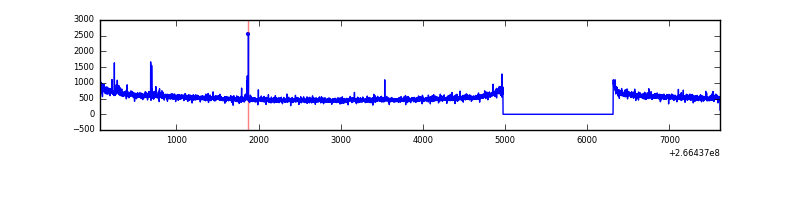 |
| C | 7547 | 6208 | 1 | 1 | 0.01% | 0.02% | 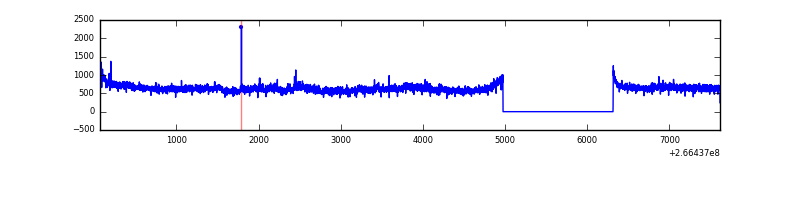 |
| D | 7547 | 6208 | 121 | 121 | 1.60% | 1.95% | 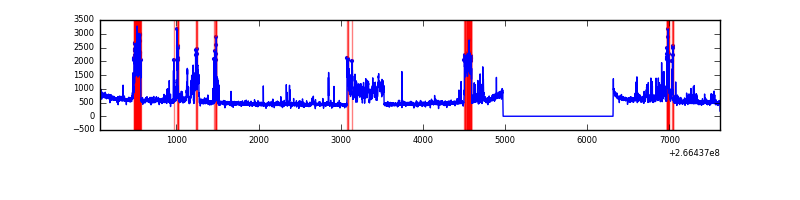 |
Top three noisy pixels from each quadrant. If the there are fewer than three noisy pixels in the level2.evt file, extra rows are filled as -1
| Pixel properties | Quadrant properties | ||||||
|---|---|---|---|---|---|---|---|
| Quadrant | DetID | PixID | Counts | Sigma | Mean | Median | Sigma |
| A | 1 | 162 | 97699 | 582.43 | 825 | 810 | 166.4 |
| A | 1 | 178 | 39859 | 234.74 | 825 | 810 | 166.4 |
| A | 1 | 161 | 35578 | 209.0 | 825 | 810 | 166.4 |
| B | 0 | 189 | 26952 | 168.32 | 829 | 809 | 155.3 |
| B | 0 | 214 | 19463 | 120.1 | 829 | 809 | 155.3 |
| B | 12 | 111 | 18115 | 111.42 | 829 | 809 | 155.3 |
| C | 3 | 233 | 735434 | 3891.92 | 821 | 828 | 188.8 |
| C | 13 | 61 | 5860 | 26.66 | 821 | 828 | 188.8 |
| C | 12 | 4 | 4399 | 18.92 | 821 | 828 | 188.8 |
| D | 12 | 110 | 544629 | 2840.13 | 812 | 796 | 191.5 |
| D | 10 | 199 | 306000 | 1593.91 | 812 | 796 | 191.5 |
| D | 15 | 145 | 48474 | 248.99 | 812 | 796 | 191.5 |
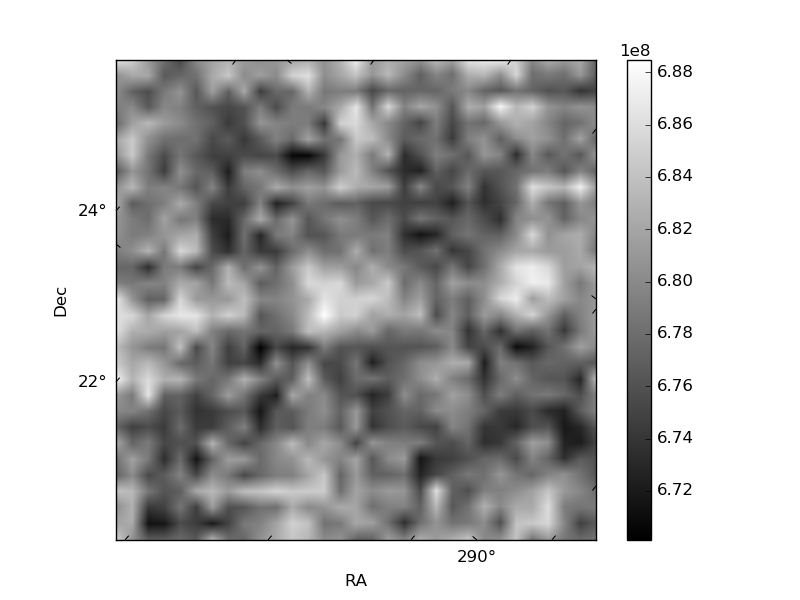
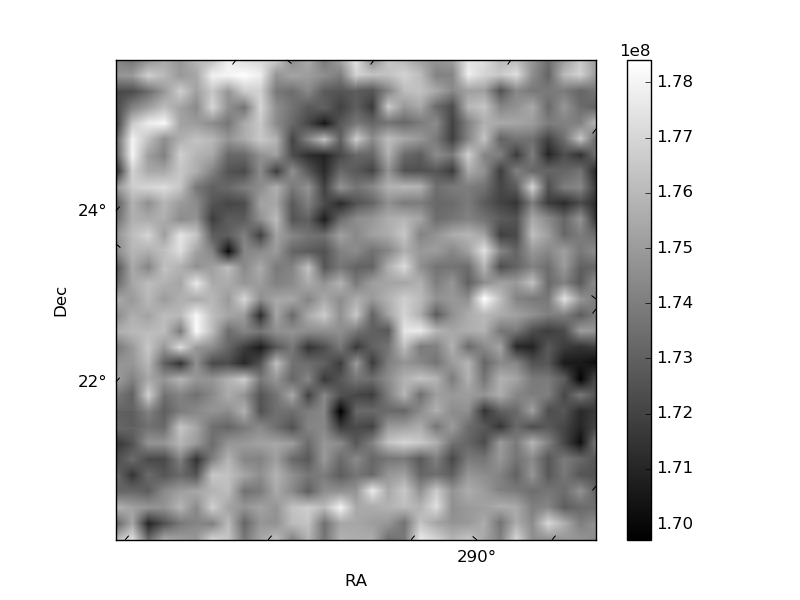
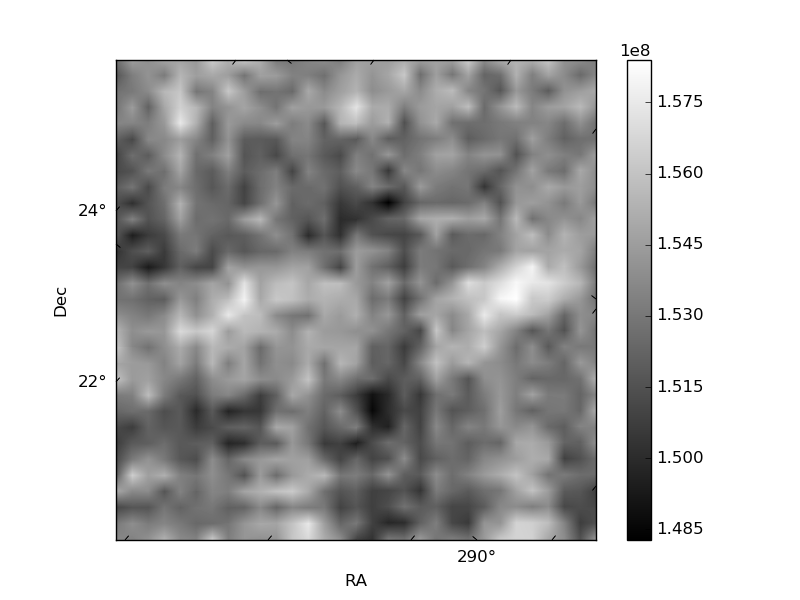
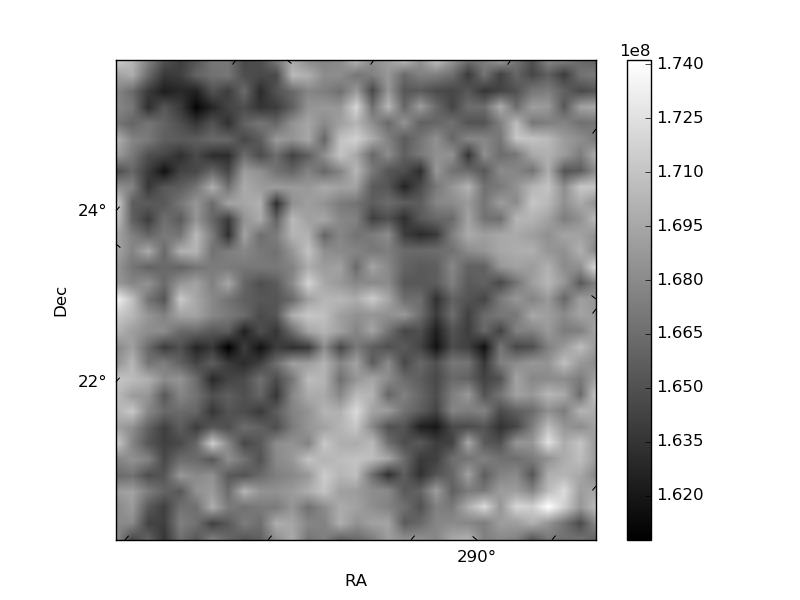
Histogram calculated using DETX and DETY for each event in the final _common_clean file
| Quadrant A | 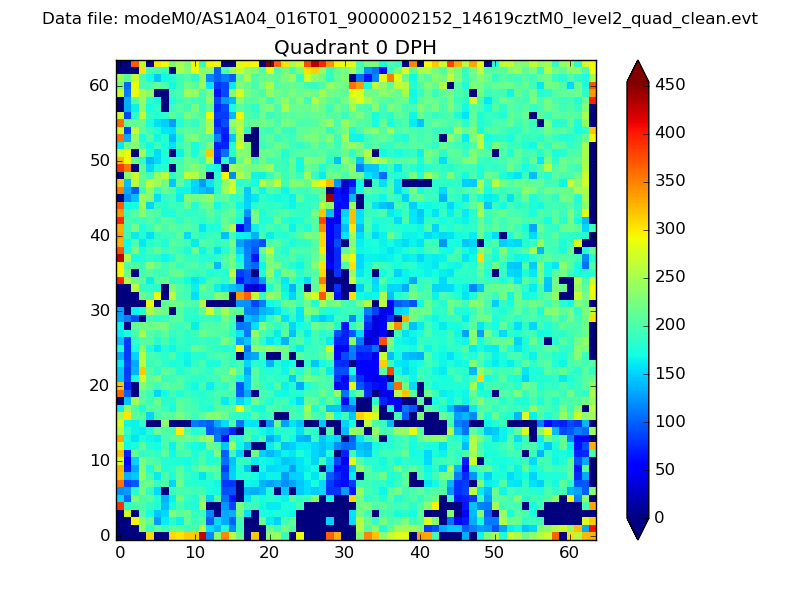 |
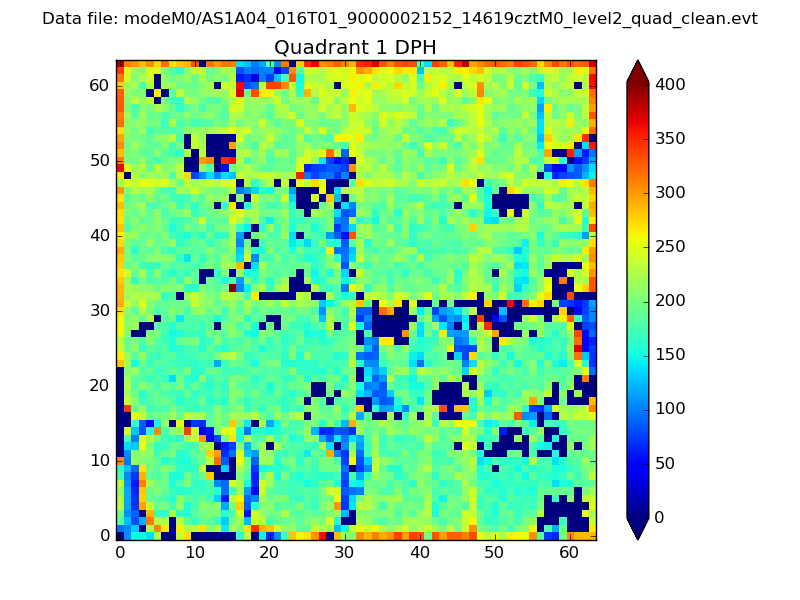 |
Quadrant B |
|---|---|---|---|
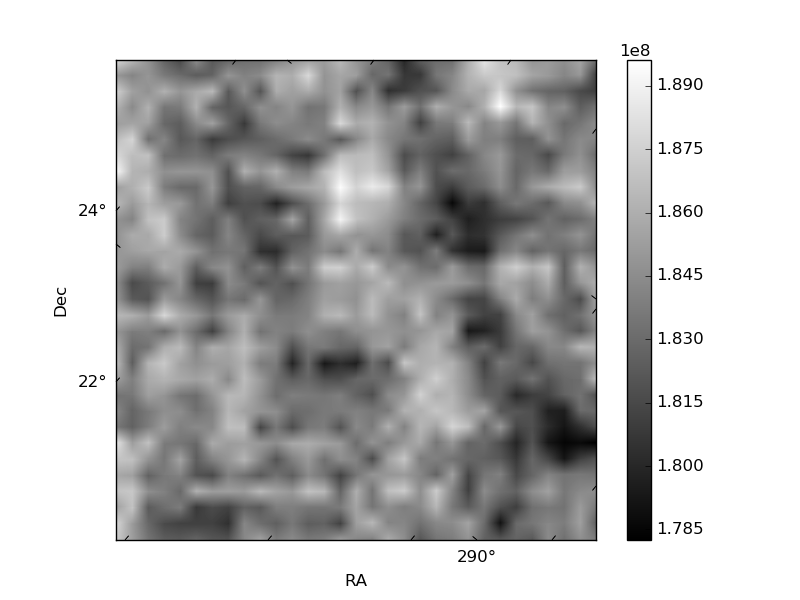
| Quadrant D | 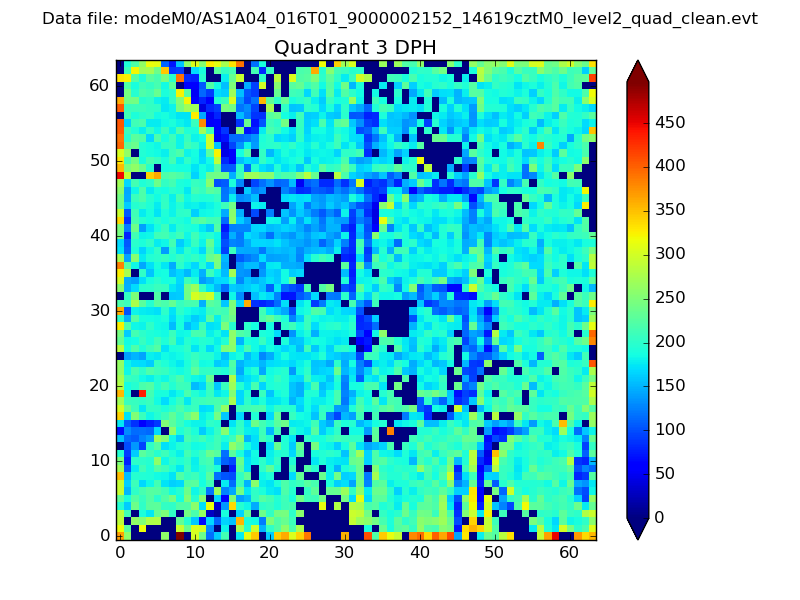 |
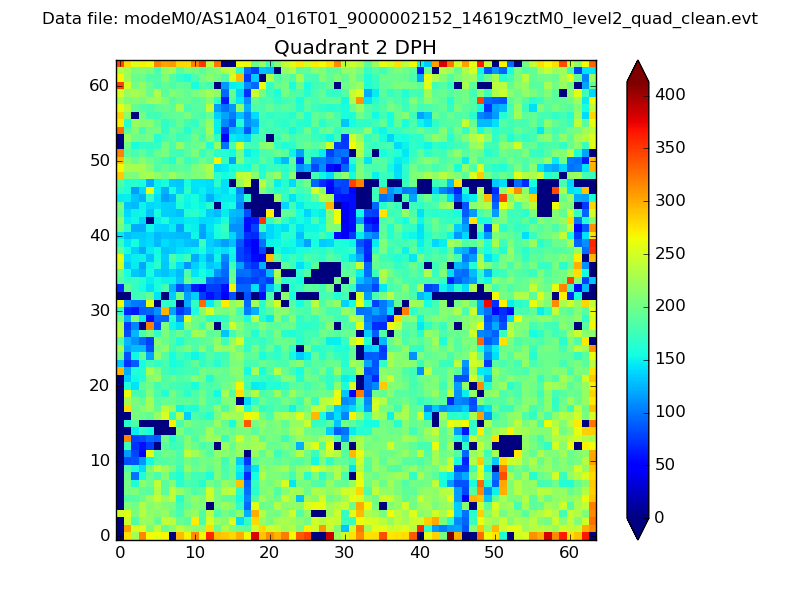 |
Quadrant C |
| Plot type | Count rate plots | Images |
|---|---|---|
| Comparison with Poisson distribution Blue bars denote a histogram of data divided into 1 sec bins. Red curve is a Poisson curve with rate = median count rate of data. |
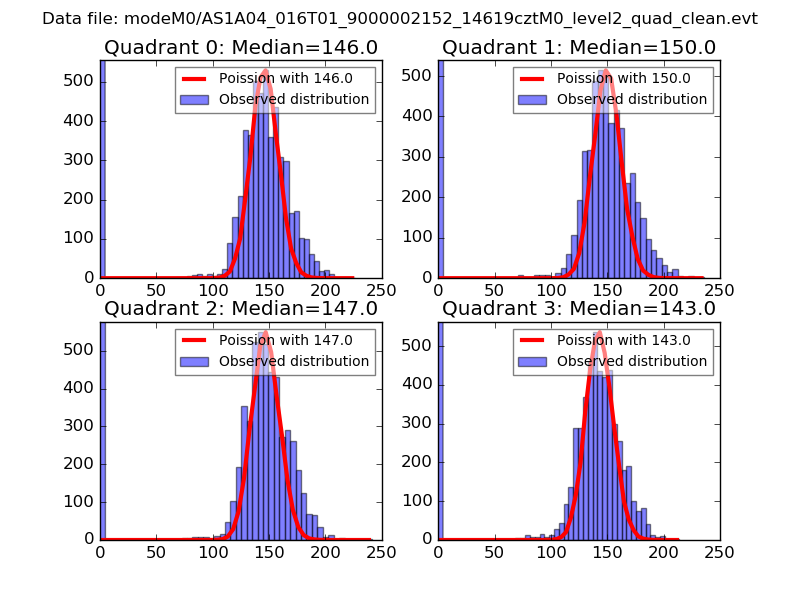 |
 |
| Quadrant-wise count rates Data is divided into 100 sec bins |
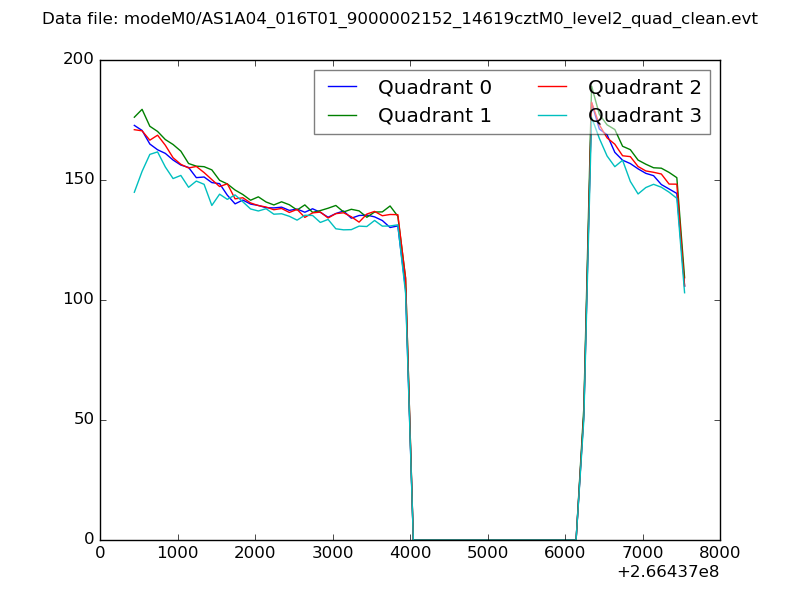 |
|
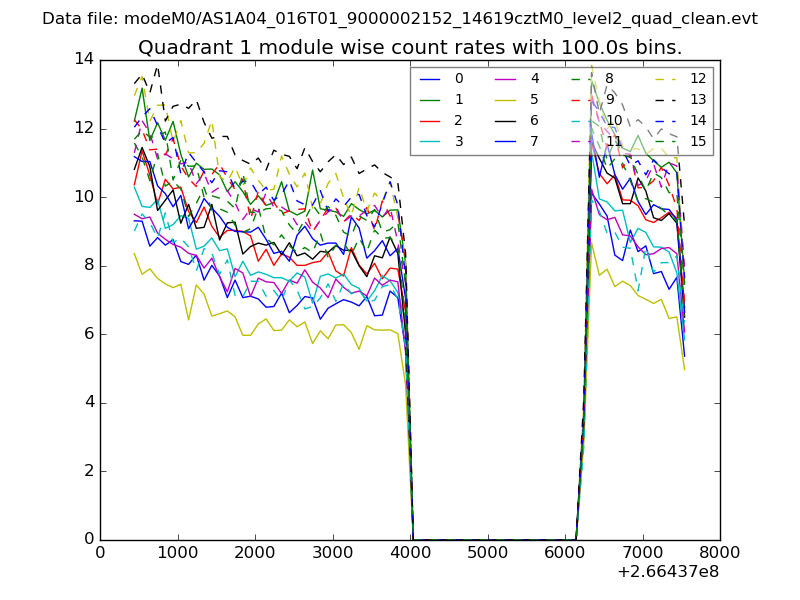
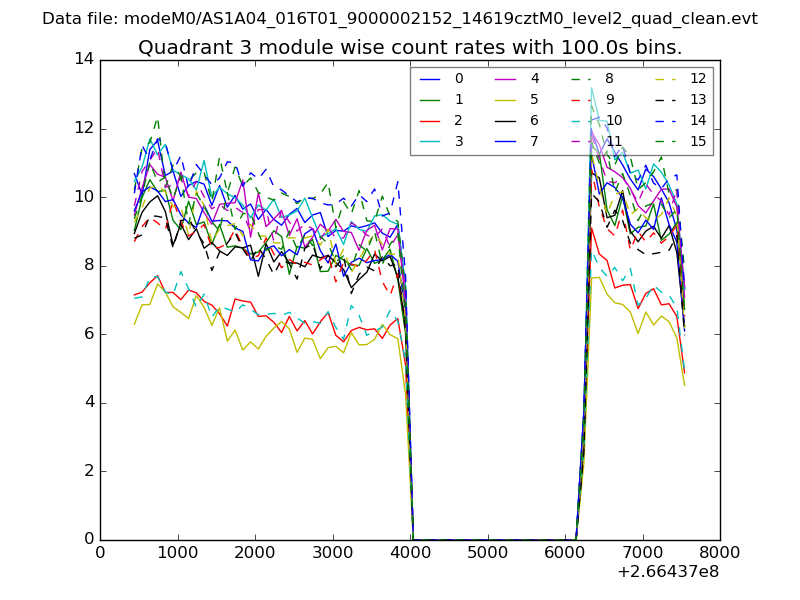
| Module-wise count rates for Quadrant A Data is divided into 100 sec bins |
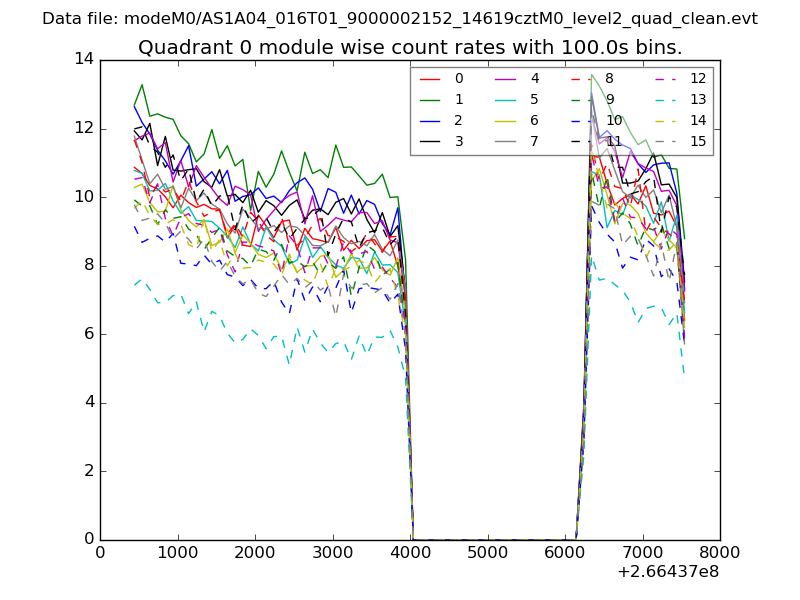 |
 |
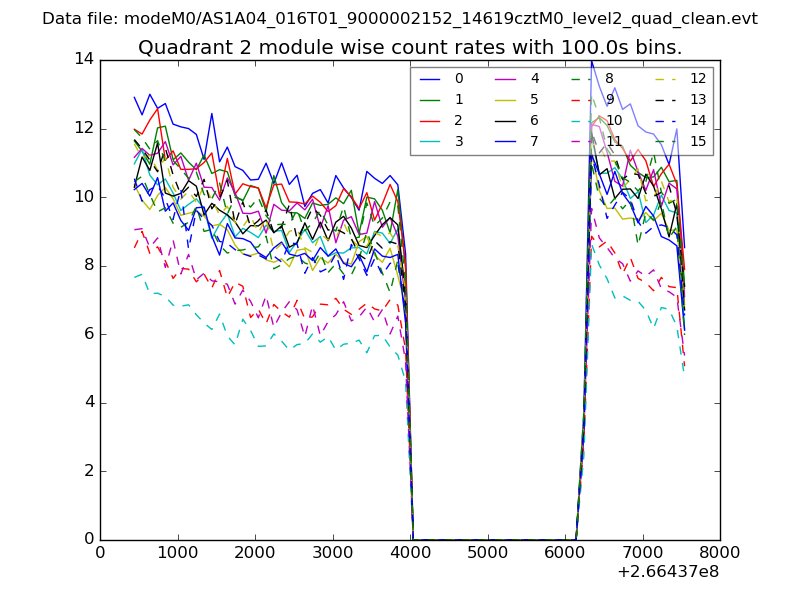
| Module-wise count rates for Quadrant B Data is divided into 100 sec bins |
 |
 |
| Module-wise count rates for Quadrant C Data is divided into 100 sec bins |
 |
 |
| Module-wise count rates for Quadrant D Data is divided into 100 sec bins |
 |
 |
| Parameter | Plot |
|---|---|
| CZT HV Monitor | 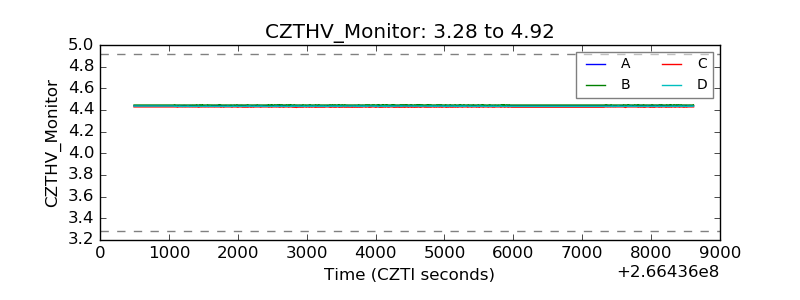 |
| D_VDD | 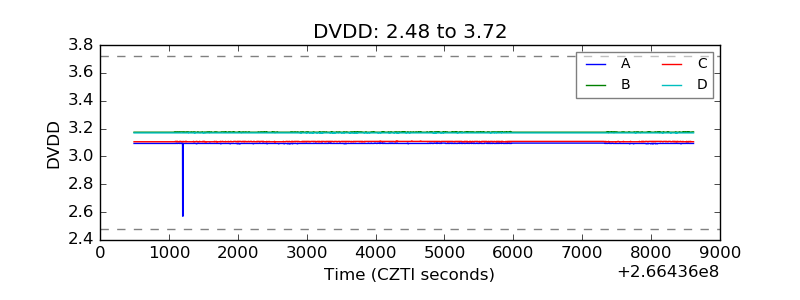 |
| Temperature 1 | 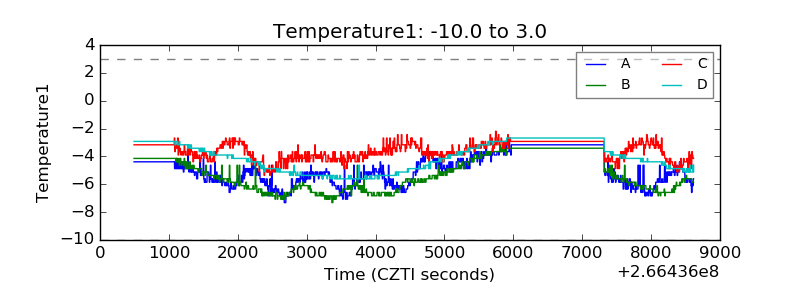 |
| Veto HV Monitor | 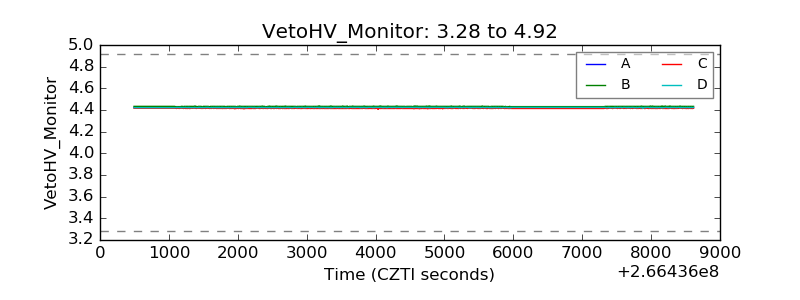 |
| Veto LLD | 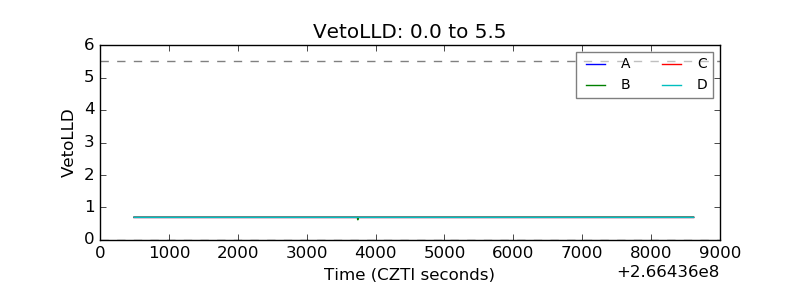 |
| Alpha Counter | 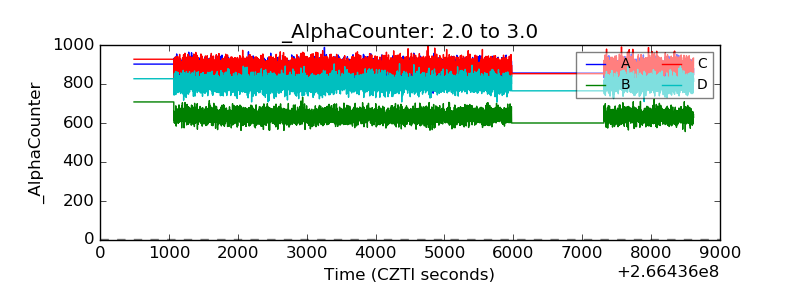 |
| _CPM_Rate | 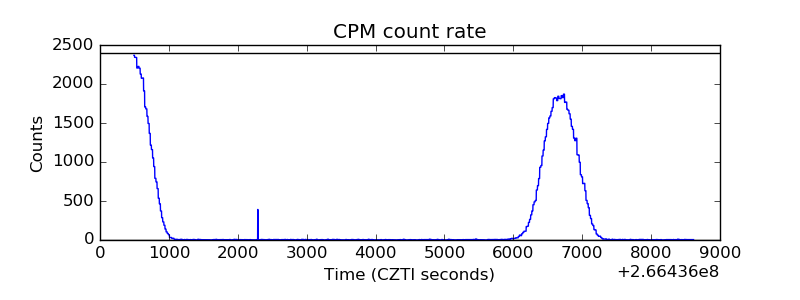 |
| CZT Counter | 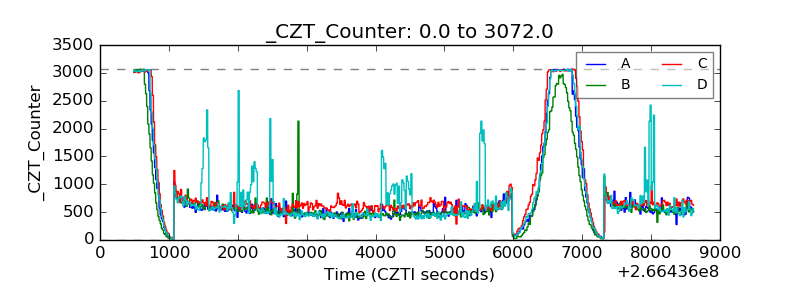 |
| +2.5 Volts monitor | 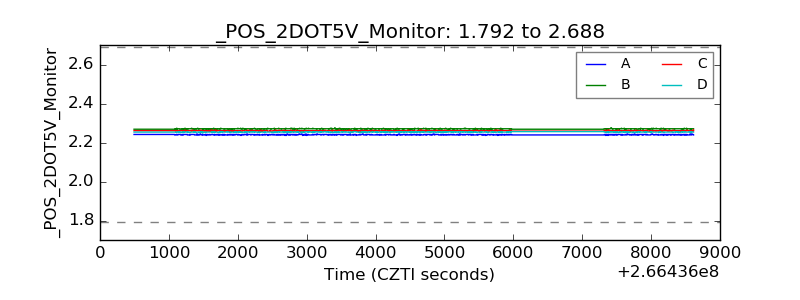 |
| +5 Volts monitor |  |
| _ROLL_ROT | 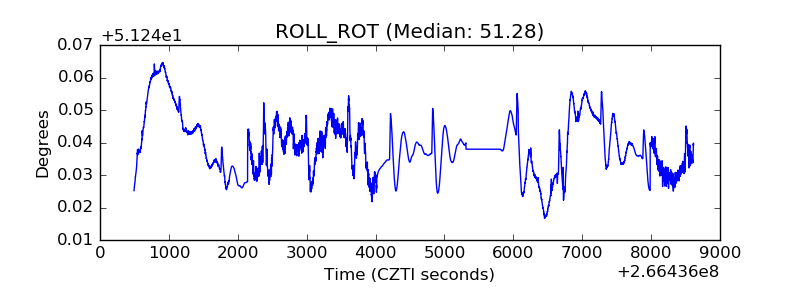 |
| _Roll_DEC | 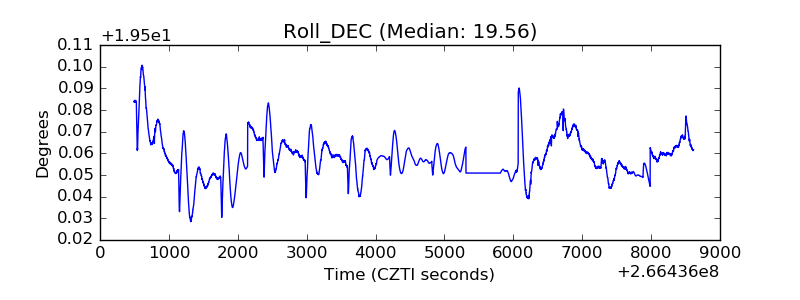 |
| _Roll_RA | 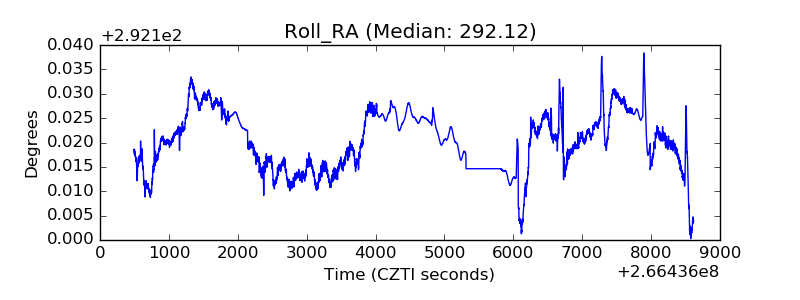 |
| Veto Counter | 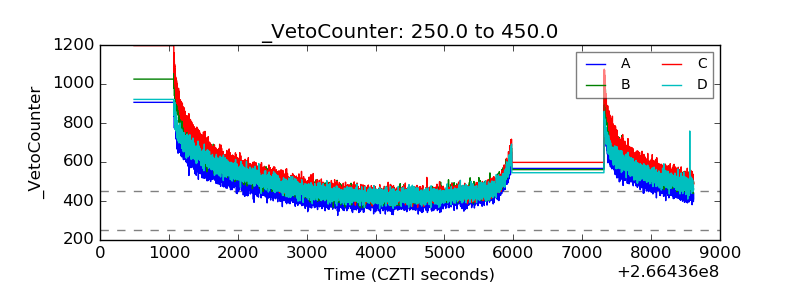 |