| Param | Original file | Final file |
|---|---|---|
| Filename | modeM0/AS1A04_016T01_9000002152_14620cztM0_level2.evt | modeM0/AS1A04_016T01_9000002152_14620cztM0_level2_quad_clean.evt |
| Size (bytes) | 517,072,320 | 104,051,520 |
| Size | 493.1 MB | 99.2 MB |
| Events in quadrant A | 3,431,889 | 681,464 |
| Events in quadrant B | 3,340,280 | 696,919 |
| Events in quadrant C | 4,150,653 | 685,048 |
| Events in quadrant D | 4,305,515 | 644,096 |
| Mode SS | |||
|---|---|---|---|
| Quadrant | BADHDUFLAG | Total packets | Discarded packets |
| A | 0 | 130 | 0 |
| B | 0 | 130 | 0 |
| C | 0 | 130 | 0 |
| D | 0 | 130 | 0 |
| Mode M0 | |||
|---|---|---|---|
| Quadrant | BADHDUFLAG | Total packets | Discarded packets |
| A | 0 | 14244 | 3 |
| B | 0 | 13914 | 2 |
| C | 0 | 17476 | 2 |
| D | 0 | 17200 | 2 |
| Mode M9 | |||
|---|---|---|---|
| Quadrant | BADHDUFLAG | Total packets | Discarded packets |
| A | 0 | 26 | 0 |
| B | 0 | 26 | 0 |
| C | 0 | 26 | 0 |
| D | 0 | 26 | 0 |
| Quadrant | Total seconds | Saturated seconds | Saturation percentage |
|---|---|---|---|
| A | 6361 | 101 | 1.587801% |
| B | 6361 | 164 | 2.578211% |
| C | 6361 | 107 | 1.682125% |
| D | 6361 | 375 | 5.895299% |
Noise dominated data is calculated using 1-second bins in cleaned event files. If a bin has >2000 counts, and if more than 50% of those come from <1% of pixels, then it is considered to be noise-dominated and hence unusable.
| Quadrant | # 1 sec bins | Bins with >0 counts | Bins with >2000 counts | High rate bins dominated by noise | Noise dominated (total time) | Noise dominated (detector-on time) | Marked lightcurve |
|---|---|---|---|---|---|---|---|
| A | 8917 | 6364 | 3 | 3 | 0.03% | 0.05% | 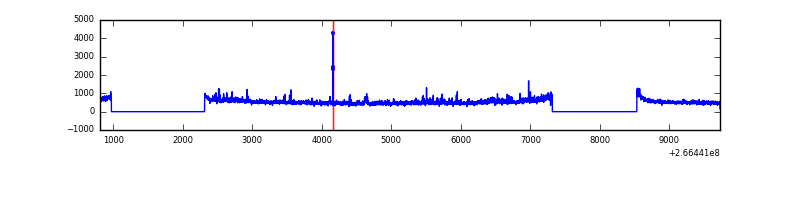 |
| B | 8917 | 6364 | 3 | 3 | 0.03% | 0.05% | 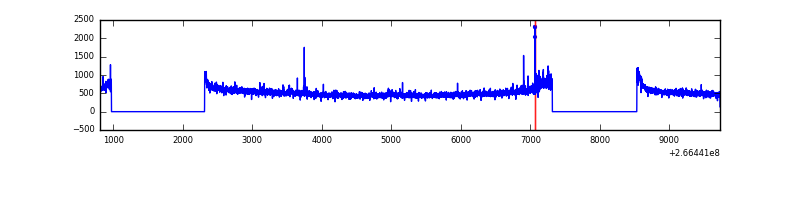 |
| C | 8917 | 6364 | 0 | 0 | 0.00% | 0.00% | 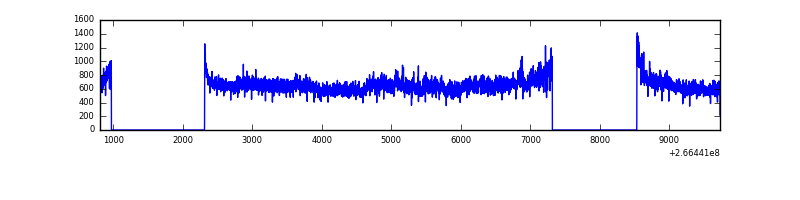 |
| D | 8917 | 6364 | 270 | 270 | 3.03% | 4.24% | 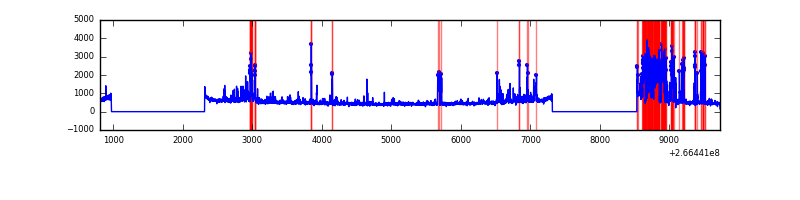 |
Top three noisy pixels from each quadrant. If the there are fewer than three noisy pixels in the level2.evt file, extra rows are filled as -1
| Pixel properties | Quadrant properties | ||||||
|---|---|---|---|---|---|---|---|
| Quadrant | DetID | PixID | Counts | Sigma | Mean | Median | Sigma |
| A | 1 | 162 | 105123 | 628.81 | 829 | 813 | 165.9 |
| A | 1 | 178 | 39220 | 231.53 | 829 | 813 | 165.9 |
| A | 1 | 161 | 35367 | 208.3 | 829 | 813 | 165.9 |
| B | 0 | 229 | 32962 | 204.15 | 832 | 810 | 157.5 |
| B | 0 | 189 | 26693 | 164.34 | 832 | 810 | 157.5 |
| B | 12 | 111 | 18989 | 115.43 | 832 | 810 | 157.5 |
| C | 3 | 233 | 945312 | 4978.83 | 822 | 826 | 189.7 |
| C | 13 | 61 | 5875 | 26.62 | 822 | 826 | 189.7 |
| C | 14 | 234 | 1975 | 6.06 | 822 | 826 | 189.7 |
| D | 10 | 199 | 1042033 | 5516.28 | 797 | 779 | 188.8 |
| D | 1 | 52 | 67055 | 351.11 | 797 | 779 | 188.8 |
| D | 12 | 110 | 59040 | 308.65 | 797 | 779 | 188.8 |
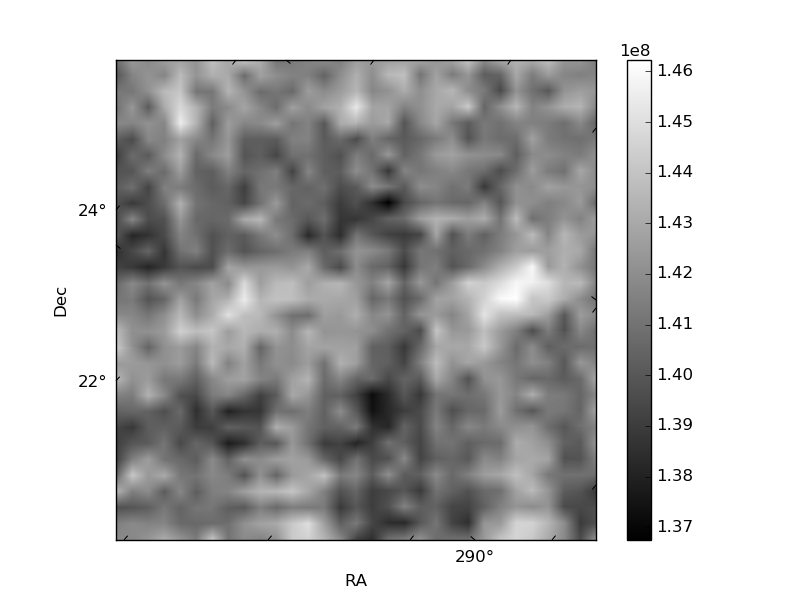
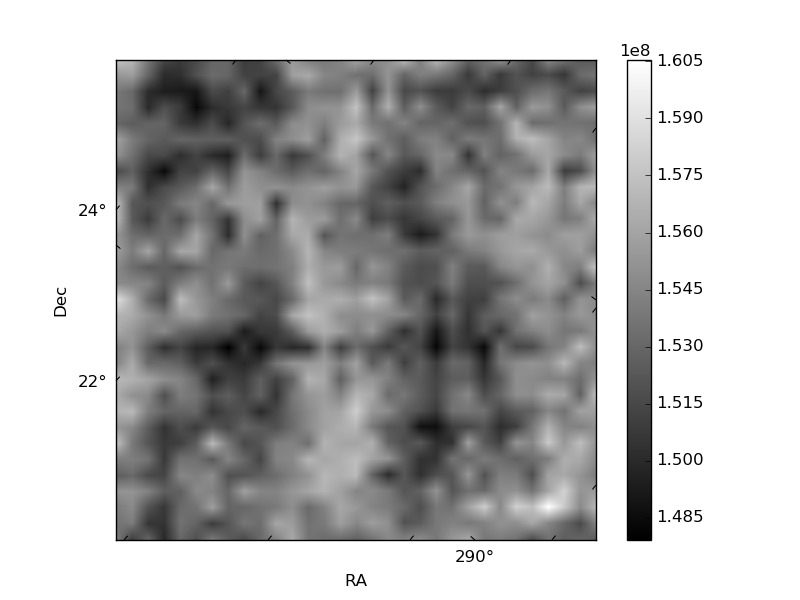
Histogram calculated using DETX and DETY for each event in the final _common_clean file
| Quadrant A | 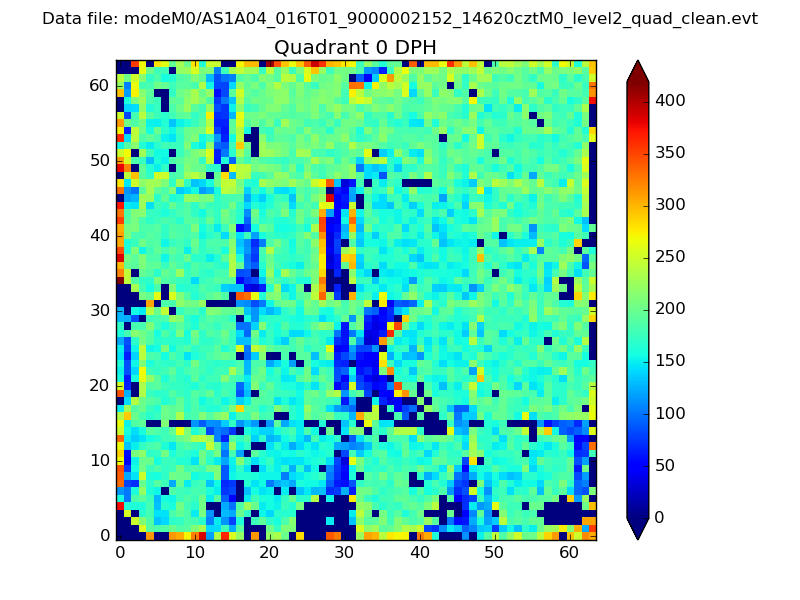 |
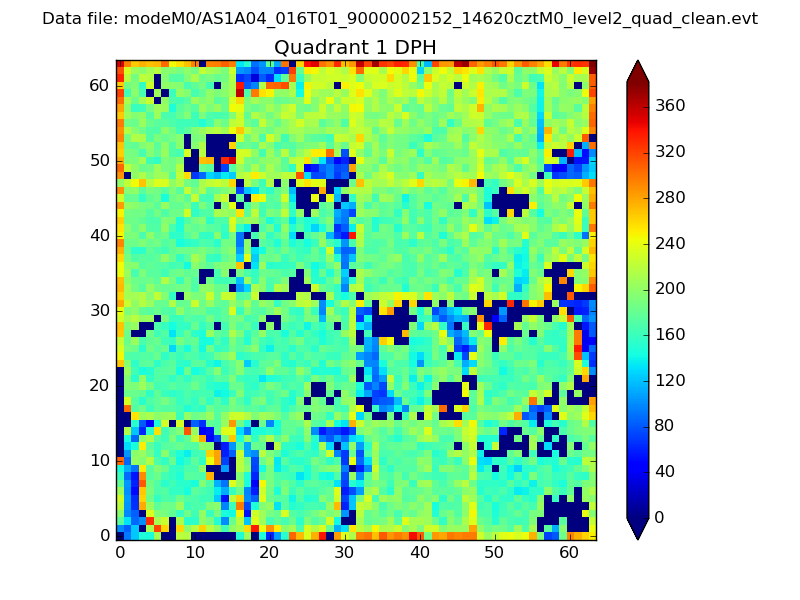 |
Quadrant B |
|---|---|---|---|
| Quadrant D |  |
 |
Quadrant C |
| Plot type | Count rate plots | Images |
|---|---|---|
| Comparison with Poisson distribution Blue bars denote a histogram of data divided into 1 sec bins. Red curve is a Poisson curve with rate = median count rate of data. |
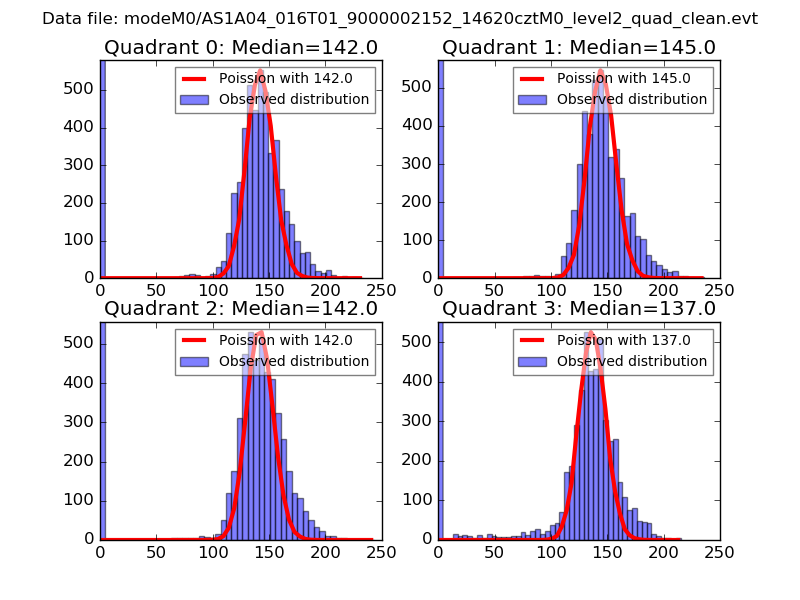 |
 |
| Quadrant-wise count rates Data is divided into 100 sec bins |
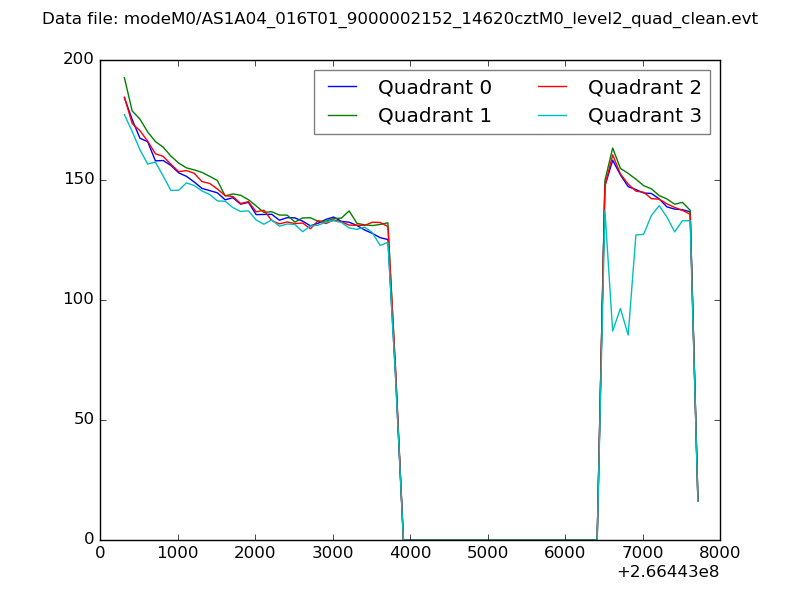 |
|
| Module-wise count rates for Quadrant A Data is divided into 100 sec bins |
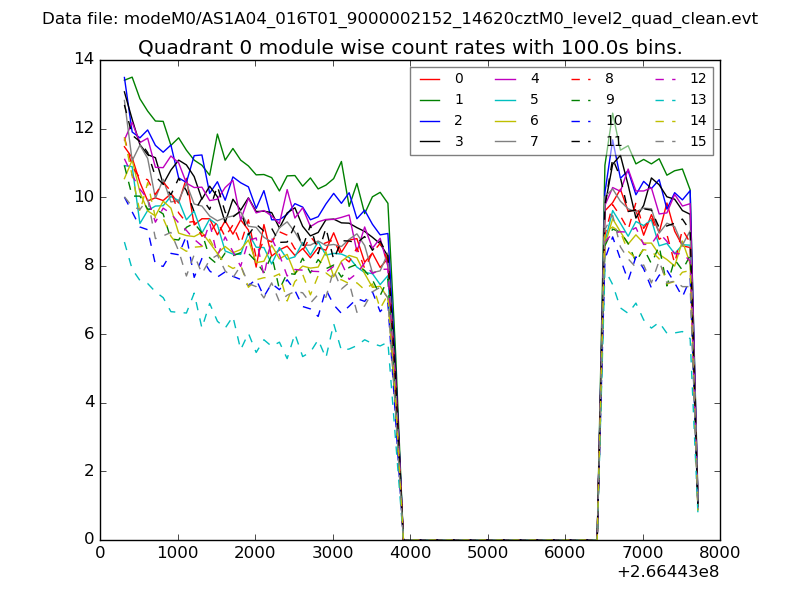 |
 |
| Module-wise count rates for Quadrant B Data is divided into 100 sec bins |
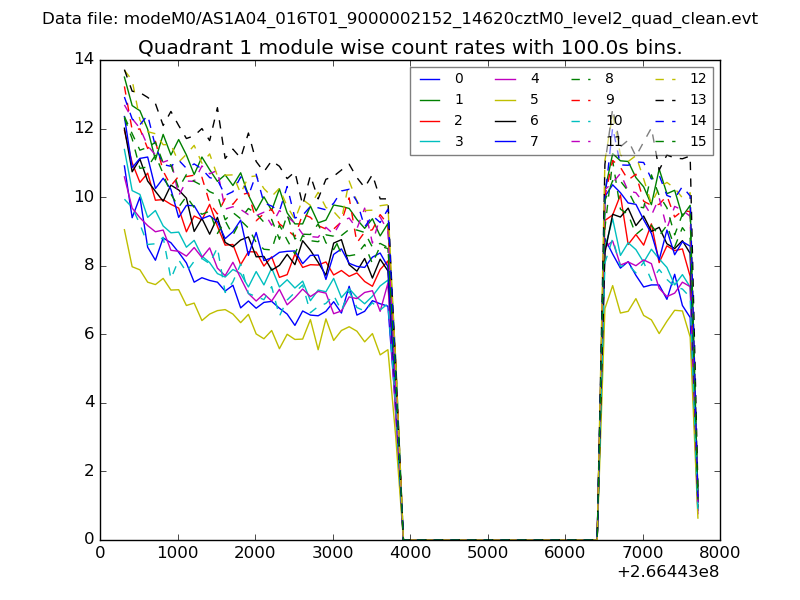 |
 |
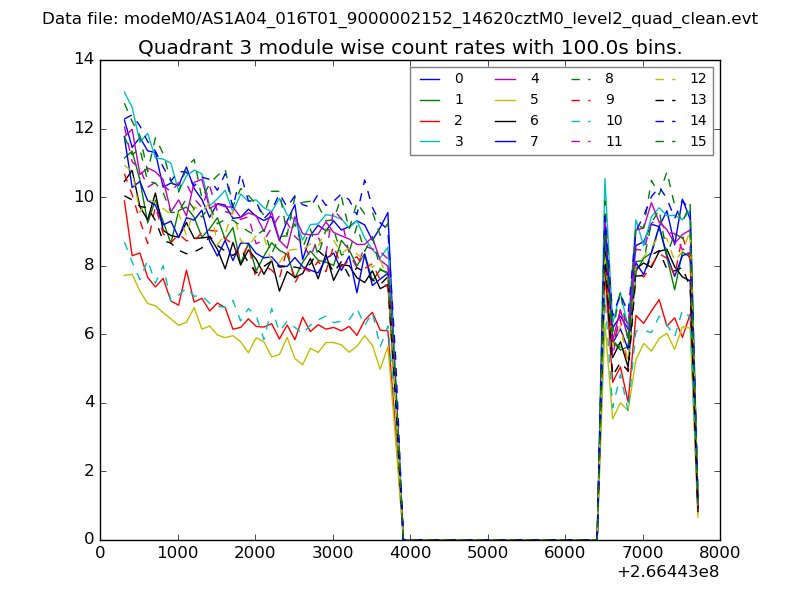
| Module-wise count rates for Quadrant C Data is divided into 100 sec bins |
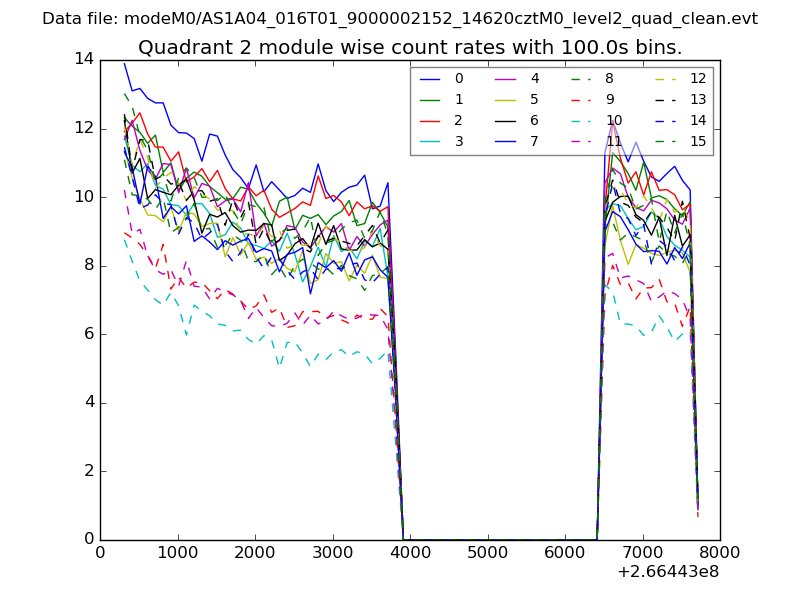 |
 |
| Module-wise count rates for Quadrant D Data is divided into 100 sec bins |
 |
 |
| Parameter | Plot |
|---|---|
| CZT HV Monitor | 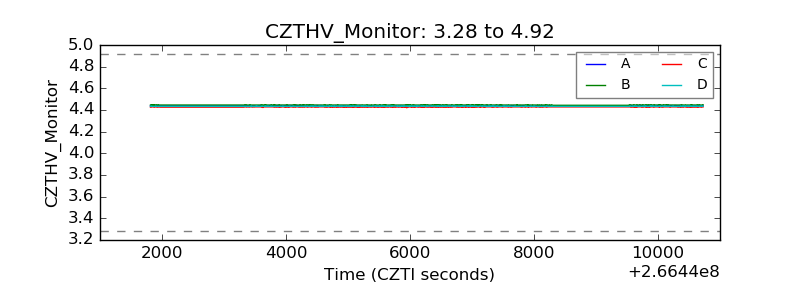 |
| D_VDD | 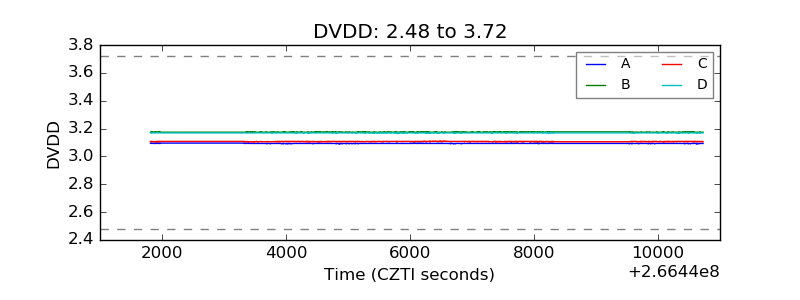 |
| Temperature 1 | 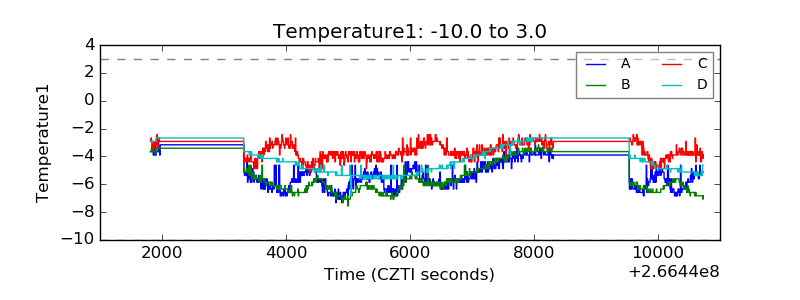 |
| Veto HV Monitor | 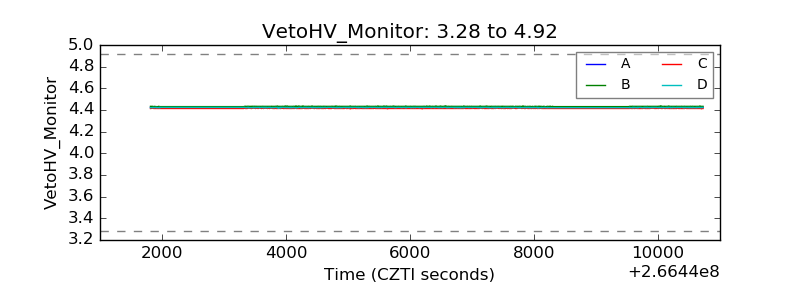 |
| Veto LLD | 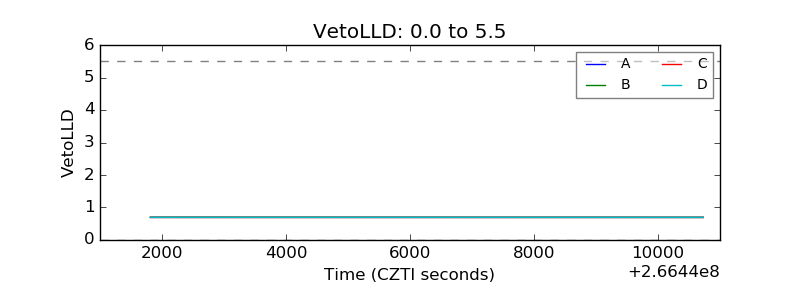 |
| Alpha Counter | 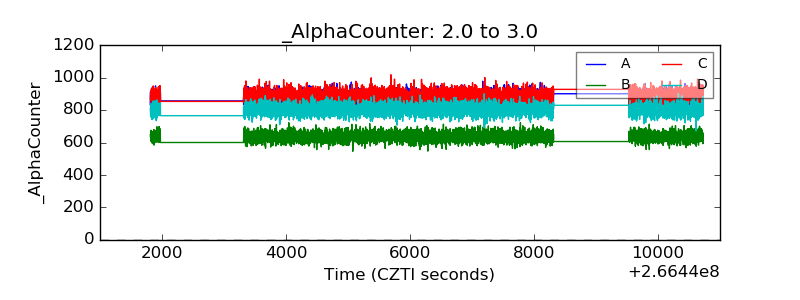 |
| _CPM_Rate | 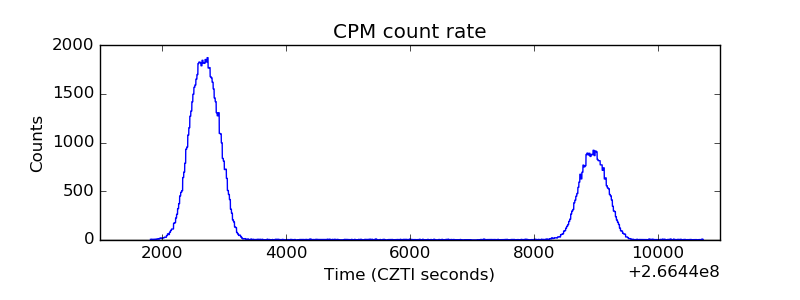 |
| CZT Counter |  |
| +2.5 Volts monitor |  |
| +5 Volts monitor |  |
| _ROLL_ROT | 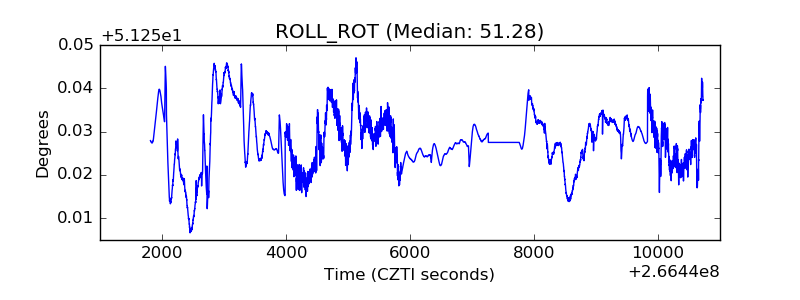 |
| _Roll_DEC | 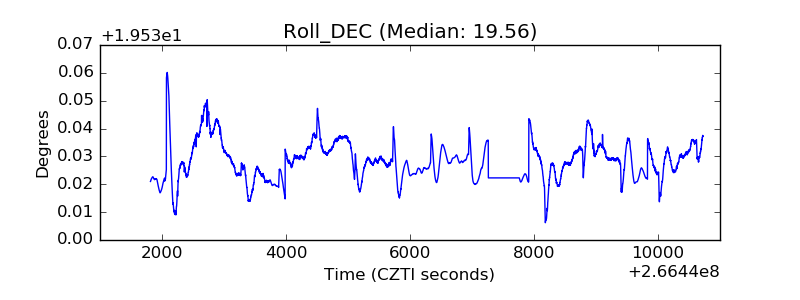 |
| _Roll_RA | 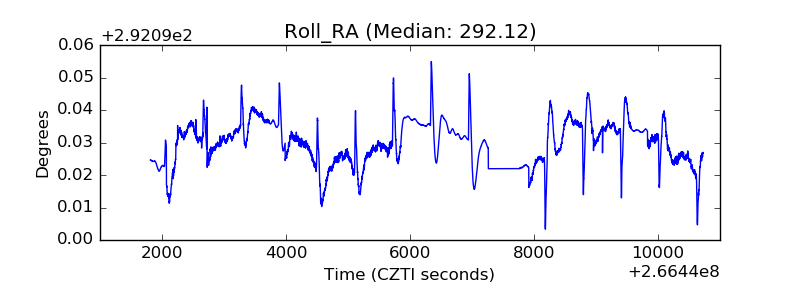 |
| Veto Counter | 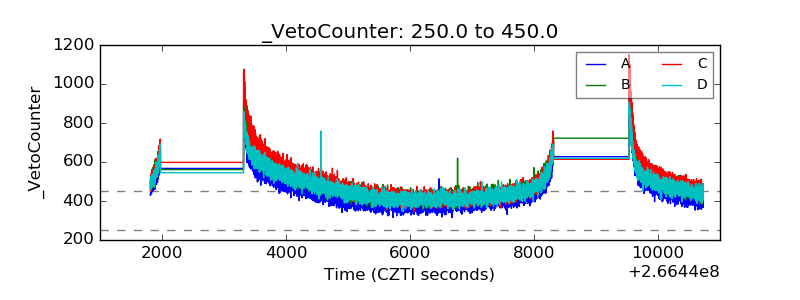 |