| Param | Original file | Final file |
|---|---|---|
| Filename | modeM0/AS1A04_016T01_9000002152_14621cztM0_level2.evt | modeM0/AS1A04_016T01_9000002152_14621cztM0_level2_quad_clean.evt |
| Size (bytes) | 541,670,400 | 90,875,520 |
| Size | 516.6 MB | 86.7 MB |
| Events in quadrant A | 3,592,478 | 574,125 |
| Events in quadrant B | 3,588,253 | 583,572 |
| Events in quadrant C | 4,412,538 | 572,787 |
| Events in quadrant D | 4,341,761 | 539,106 |
| Mode SS | |||
|---|---|---|---|
| Quadrant | BADHDUFLAG | Total packets | Discarded packets |
| A | 0 | 142 | 0 |
| B | 0 | 142 | 0 |
| C | 0 | 142 | 0 |
| D | 0 | 142 | 0 |
| Mode M0 | |||
|---|---|---|---|
| Quadrant | BADHDUFLAG | Total packets | Discarded packets |
| A | 0 | 15103 | 2 |
| B | 0 | 15118 | 2 |
| C | 0 | 17823 | 2 |
| D | 0 | 17776 | 2 |
| Mode M9 | |||
|---|---|---|---|
| Quadrant | BADHDUFLAG | Total packets | Discarded packets |
| A | 0 | 22 | 0 |
| B | 0 | 22 | 0 |
| C | 0 | 22 | 0 |
| D | 0 | 22 | 0 |
| Quadrant | Total seconds | Saturated seconds | Saturation percentage |
|---|---|---|---|
| A | 6925 | 94 | 1.357401% |
| B | 6925 | 182 | 2.628159% |
| C | 6925 | 110 | 1.588448% |
| D | 6925 | 382 | 5.516245% |
Noise dominated data is calculated using 1-second bins in cleaned event files. If a bin has >2000 counts, and if more than 50% of those come from <1% of pixels, then it is considered to be noise-dominated and hence unusable.
| Quadrant | # 1 sec bins | Bins with >0 counts | Bins with >2000 counts | High rate bins dominated by noise | Noise dominated (total time) | Noise dominated (detector-on time) | Marked lightcurve |
|---|---|---|---|---|---|---|---|
| A | 9126 | 6928 | 0 | 0 | 0.00% | 0.00% | 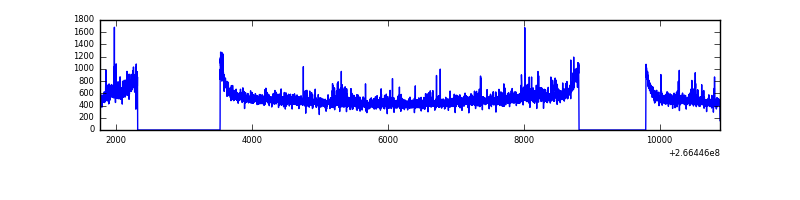 |
| B | 9126 | 6928 | 5 | 5 | 0.05% | 0.07% | 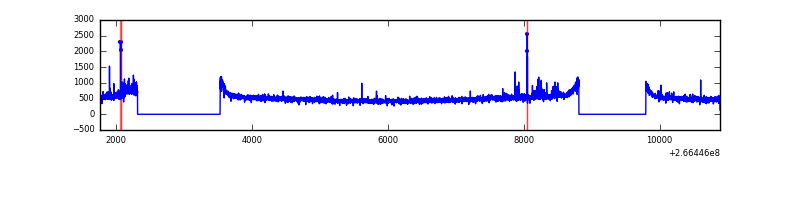 |
| C | 9126 | 6928 | 0 | 0 | 0.00% | 0.00% |  |
| D | 9126 | 6928 | 263 | 263 | 2.88% | 3.80% | 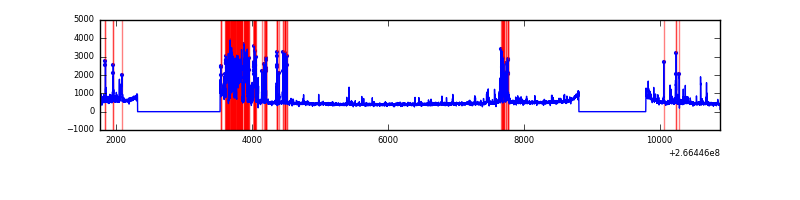 |
Top three noisy pixels from each quadrant. If the there are fewer than three noisy pixels in the level2.evt file, extra rows are filled as -1
| Pixel properties | Quadrant properties | ||||||
|---|---|---|---|---|---|---|---|
| Quadrant | DetID | PixID | Counts | Sigma | Mean | Median | Sigma |
| A | 1 | 162 | 92099 | 505.55 | 885 | 865 | 180.5 |
| A | 1 | 178 | 30394 | 163.63 | 885 | 865 | 180.5 |
| A | 1 | 161 | 27971 | 150.2 | 885 | 865 | 180.5 |
| B | 0 | 189 | 61194 | 355.32 | 886 | 863 | 169.8 |
| B | 0 | 229 | 41480 | 239.21 | 886 | 863 | 169.8 |
| B | 12 | 111 | 20888 | 117.94 | 886 | 863 | 169.8 |
| C | 3 | 233 | 1026794 | 5079.16 | 868 | 873 | 202.0 |
| C | 13 | 61 | 6292 | 26.83 | 868 | 873 | 202.0 |
| C | 14 | 234 | 2400 | 7.56 | 868 | 873 | 202.0 |
| D | 10 | 199 | 1057430 | 5253.8 | 845 | 826 | 201.1 |
| D | 2 | 234 | 21902 | 104.8 | 845 | 826 | 201.1 |
| D | 14 | 35 | 17913 | 84.96 | 845 | 826 | 201.1 |
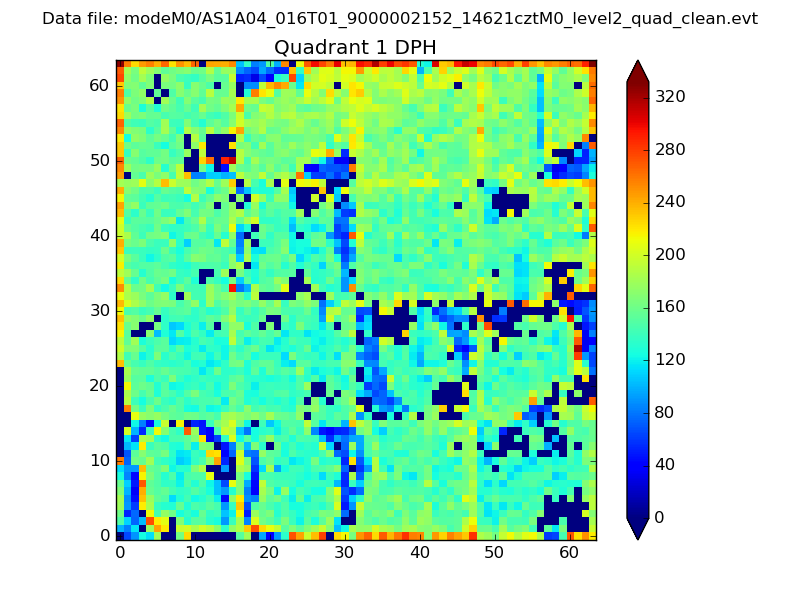
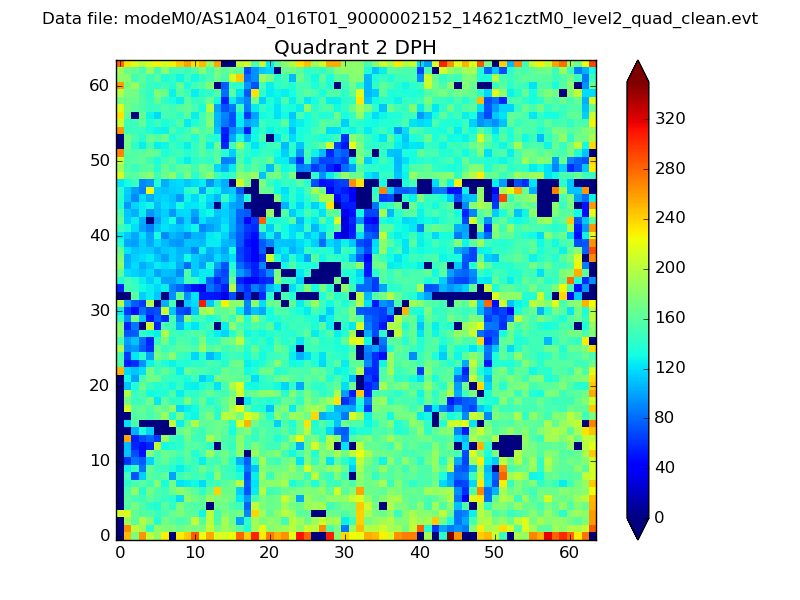
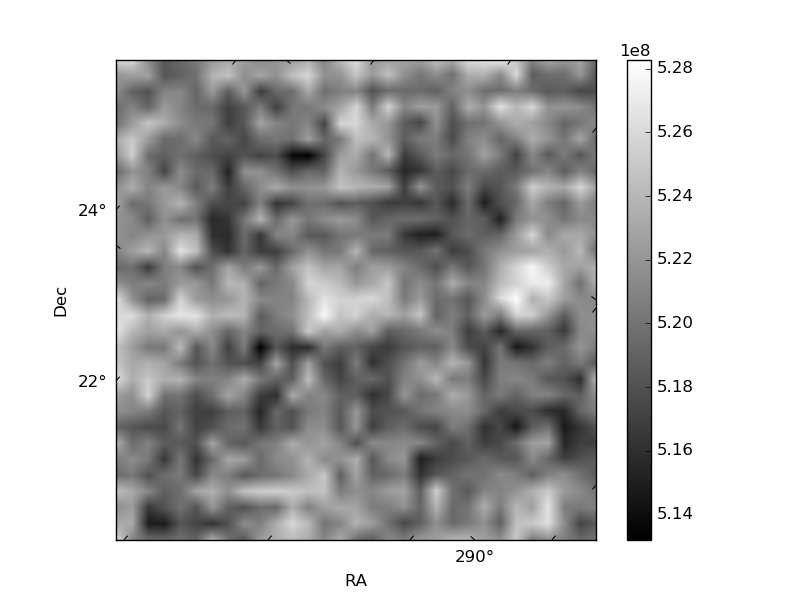
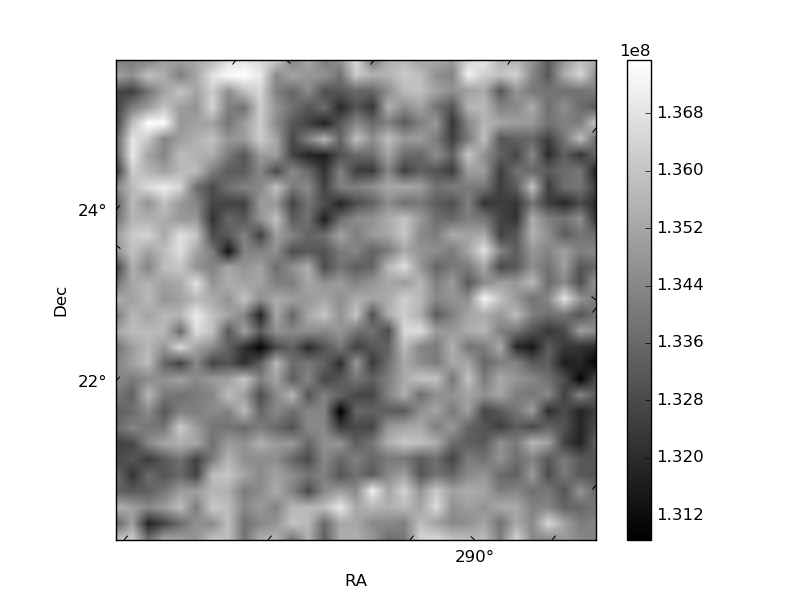
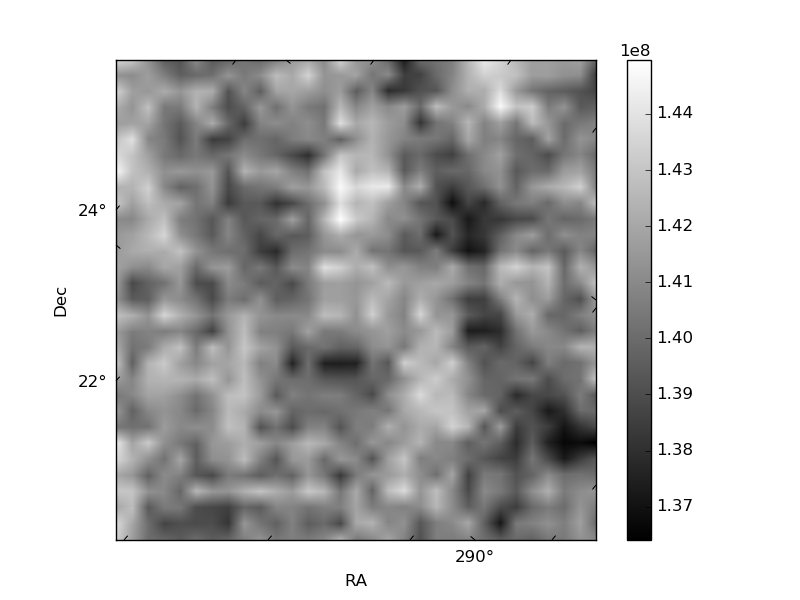
Histogram calculated using DETX and DETY for each event in the final _common_clean file
| Quadrant A | 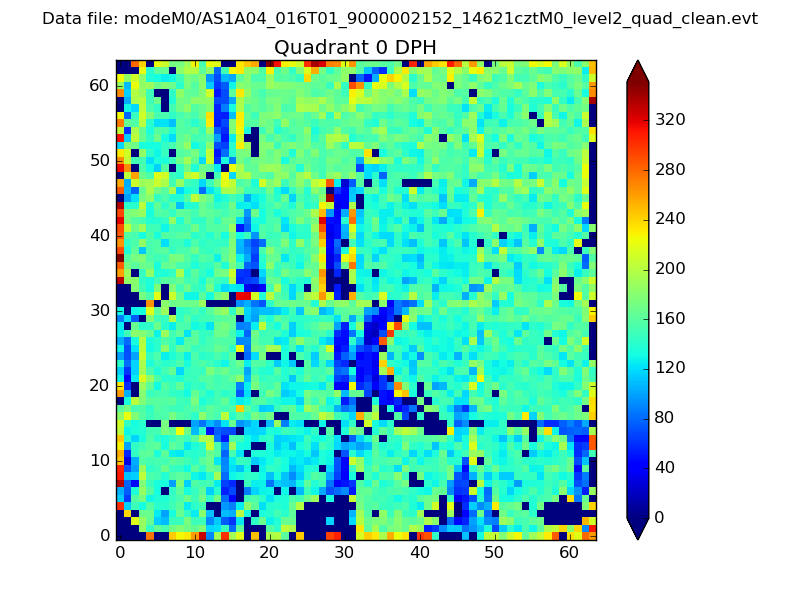 |
 |
Quadrant B |
|---|---|---|---|
| Quadrant D | 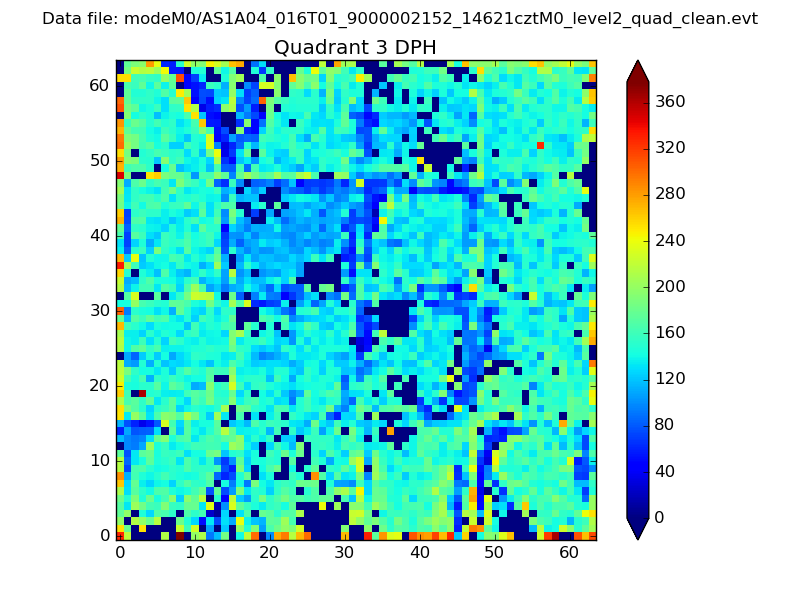 |
 |
Quadrant C |
| Plot type | Count rate plots | Images |
|---|---|---|
| Comparison with Poisson distribution Blue bars denote a histogram of data divided into 1 sec bins. Red curve is a Poisson curve with rate = median count rate of data. |
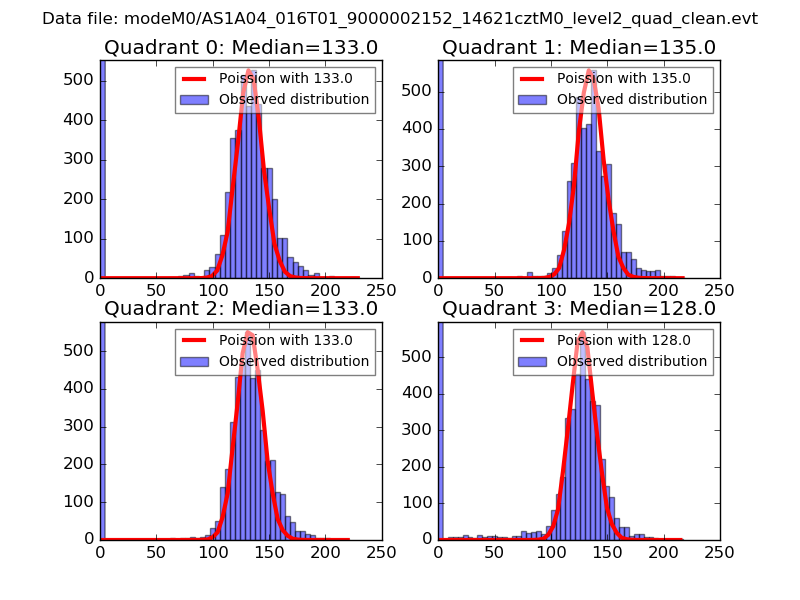 |
 |
| Quadrant-wise count rates Data is divided into 100 sec bins |
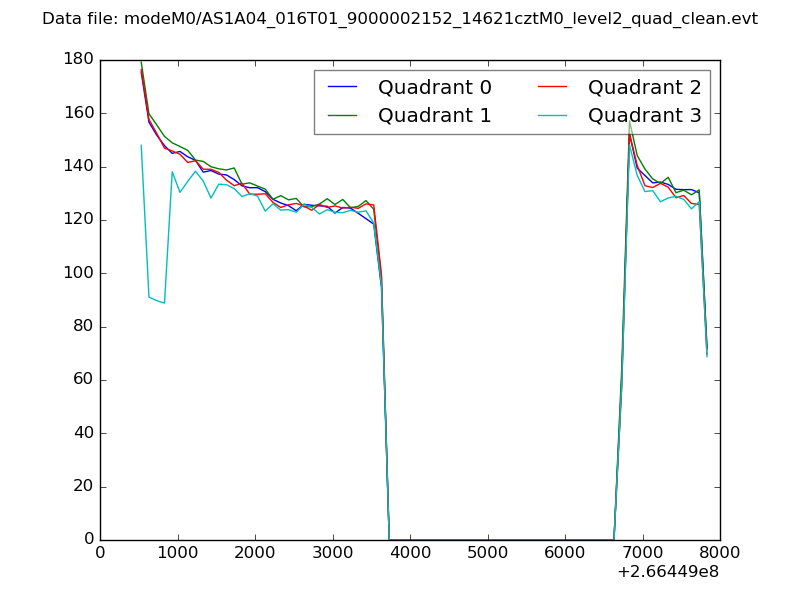 |
|
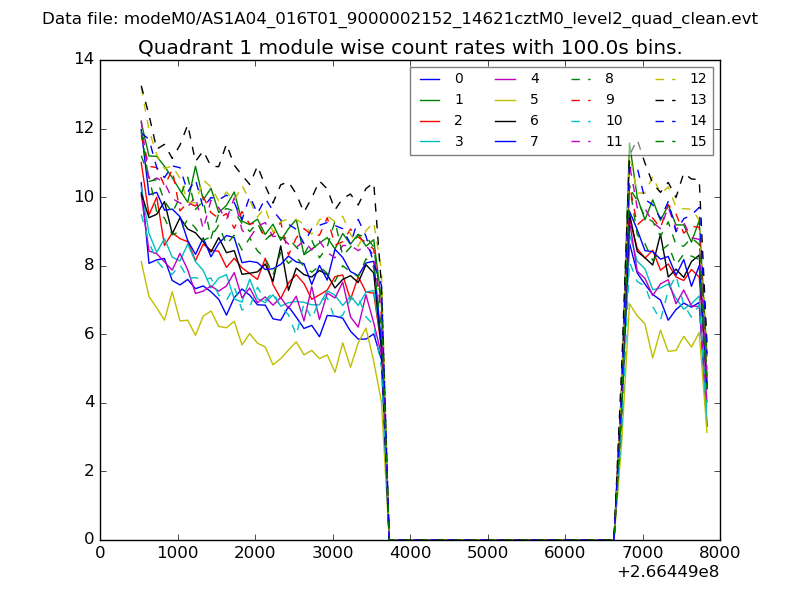
| Module-wise count rates for Quadrant A Data is divided into 100 sec bins |
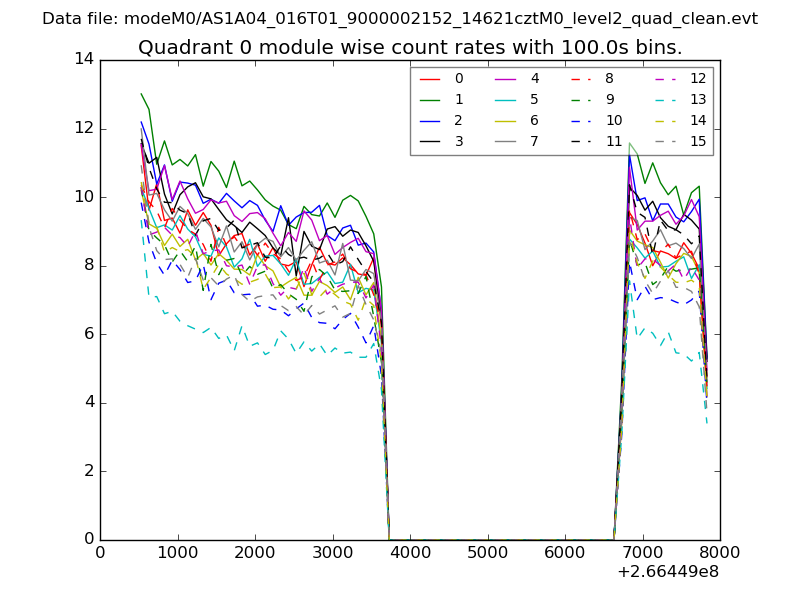 |
 |
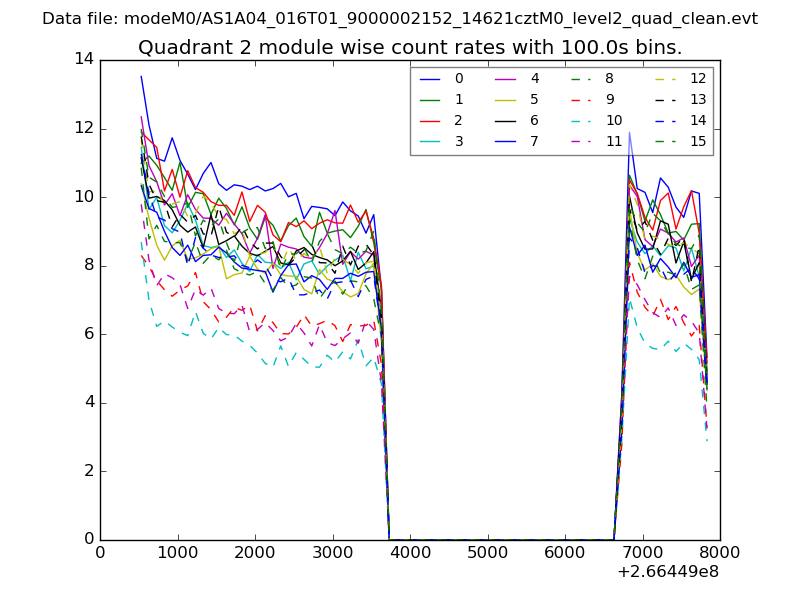
| Module-wise count rates for Quadrant B Data is divided into 100 sec bins |
 |
 |
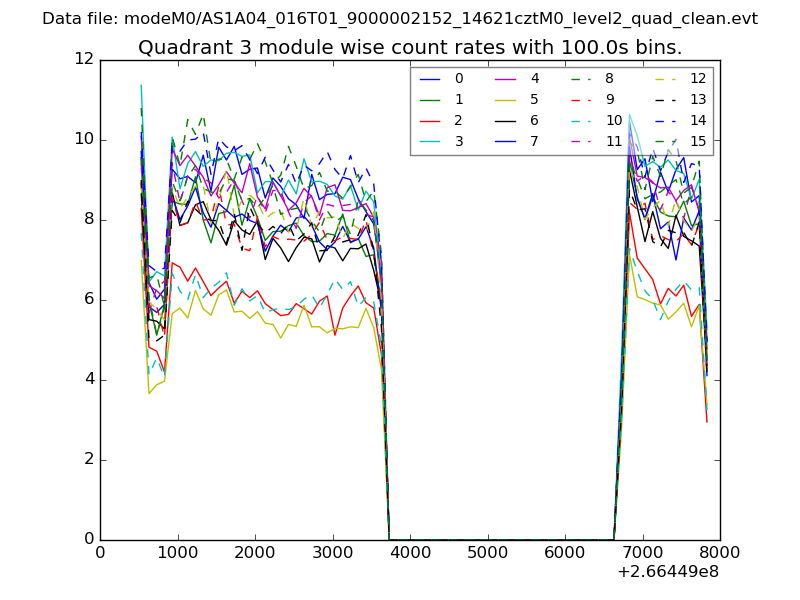
| Module-wise count rates for Quadrant C Data is divided into 100 sec bins |
 |
 |
| Module-wise count rates for Quadrant D Data is divided into 100 sec bins |
 |
 |
| Parameter | Plot |
|---|---|
| CZT HV Monitor | 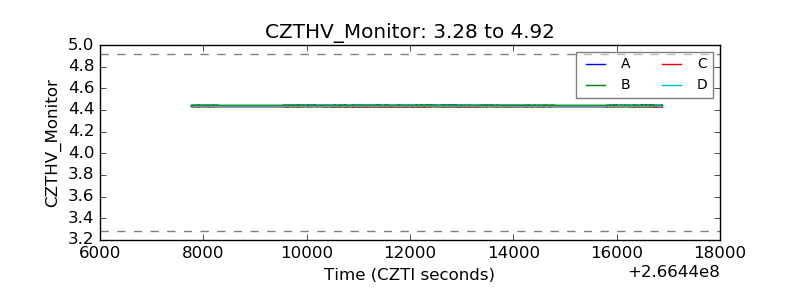 |
| D_VDD | 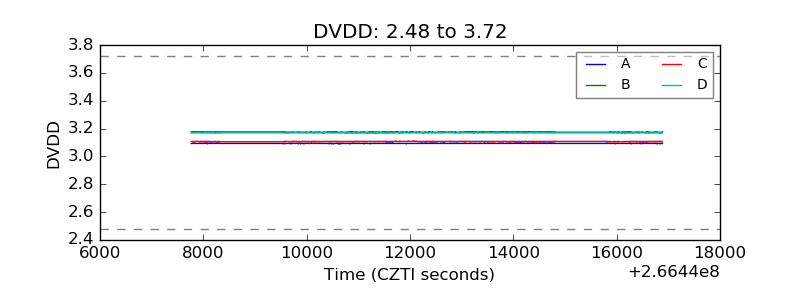 |
| Temperature 1 | 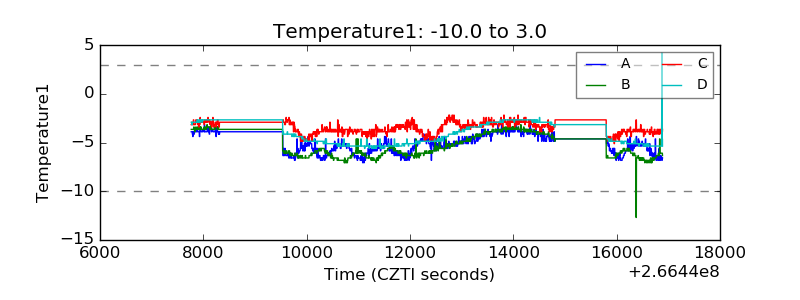 |
| Veto HV Monitor | 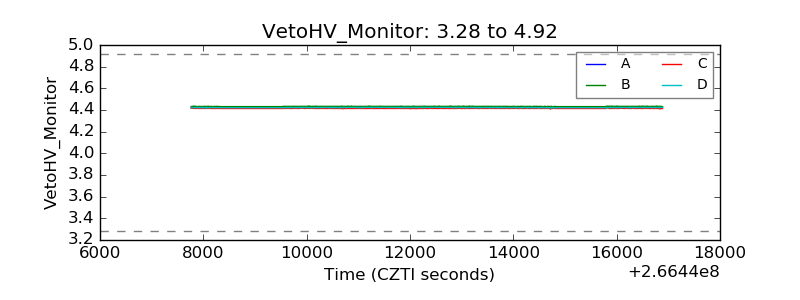 |
| Veto LLD | 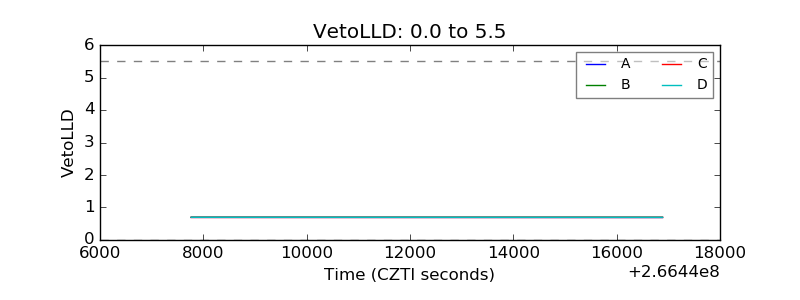 |
| Alpha Counter | 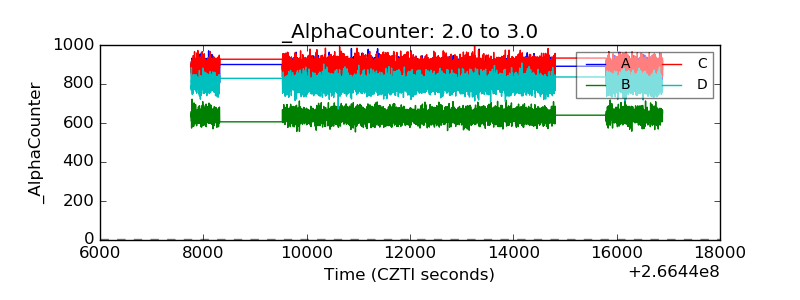 |
| _CPM_Rate | 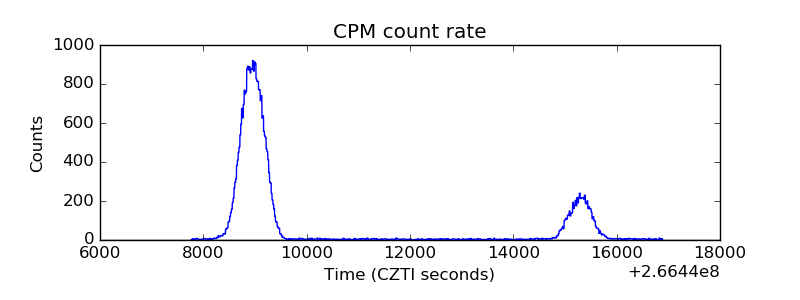 |
| CZT Counter | 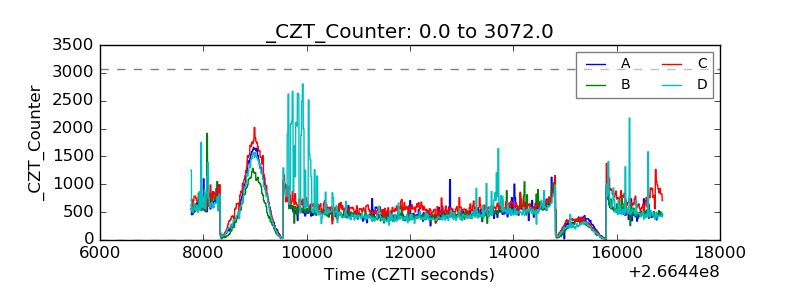 |
| +2.5 Volts monitor |  |
| +5 Volts monitor | 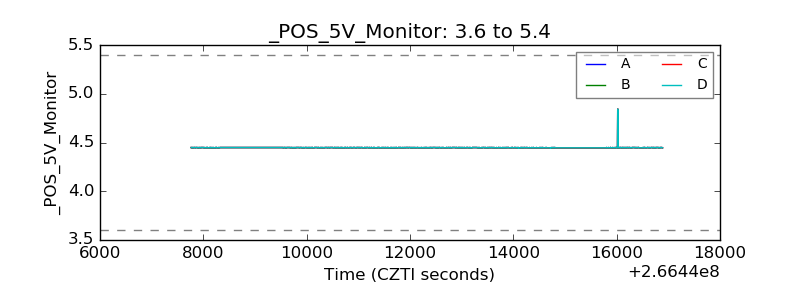 |
| _ROLL_ROT | 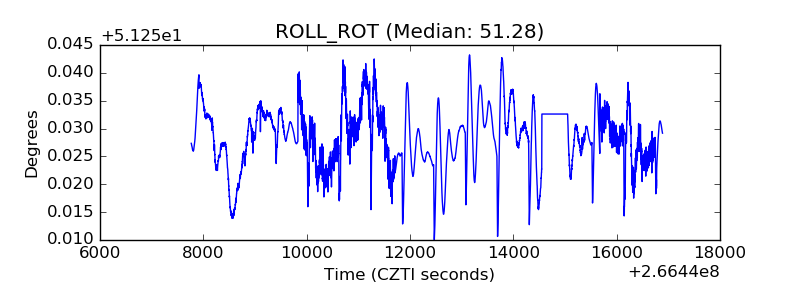 |
| _Roll_DEC | 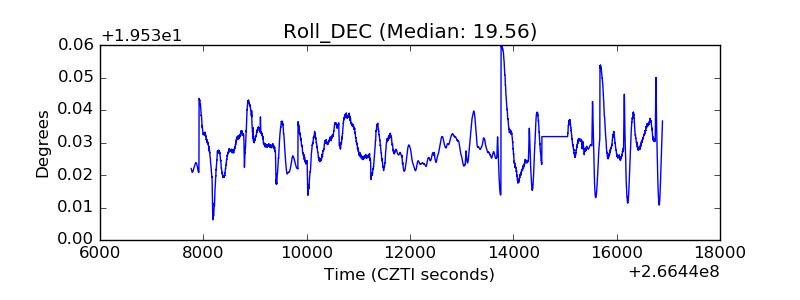 |
| _Roll_RA | 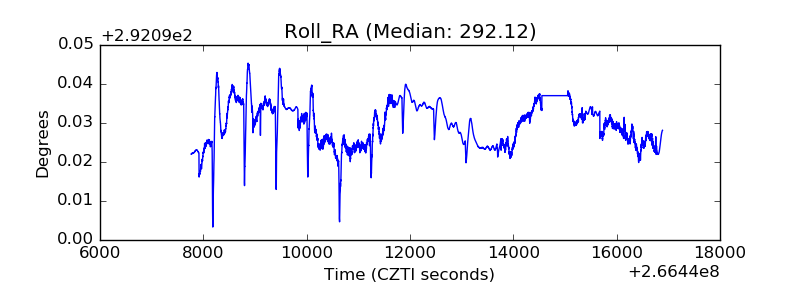 |
| Veto Counter | 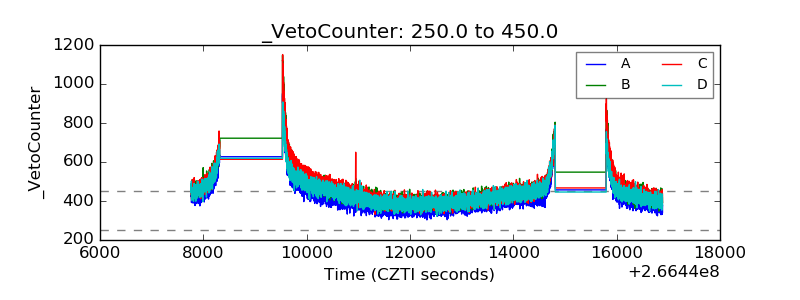 |