| Param | Original file | Final file |
|---|---|---|
| Filename | modeM0/AS1A04_016T01_9000002152_14622cztM0_level2.evt | modeM0/AS1A04_016T01_9000002152_14622cztM0_level2_quad_clean.evt |
| Size (bytes) | 88,283,520 | 22,181,760 |
| Size | 84.2 MB | 21.2 MB |
| Events in quadrant A | 565,055 | 148,598 |
| Events in quadrant B | 568,958 | 150,475 |
| Events in quadrant C | 842,090 | 145,941 |
| Events in quadrant D | 620,758 | 143,301 |
| Mode SS | |||
|---|---|---|---|
| Quadrant | BADHDUFLAG | Total packets | Discarded packets |
| A | 0 | 20 | 0 |
| B | 0 | 20 | 0 |
| C | 0 | 20 | 0 |
| D | 0 | 20 | 0 |
| Mode M0 | |||
|---|---|---|---|
| Quadrant | BADHDUFLAG | Total packets | Discarded packets |
| A | 0 | 2354 | 1 |
| B | 0 | 2352 | 1 |
| C | 0 | 3323 | 1 |
| D | 0 | 2572 | 1 |
| Mode M9 | |||
|---|---|---|---|
| Quadrant | BADHDUFLAG | Total packets | Discarded packets |
| A | 0 | 7 | 0 |
| B | 0 | 7 | 0 |
| C | 0 | 7 | 0 |
| D | 0 | 8 | 0 |
| Quadrant | Total seconds | Saturated seconds | Saturation percentage |
|---|---|---|---|
| A | 1092 | 5 | 0.457875% |
| B | 1092 | 12 | 1.098901% |
| C | 1092 | 13 | 1.190476% |
| D | 1092 | 13 | 1.190476% |
Noise dominated data is calculated using 1-second bins in cleaned event files. If a bin has >2000 counts, and if more than 50% of those come from <1% of pixels, then it is considered to be noise-dominated and hence unusable.
| Quadrant | # 1 sec bins | Bins with >0 counts | Bins with >2000 counts | High rate bins dominated by noise | Noise dominated (total time) | Noise dominated (detector-on time) | Marked lightcurve |
|---|---|---|---|---|---|---|---|
| A | 1093 | 1093 | 0 | 0 | 0.00% | 0.00% | 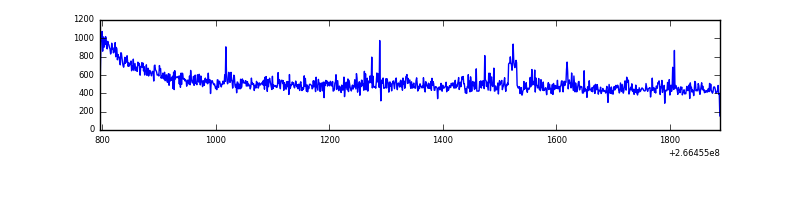 |
| B | 1093 | 1093 | 0 | 0 | 0.00% | 0.00% | 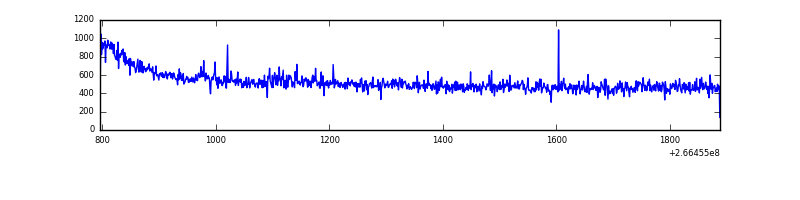 |
| C | 1093 | 1093 | 0 | 0 | 0.00% | 0.00% | 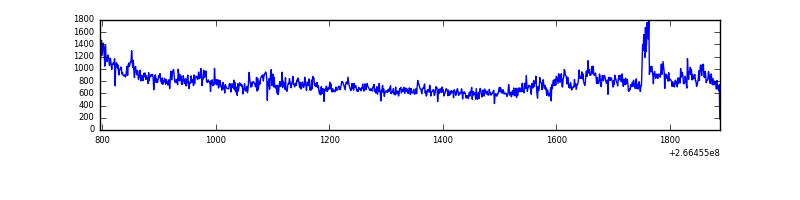 |
| D | 1093 | 1093 | 4 | 4 | 0.37% | 0.37% | 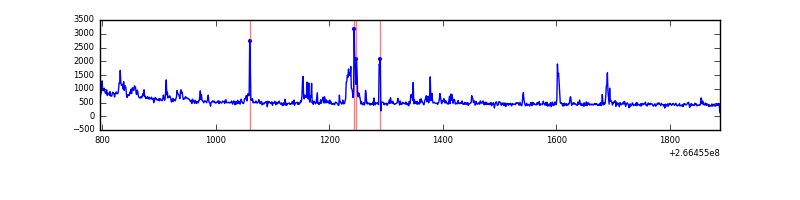 |
Top three noisy pixels from each quadrant. If the there are fewer than three noisy pixels in the level2.evt file, extra rows are filled as -1
| Pixel properties | Quadrant properties | ||||||
|---|---|---|---|---|---|---|---|
| Quadrant | DetID | PixID | Counts | Sigma | Mean | Median | Sigma |
| A | 1 | 162 | 13134 | 424.61 | 140 | 137 | 30.6 |
| A | 1 | 178 | 4084 | 128.95 | 140 | 137 | 30.6 |
| A | 1 | 161 | 3680 | 115.75 | 140 | 137 | 30.6 |
| B | 0 | 214 | 9217 | 300.55 | 142 | 138 | 30.2 |
| B | 12 | 111 | 3340 | 106.0 | 142 | 138 | 30.2 |
| B | 11 | 111 | 2869 | 90.41 | 142 | 138 | 30.2 |
| C | 3 | 233 | 291530 | 8424.49 | 141 | 141 | 34.6 |
| C | 13 | 61 | 970 | 23.97 | 141 | 141 | 34.6 |
| C | 3 | 234 | 766 | 18.07 | 141 | 141 | 34.6 |
| D | 10 | 199 | 94913 | 2720.76 | 138 | 135 | 34.8 |
| D | 2 | 234 | 2875 | 78.66 | 138 | 135 | 34.8 |
| D | 3 | 238 | 2165 | 58.27 | 138 | 135 | 34.8 |
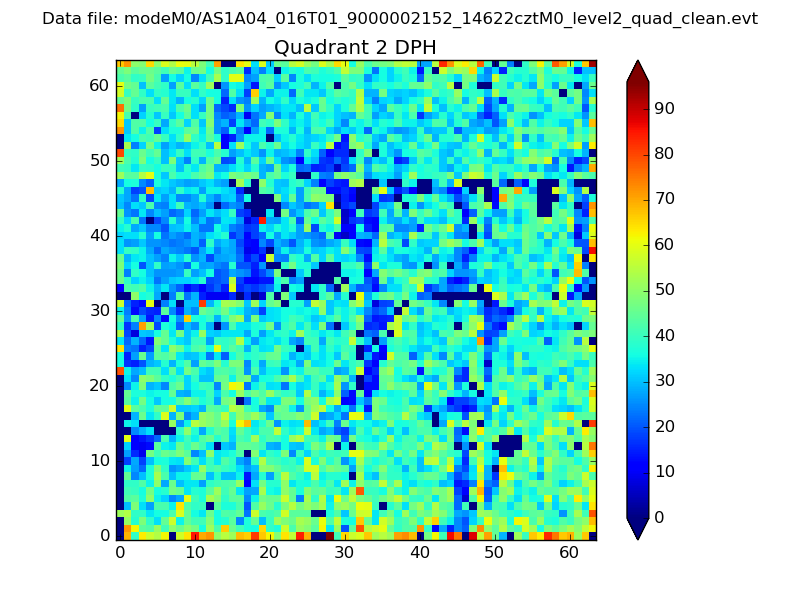
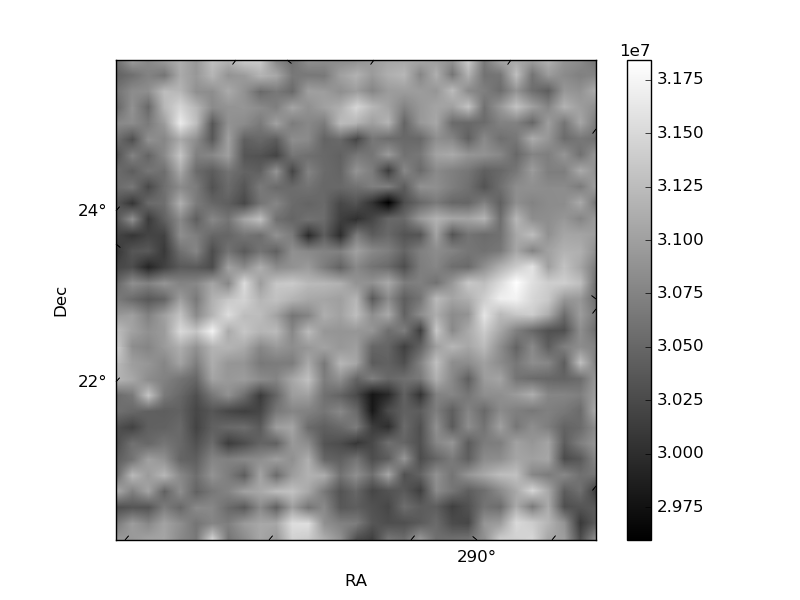
Histogram calculated using DETX and DETY for each event in the final _common_clean file
| Quadrant A | 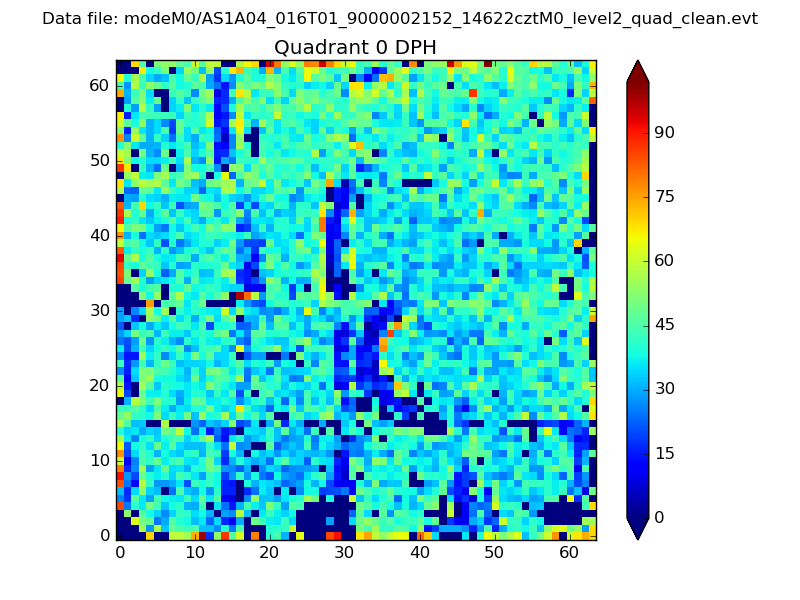 |
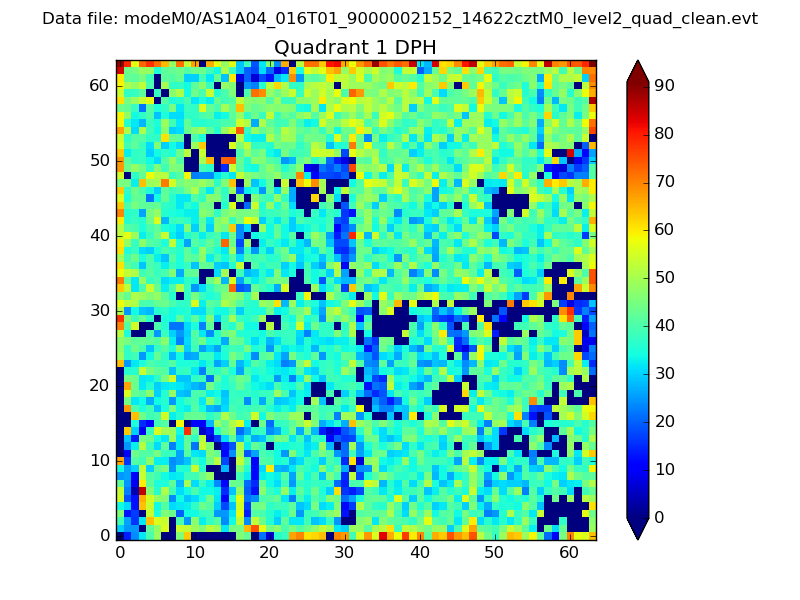 |
Quadrant B |
|---|---|---|---|
| Quadrant D | 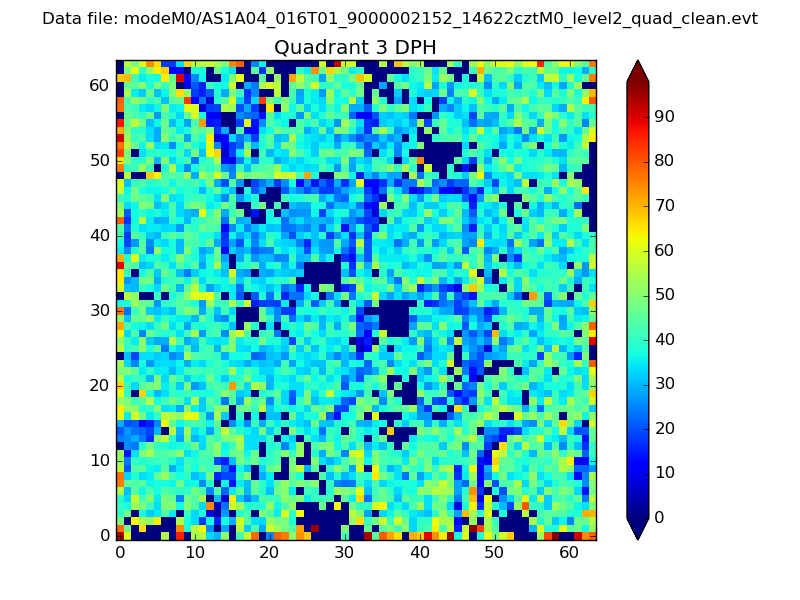 |
 |
Quadrant C |
| Plot type | Count rate plots | Images |
|---|---|---|
| Comparison with Poisson distribution Blue bars denote a histogram of data divided into 1 sec bins. Red curve is a Poisson curve with rate = median count rate of data. |
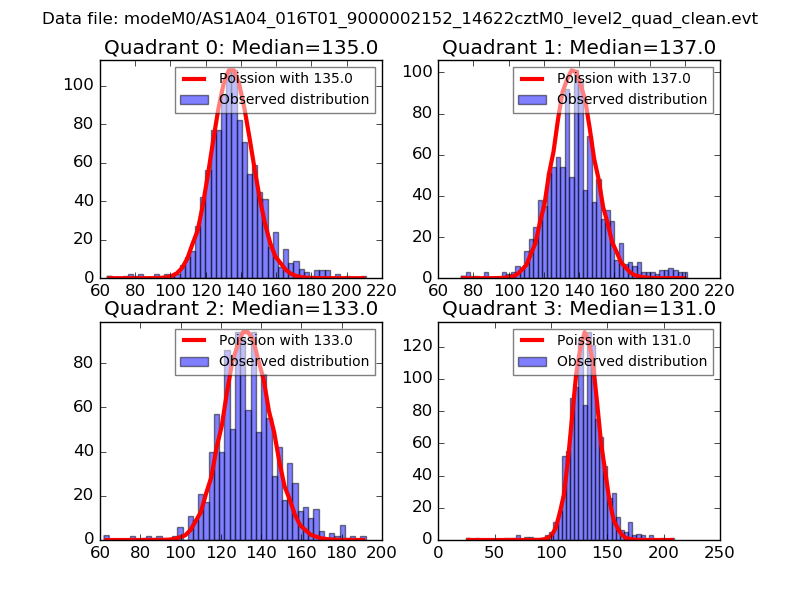 |
 |
| Quadrant-wise count rates Data is divided into 100 sec bins |
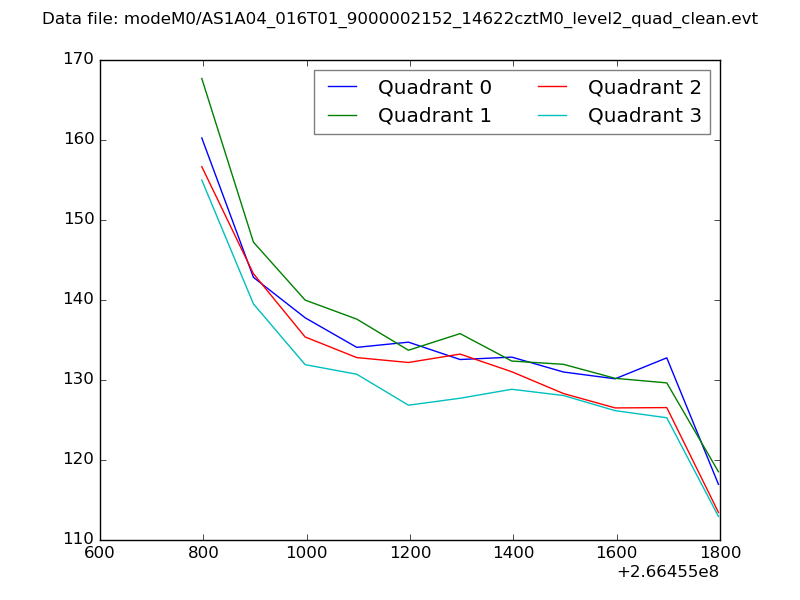 |
|
| Module-wise count rates for Quadrant A Data is divided into 100 sec bins |
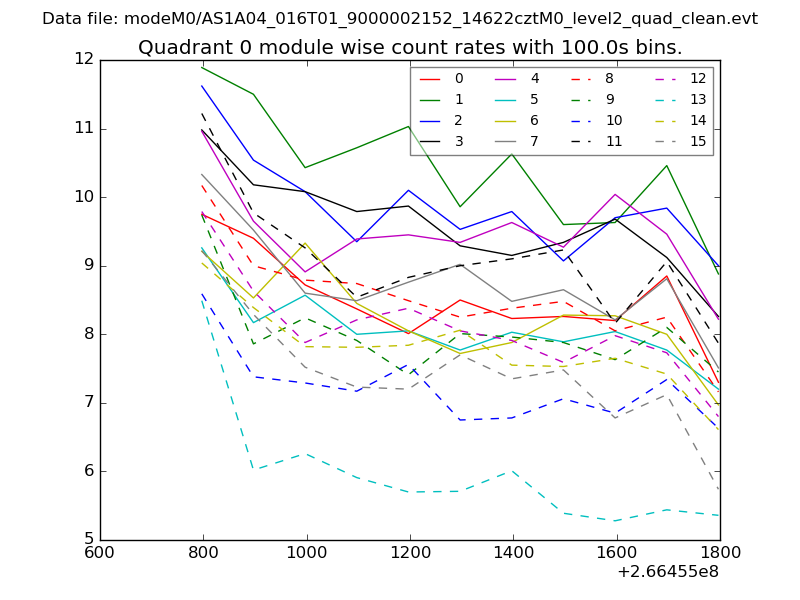 |
 |
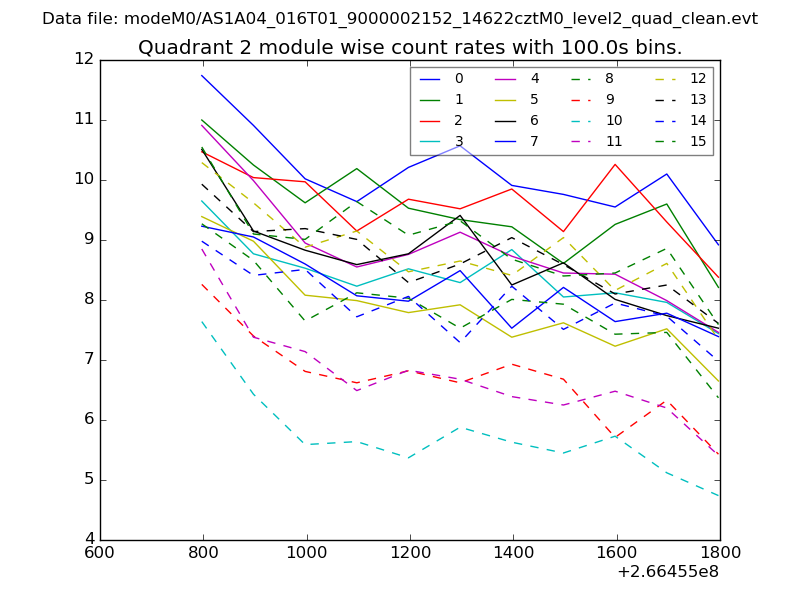
| Module-wise count rates for Quadrant B Data is divided into 100 sec bins |
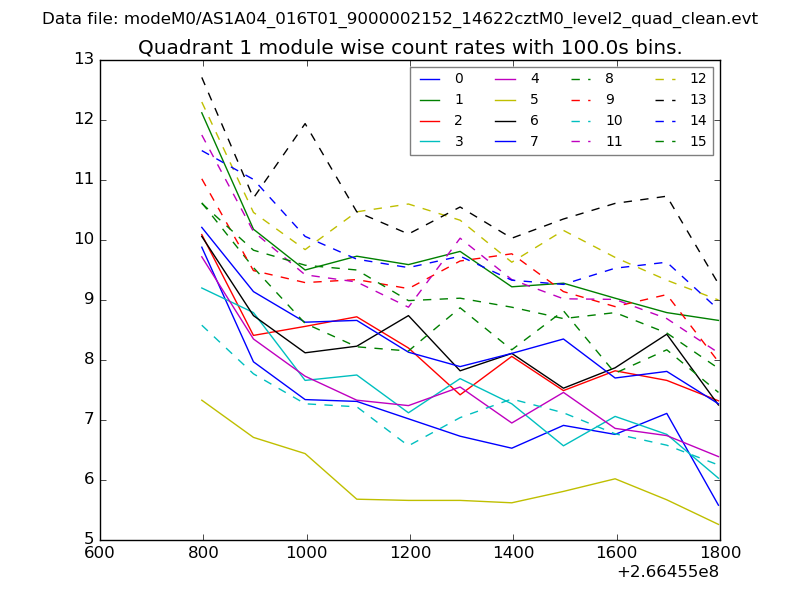 |
 |
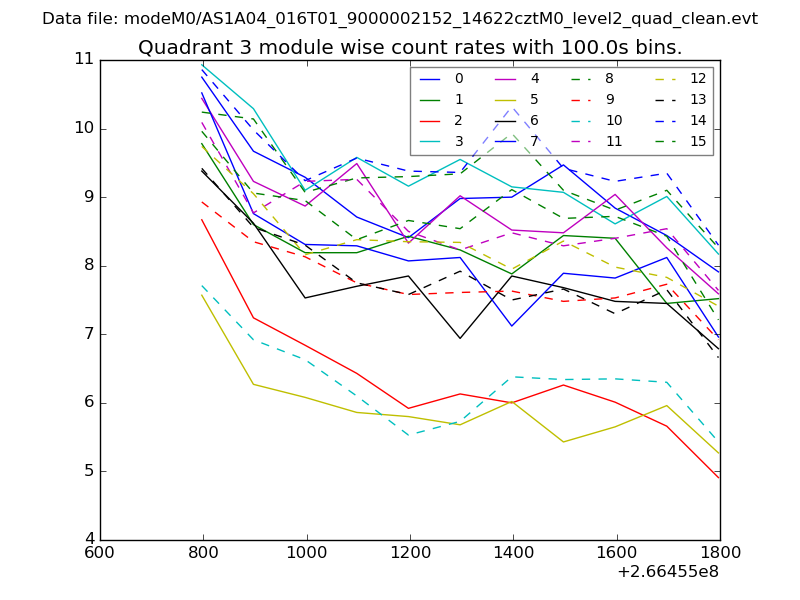
| Module-wise count rates for Quadrant C Data is divided into 100 sec bins |
 |
 |
| Module-wise count rates for Quadrant D Data is divided into 100 sec bins |
 |
 |
| Parameter | Plot |
|---|---|
| CZT HV Monitor | 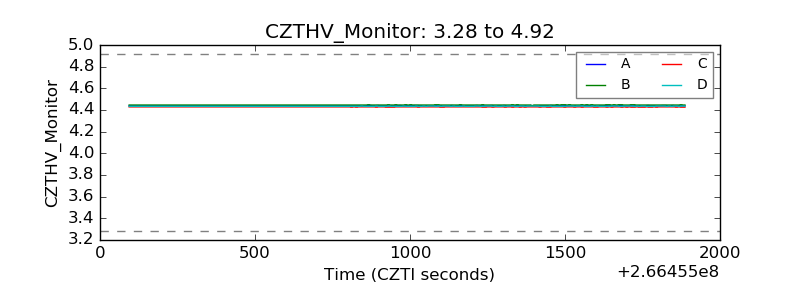 |
| D_VDD | 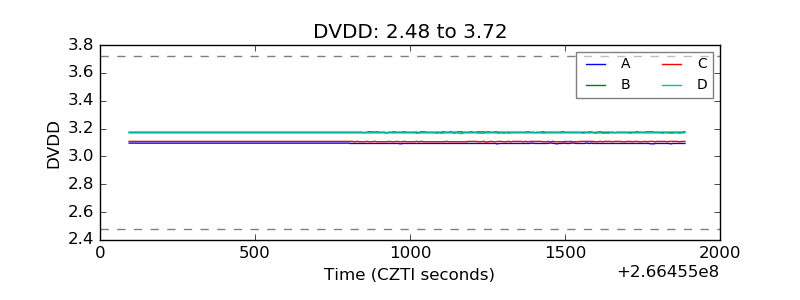 |
| Temperature 1 | 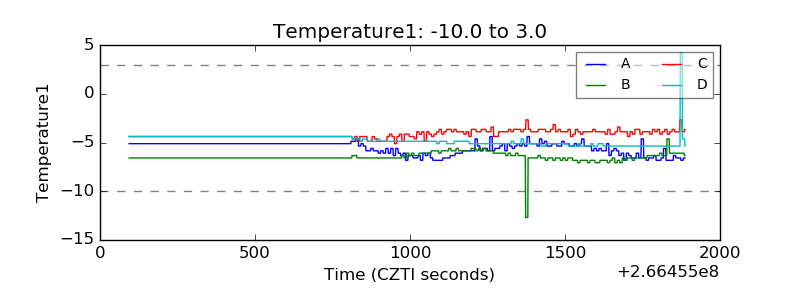 |
| Veto HV Monitor | 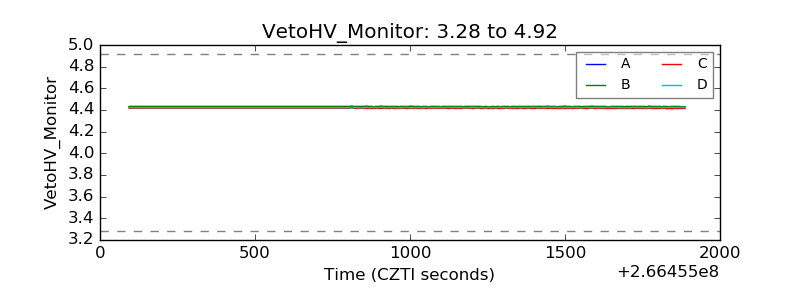 |
| Veto LLD | 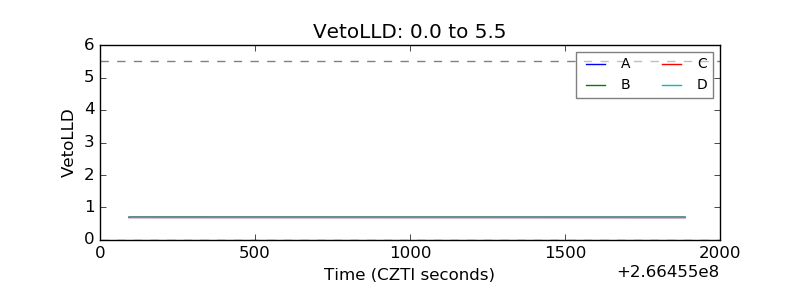 |
| Alpha Counter | 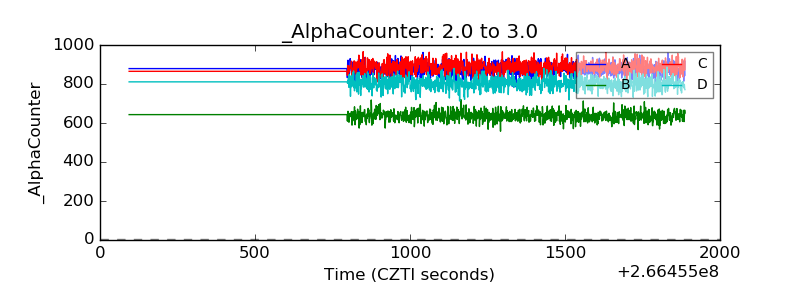 |
| _CPM_Rate | 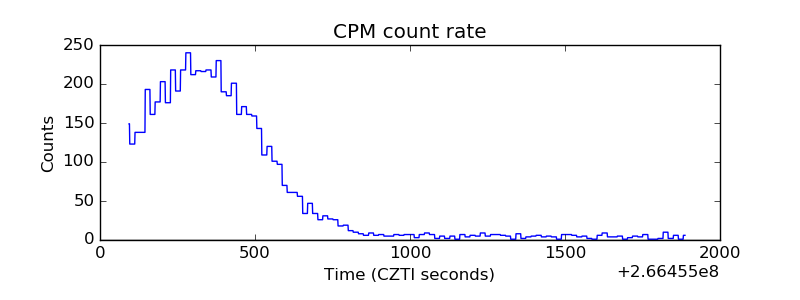 |
| CZT Counter | 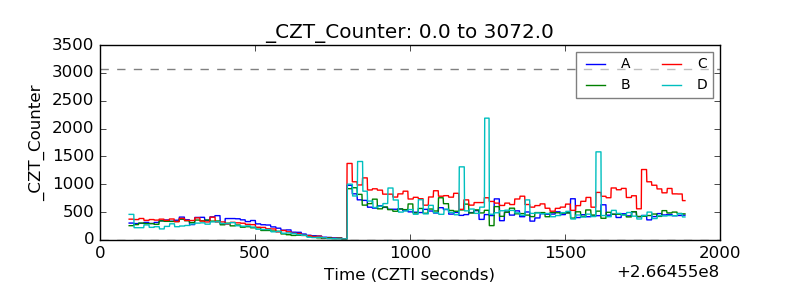 |
| +2.5 Volts monitor | 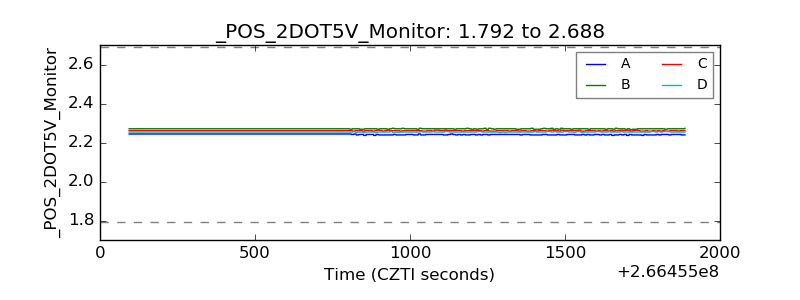 |
| +5 Volts monitor |  |
| _ROLL_ROT | 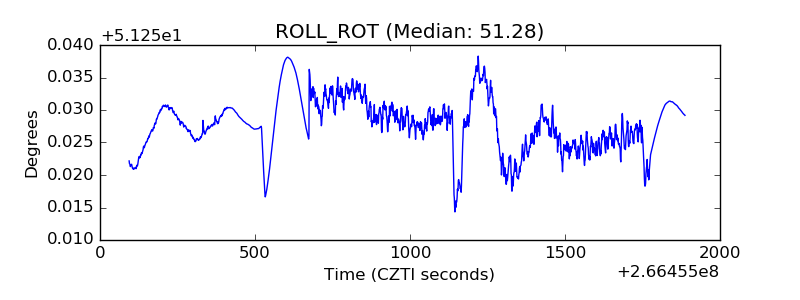 |
| _Roll_DEC | 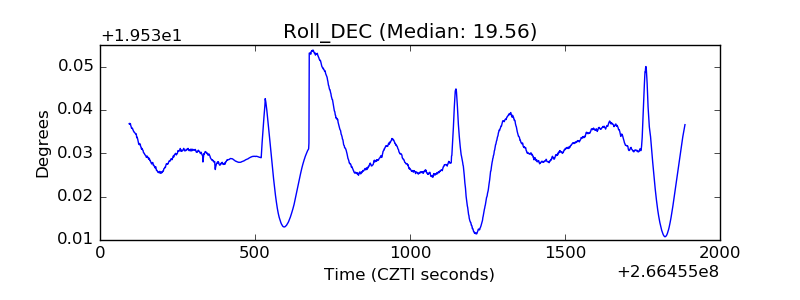 |
| _Roll_RA | 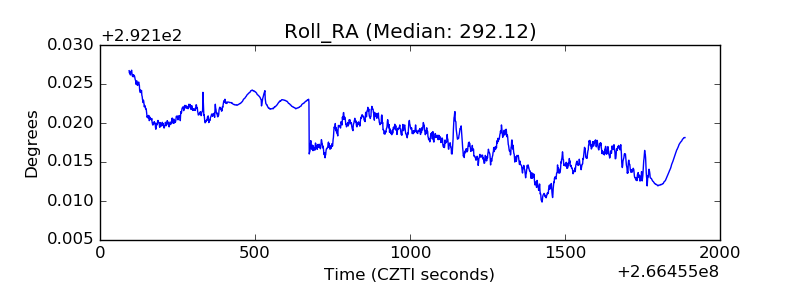 |
| Veto Counter | 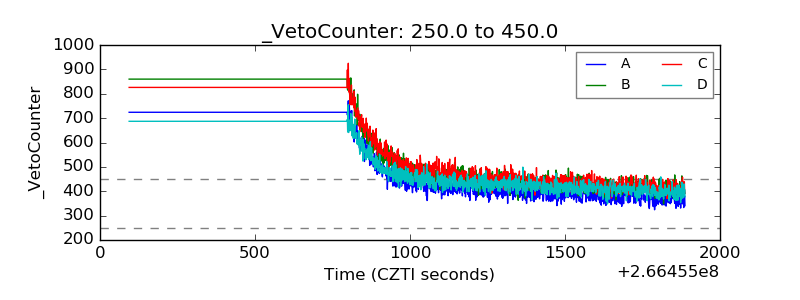 |