| Param | Original file | Final file |
|---|---|---|
| Filename | modeM0/AS1G08_026T01_9000002154cztM0_level2.fits | modeM0/AS1G08_026T01_9000002154cztM0_level2_quad_clean.evt |
| Size (bytes) | 489,453,120 | 460,909,440 |
| Size | 466.8 MB | 439.6 MB |
| Events in quadrant A | 2,977,698 | 2,777,484 |
| Events in quadrant B | 2,867,152 | 2,715,014 |
| Events in quadrant C | 2,892,958 | 2,533,728 |
| Events in quadrant D | 2,556,066 | 2,403,537 |
| Mode SS | |||
|---|---|---|---|
| Quadrant | BADHDUFLAG | Total packets | Discarded packets |
| A | 0 | 1046 | 0 |
| B | 0 | 1046 | 0 |
| C | 0 | 1046 | 0 |
| D | 0 | 1046 | 0 |
| Mode M0 | |||
|---|---|---|---|
| Quadrant | BADHDUFLAG | Total packets | Discarded packets |
| A | 0 | 112717 | 0 |
| B | 0 | 112281 | 0 |
| C | 0 | 161025 | 0 |
| D | 0 | 121572 | 0 |
| Mode M9 | |||
|---|---|---|---|
| Quadrant | BADHDUFLAG | Total packets | Discarded packets |
| A | 0 | 62 | 0 |
| B | 0 | 62 | 0 |
| C | 0 | 62 | 0 |
| D | 0 | 62 | 0 |
| Quadrant | Total seconds | Saturated seconds | Saturation percentage |
|---|---|---|---|
| A | 51427 | 630 | 1.225037% |
| B | 51427 | 892 | 1.734497% |
| C | 51427 | 757 | 1.471989% |
| D | 51427 | 1811 | 3.521496% |
Noise dominated data is calculated using 1-second bins in cleaned event files. If a bin has >2000 counts, and if more than 50% of those come from <1% of pixels, then it is considered to be noise-dominated and hence unusable.
| Quadrant | # 1 sec bins | Bins with >0 counts | Bins with >2000 counts | High rate bins dominated by noise | Noise dominated (total time) | Noise dominated (detector-on time) | Marked lightcurve |
|---|---|---|---|---|---|---|---|
| A | 57612 | 51421 | 0 | 0 | 0.00% | 0.00% |  |
| B | 57612 | 51419 | 0 | 0 | 0.00% | 0.00% |  |
| C | 57612 | 51421 | 0 | 0 | 0.00% | 0.00% |  |
| D | 57612 | 51303 | 0 | 0 | 0.00% | 0.00% |  |
Top three noisy pixels from each quadrant. If the there are fewer than three noisy pixels in the level2.evt file, extra rows are filled as -1
| Pixel properties | Quadrant properties | ||||||
|---|---|---|---|---|---|---|---|
| Quadrant | DetID | PixID | Counts | Sigma | Mean | Median | Sigma |
| A | 0 | 29 | 2802 | 10.56 | 775 | 723 | 196.9 |
| A | 7 | 110 | 2372 | 8.37 | 775 | 723 | 196.9 |
| A | 9 | 19 | 2305 | 8.03 | 775 | 723 | 196.9 |
| B | 2 | 9 | 2530 | 12.0 | 755 | 718 | 151.0 |
| B | 3 | 80 | 1920 | 7.96 | 755 | 718 | 151.0 |
| B | 3 | 17 | 1896 | 7.8 | 755 | 718 | 151.0 |
| C | 12 | 241 | 2109 | 7.0 | 764 | 710 | 199.8 |
| C | 7 | 111 | 1953 | 6.22 | 764 | 710 | 199.8 |
| C | 2 | 191 | 1945 | 6.18 | 764 | 710 | 199.8 |
| D | 6 | 231 | 1934 | 6.46 | 728 | 665 | 196.3 |
| D | 3 | 14 | 1847 | 6.02 | 728 | 665 | 196.3 |
| D | 3 | 31 | 1845 | 6.01 | 728 | 665 | 196.3 |
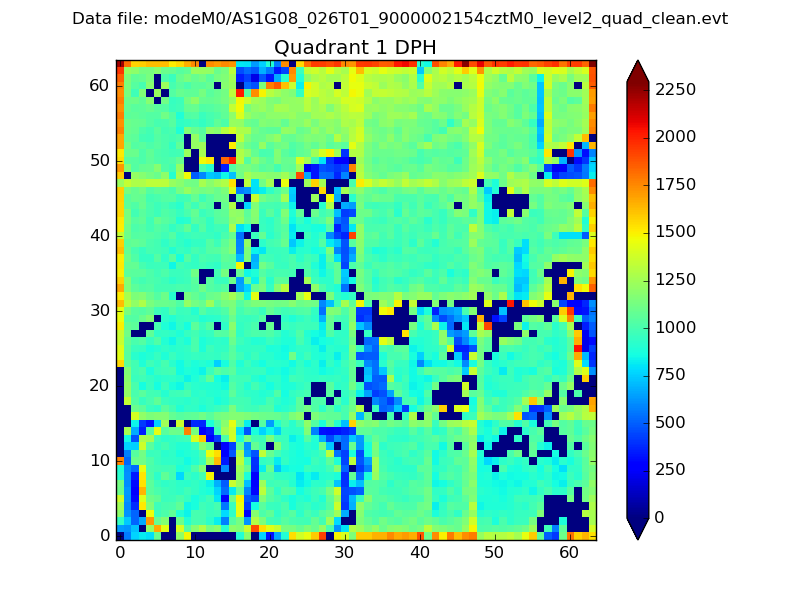
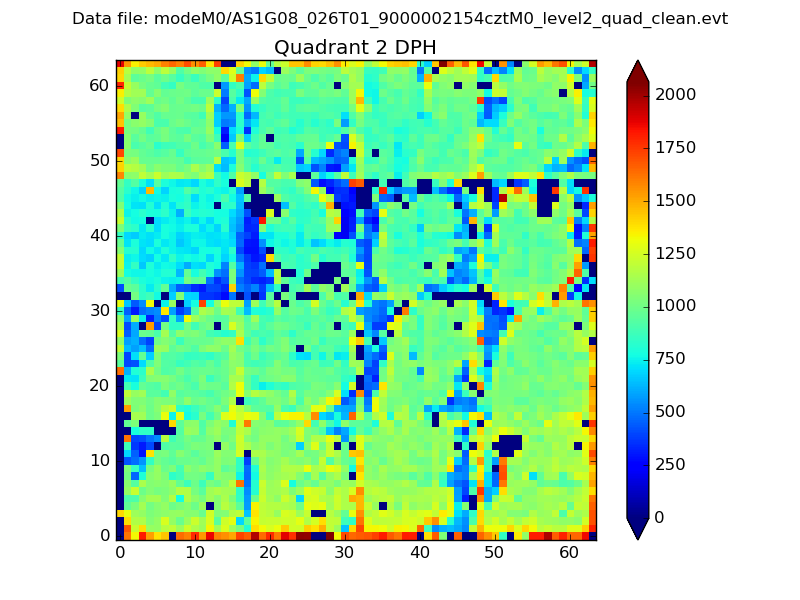
Histogram calculated using DETX and DETY for each event in the final _common_clean file
| Quadrant A |  |
 |
Quadrant B |
|---|---|---|---|
| Quadrant D |  |
 |
Quadrant C |
| Plot type | Count rate plots | Images |
|---|---|---|
| Comparison with Poisson distribution Blue bars denote a histogram of data divided into 1 sec bins. Red curve is a Poisson curve with rate = median count rate of data. |
 |
 |
| Quadrant-wise count rates Data is divided into 100 sec bins |
 |
|
| Module-wise count rates for Quadrant A Data is divided into 100 sec bins |
 |
 |
| Module-wise count rates for Quadrant B Data is divided into 100 sec bins |
 |
 |
| Module-wise count rates for Quadrant C Data is divided into 100 sec bins |
 |
 |
| Module-wise count rates for Quadrant D Data is divided into 100 sec bins |
 |
 |
| Parameter | Plot |
|---|---|
| CZT HV Monitor |  |
| D_VDD | 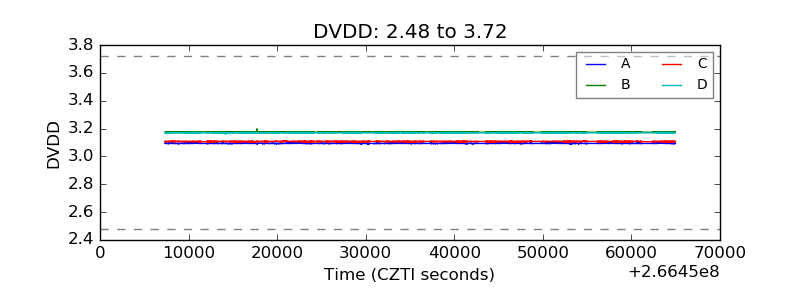 |
| Temperature 1 |  |
| Veto HV Monitor |  |
| Veto LLD |  |
| Alpha Counter |  |
| _CPM_Rate |  |
| CZT Counter |  |
| +2.5 Volts monitor |  |
| +5 Volts monitor |  |
| _ROLL_ROT |  |
| _Roll_DEC |  |
| _Roll_RA |  |
| Veto Counter |  |