| Param | Original file | Final file |
|---|---|---|
| Filename | modeM0/AS1G08_026T01_9000002154_14622cztM0_level2.evt | modeM0/AS1G08_026T01_9000002154_14622cztM0_level2_quad_clean.evt |
| Size (bytes) | 440,864,640 | 67,478,400 |
| Size | 420.4 MB | 64.4 MB |
| Events in quadrant A | 2,766,213 | 422,813 |
| Events in quadrant B | 3,250,541 | 416,428 |
| Events in quadrant C | 3,901,975 | 409,269 |
| Events in quadrant D | 3,056,425 | 406,821 |
| Mode SS | |||
|---|---|---|---|
| Quadrant | BADHDUFLAG | Total packets | Discarded packets |
| A | 0 | 114 | 0 |
| B | 0 | 114 | 0 |
| C | 0 | 114 | 0 |
| D | 0 | 114 | 0 |
| Mode M0 | |||
|---|---|---|---|
| Quadrant | BADHDUFLAG | Total packets | Discarded packets |
| A | 0 | 11922 | 2 |
| B | 0 | 13519 | 1 |
| C | 0 | 15538 | 1 |
| D | 0 | 13015 | 1 |
| Mode M9 | |||
|---|---|---|---|
| Quadrant | BADHDUFLAG | Total packets | Discarded packets |
| A | 0 | 6 | 0 |
| B | 0 | 6 | 0 |
| C | 0 | 6 | 0 |
| D | 0 | 6 | 0 |
| Quadrant | Total seconds | Saturated seconds | Saturation percentage |
|---|---|---|---|
| A | 5537 | 56 | 1.011378% |
| B | 5537 | 210 | 3.792668% |
| C | 5537 | 73 | 1.318403% |
| D | 5537 | 159 | 2.871591% |
Noise dominated data is calculated using 1-second bins in cleaned event files. If a bin has >2000 counts, and if more than 50% of those come from <1% of pixels, then it is considered to be noise-dominated and hence unusable.
| Quadrant | # 1 sec bins | Bins with >0 counts | Bins with >2000 counts | High rate bins dominated by noise | Noise dominated (total time) | Noise dominated (detector-on time) | Marked lightcurve |
|---|---|---|---|---|---|---|---|
| A | 6148 | 5539 | 2 | 2 | 0.03% | 0.04% | 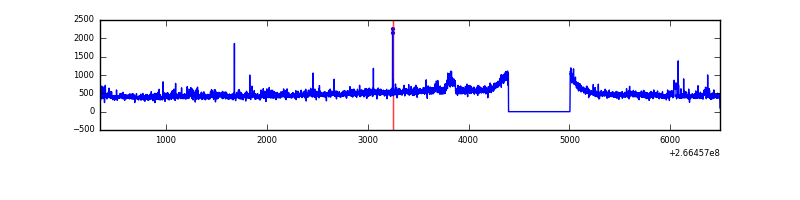 |
| B | 6148 | 5539 | 82 | 82 | 1.33% | 1.48% | 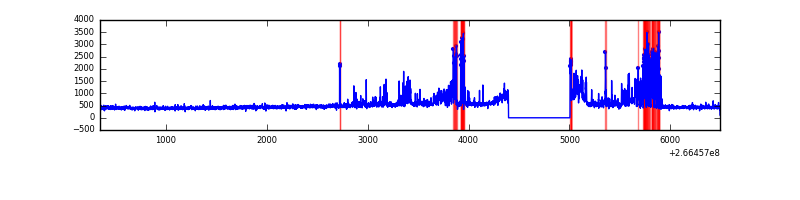 |
| C | 6148 | 5539 | 0 | 0 | 0.00% | 0.00% | 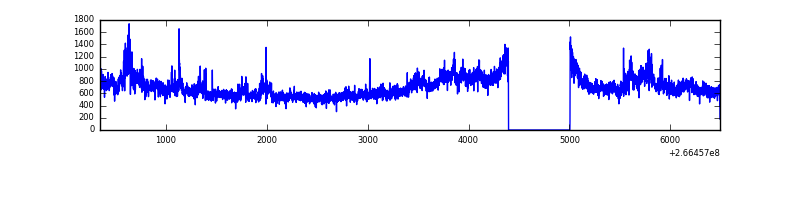 |
| D | 6148 | 5539 | 120 | 120 | 1.95% | 2.17% | 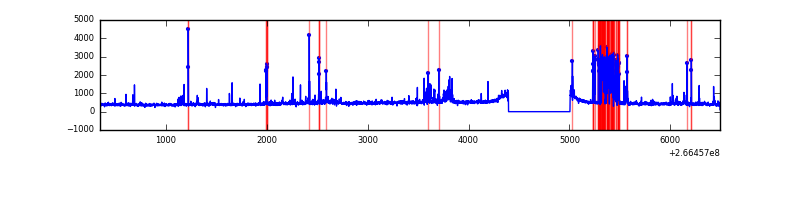 |
Top three noisy pixels from each quadrant. If the there are fewer than three noisy pixels in the level2.evt file, extra rows are filled as -1
| Pixel properties | Quadrant properties | ||||||
|---|---|---|---|---|---|---|---|
| Quadrant | DetID | PixID | Counts | Sigma | Mean | Median | Sigma |
| A | 1 | 162 | 67012 | 481.77 | 672 | 658 | 137.7 |
| A | 0 | 23 | 31806 | 226.15 | 672 | 658 | 137.7 |
| A | 1 | 178 | 23251 | 164.04 | 672 | 658 | 137.7 |
| B | 10 | 16 | 448865 | 3493.56 | 663 | 645 | 128.3 |
| B | 0 | 189 | 139546 | 1082.63 | 663 | 645 | 128.3 |
| B | 0 | 229 | 32247 | 246.32 | 663 | 645 | 128.3 |
| C | 3 | 233 | 1360556 | 9009.31 | 648 | 653 | 150.9 |
| C | 3 | 234 | 5174 | 29.95 | 648 | 653 | 150.9 |
| C | 13 | 61 | 4658 | 26.53 | 648 | 653 | 150.9 |
| D | 10 | 199 | 447857 | 2890.53 | 644 | 629 | 154.7 |
| D | 13 | 172 | 40193 | 255.71 | 644 | 629 | 154.7 |
| D | 10 | 70 | 39927 | 253.99 | 644 | 629 | 154.7 |
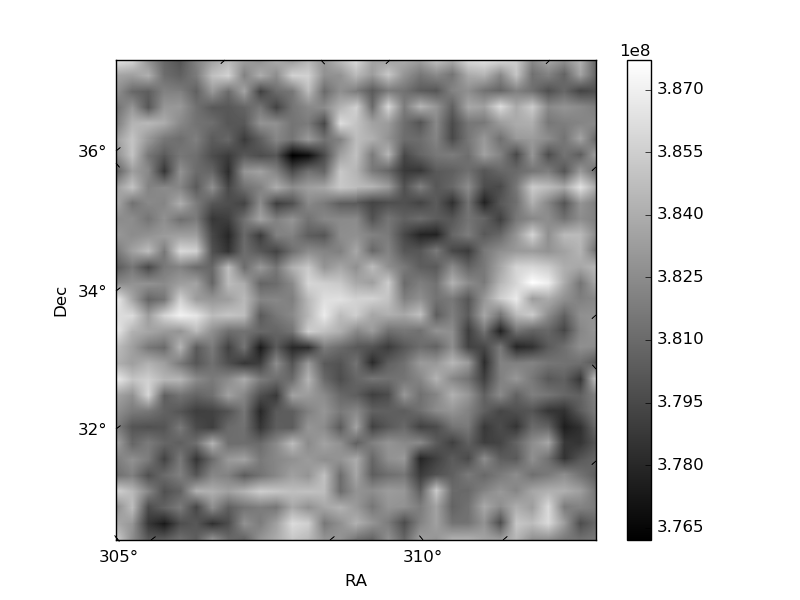
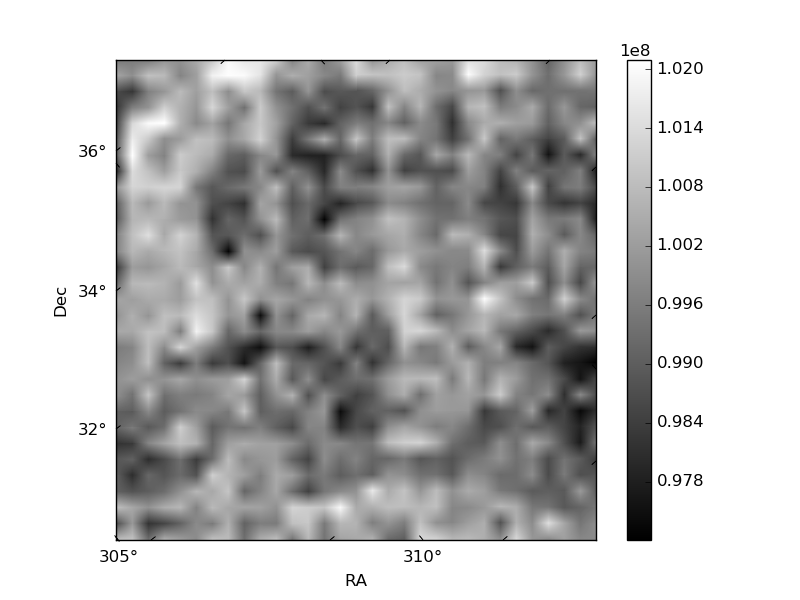
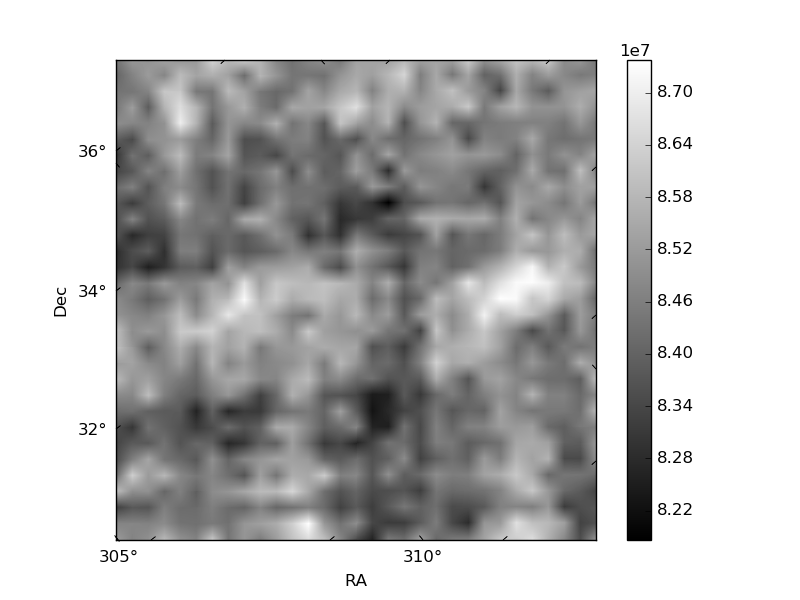
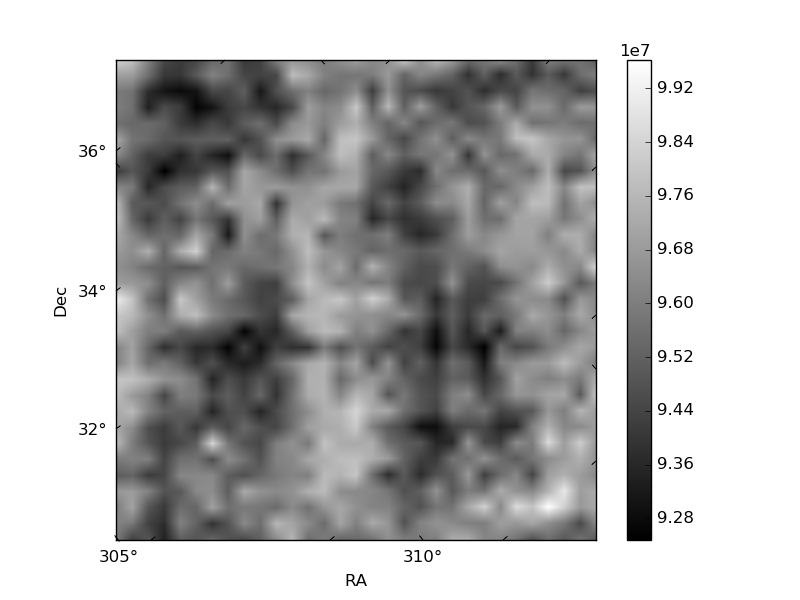
Histogram calculated using DETX and DETY for each event in the final _common_clean file
| Quadrant A | 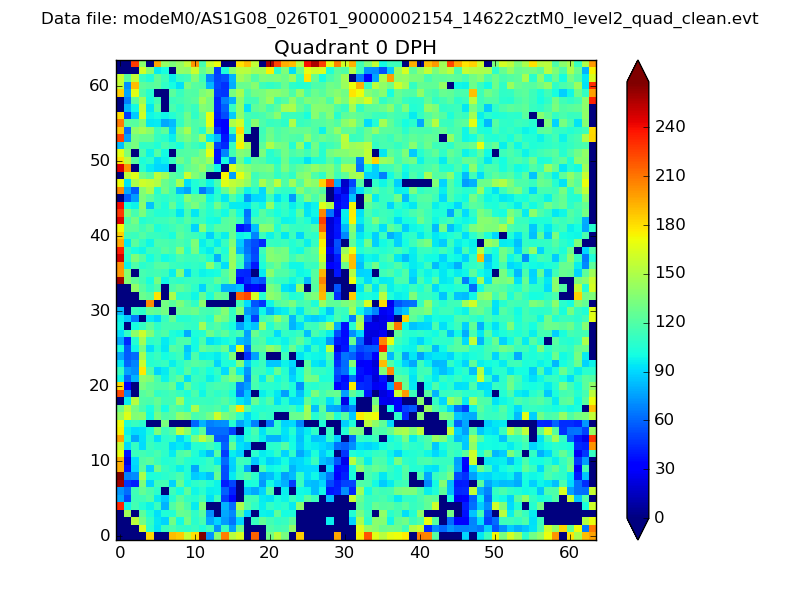 |
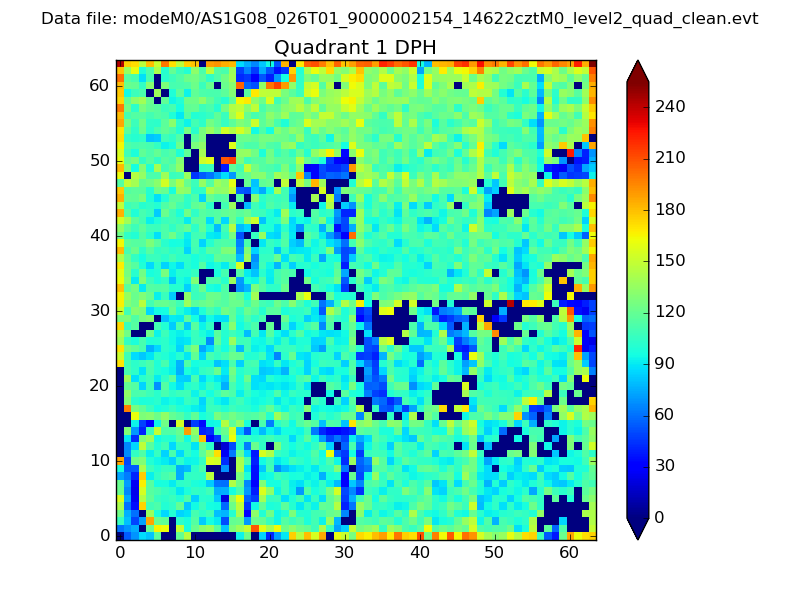 |
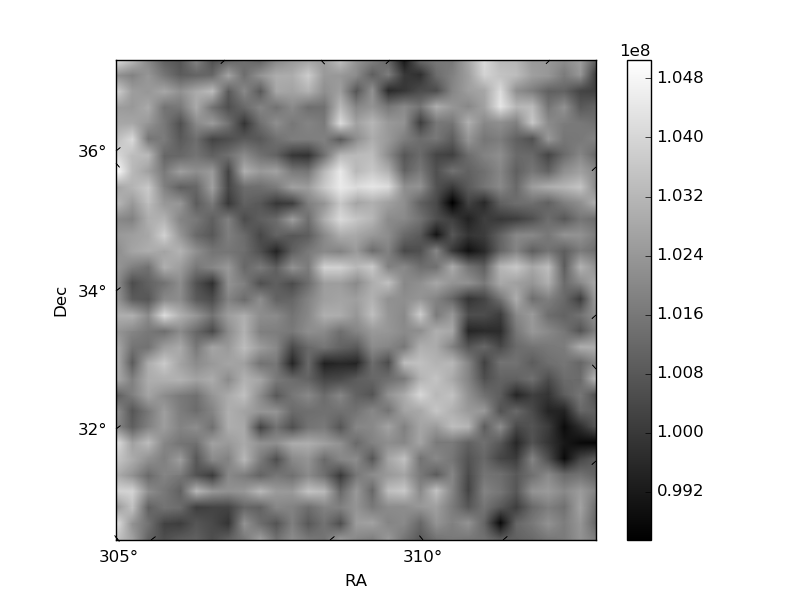
Quadrant B |
|---|---|---|---|
| Quadrant D | 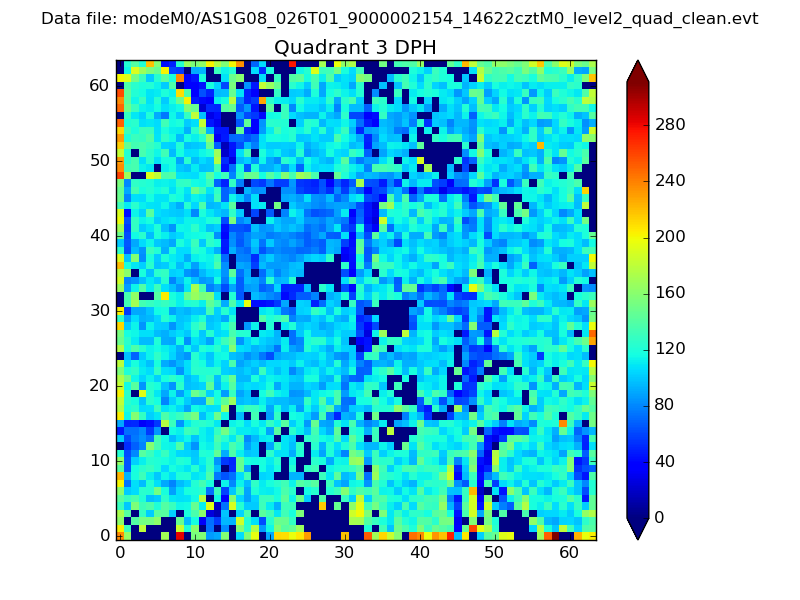 |
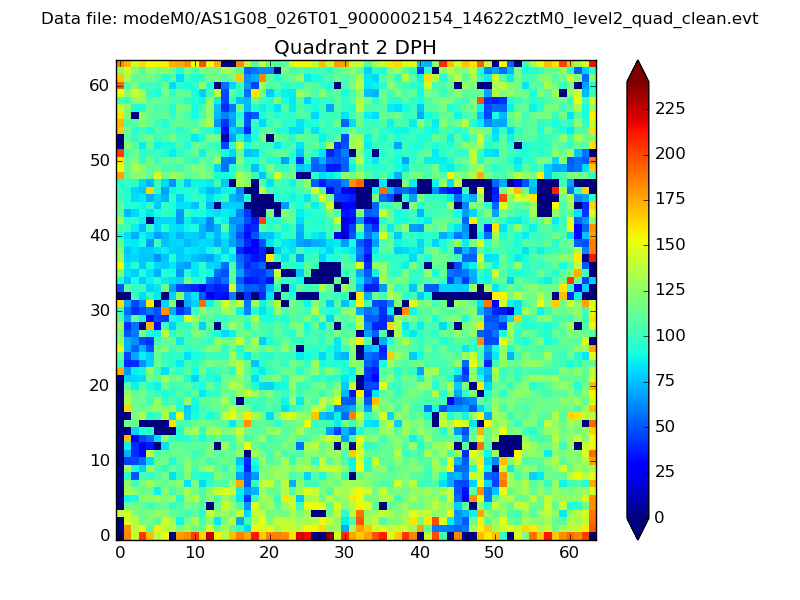 |
Quadrant C |
| Plot type | Count rate plots | Images |
|---|---|---|
| Comparison with Poisson distribution Blue bars denote a histogram of data divided into 1 sec bins. Red curve is a Poisson curve with rate = median count rate of data. |
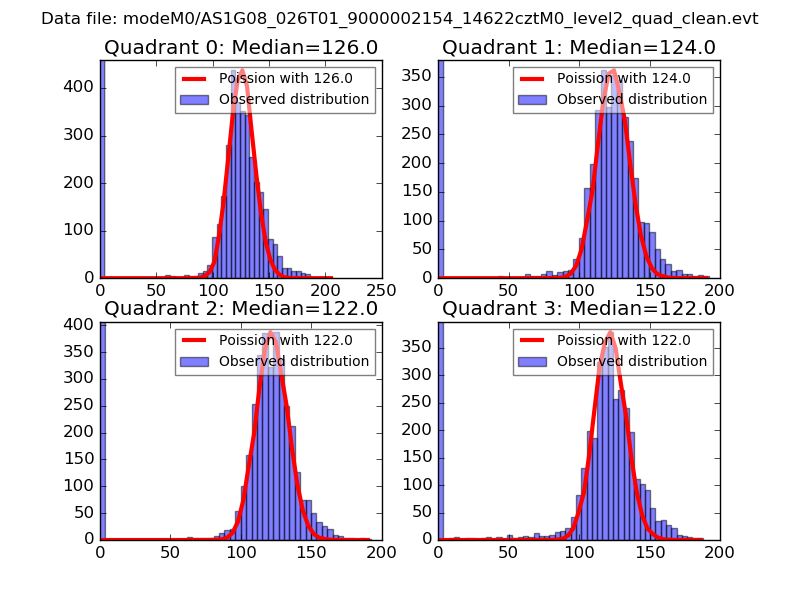 |
 |
| Quadrant-wise count rates Data is divided into 100 sec bins |
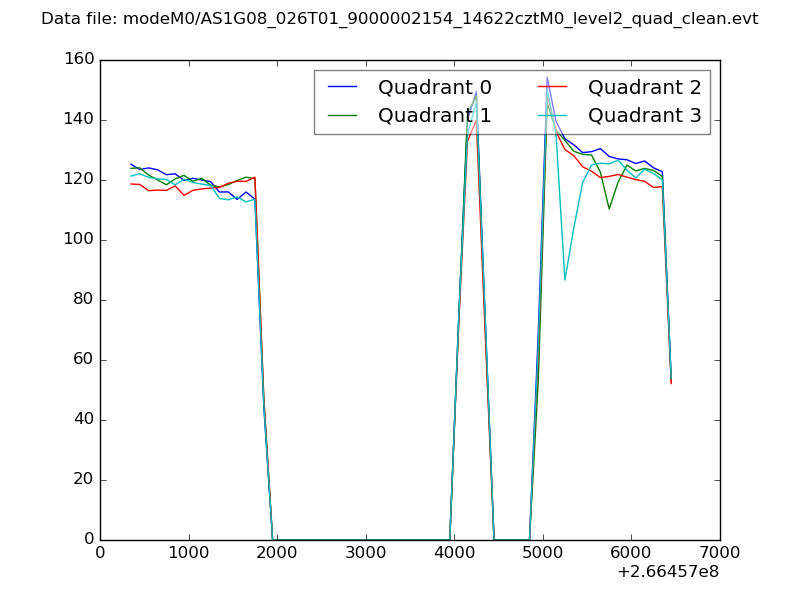 |
|
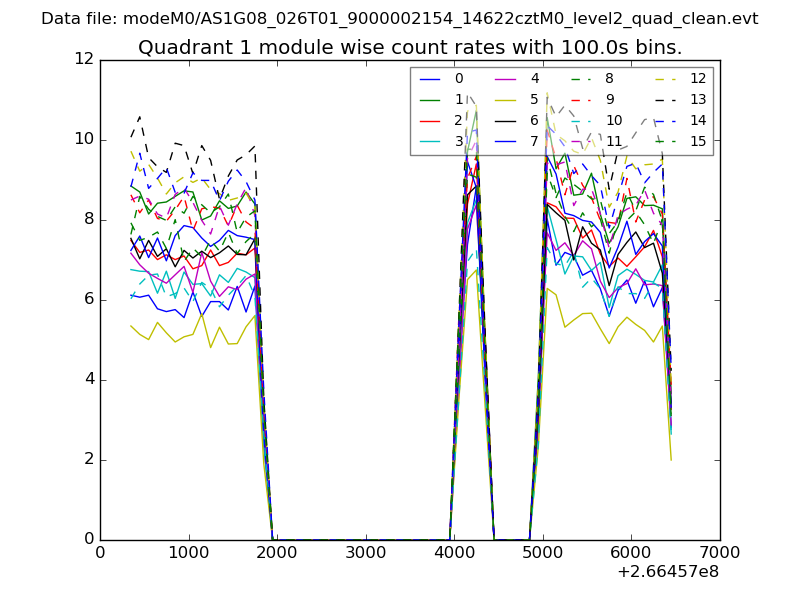
| Module-wise count rates for Quadrant A Data is divided into 100 sec bins |
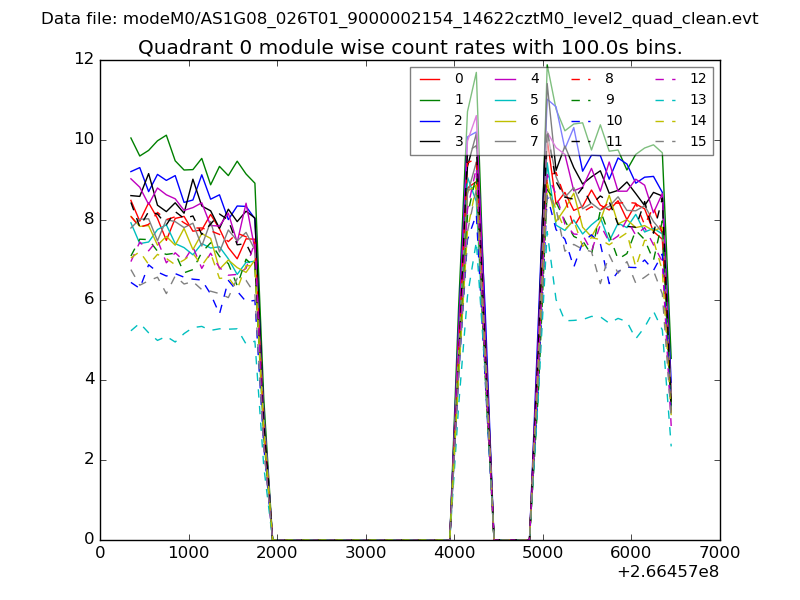 |
 |
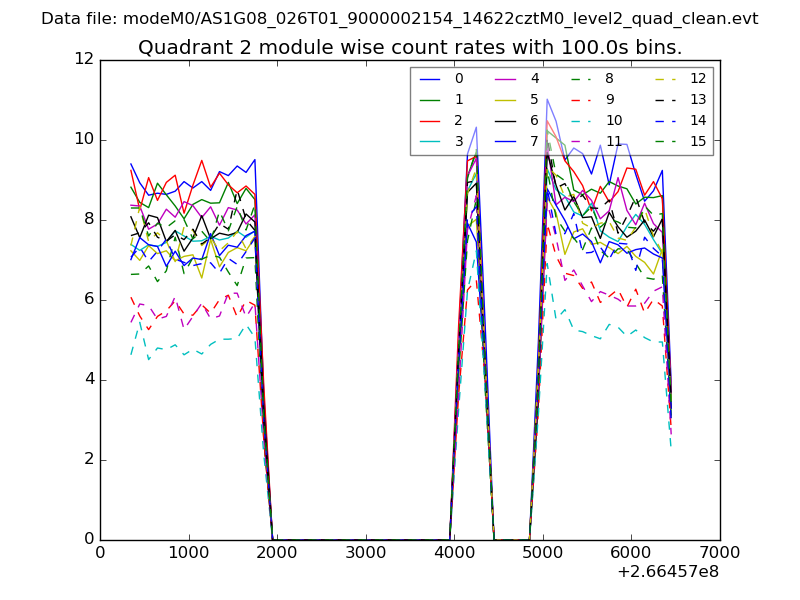
| Module-wise count rates for Quadrant B Data is divided into 100 sec bins |
 |
 |
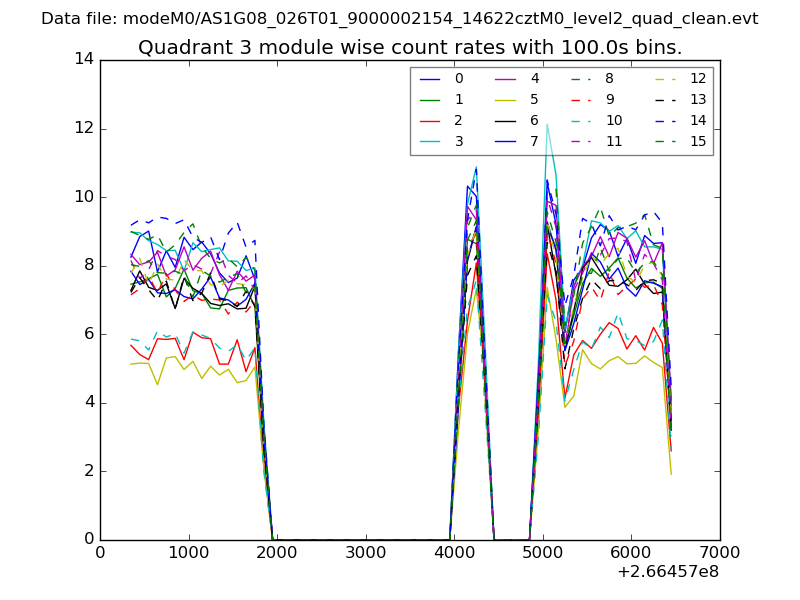
| Module-wise count rates for Quadrant C Data is divided into 100 sec bins |
 |
 |
| Module-wise count rates for Quadrant D Data is divided into 100 sec bins |
 |
 |
| Parameter | Plot |
|---|---|
| CZT HV Monitor | 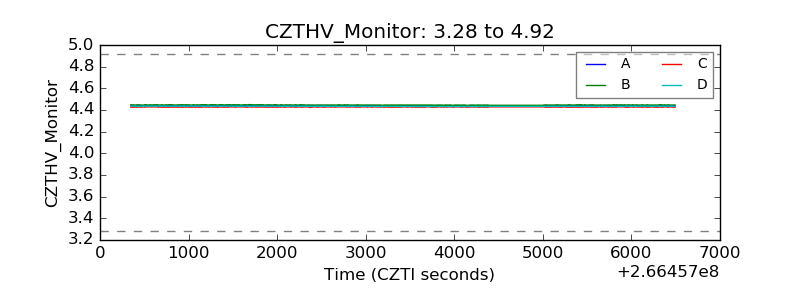 |
| D_VDD | 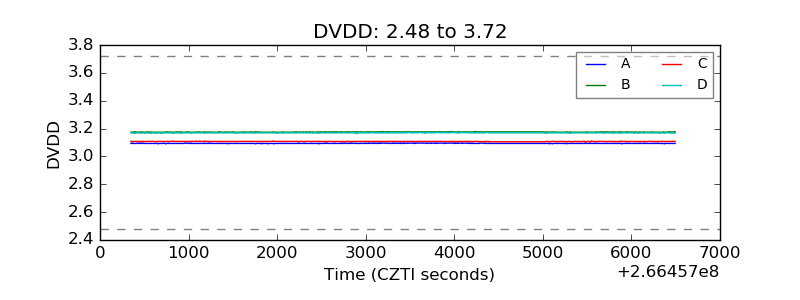 |
| Temperature 1 | 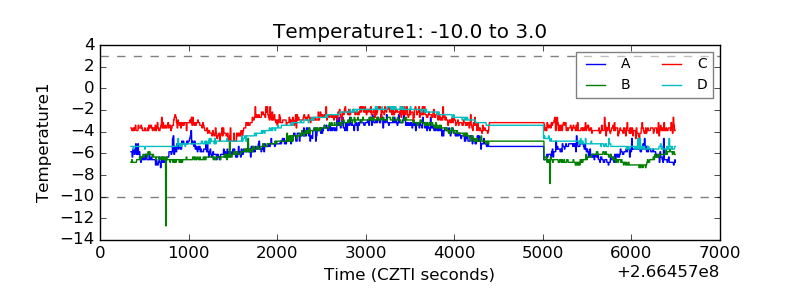 |
| Veto HV Monitor | 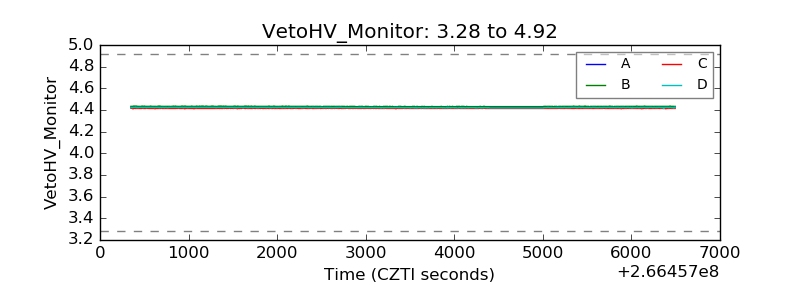 |
| Veto LLD | 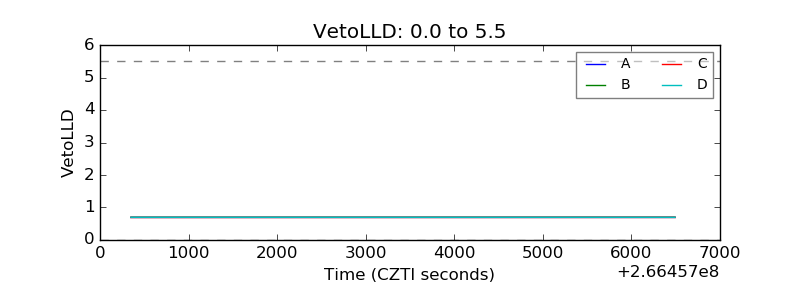 |
| Alpha Counter | 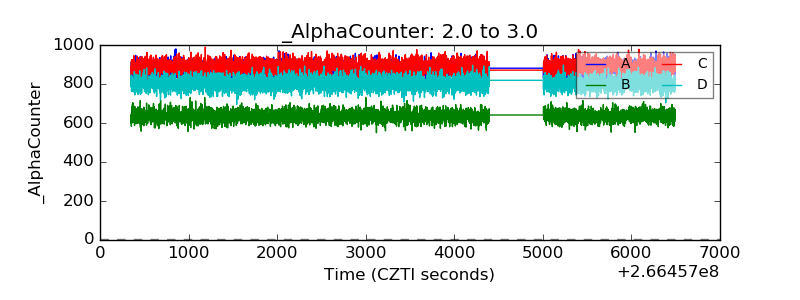 |
| _CPM_Rate |  |
| CZT Counter | 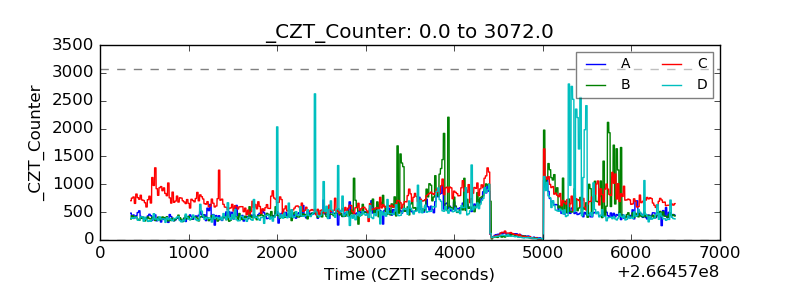 |
| +2.5 Volts monitor |  |
| +5 Volts monitor |  |
| _ROLL_ROT | 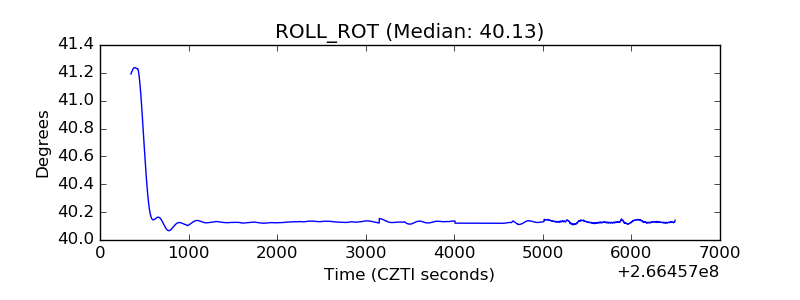 |
| _Roll_DEC | 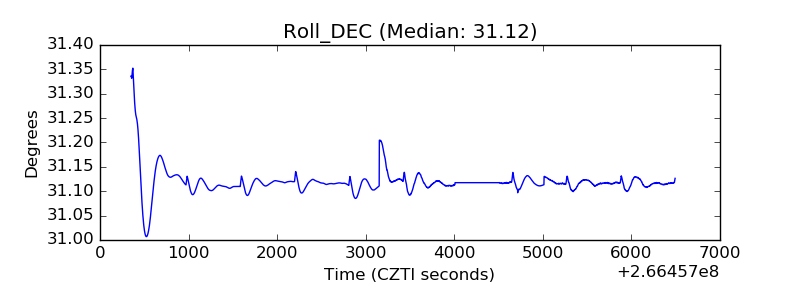 |
| _Roll_RA | 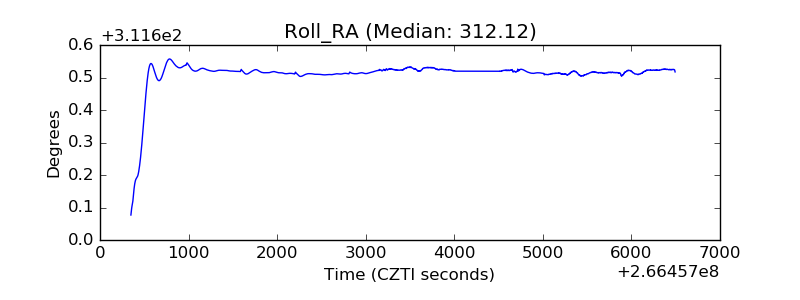 |
| Veto Counter | 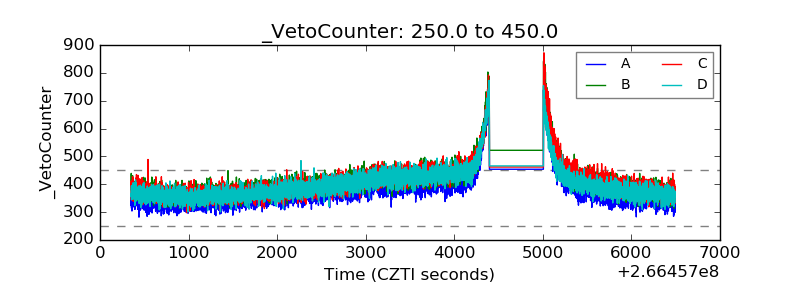 |