| Param | Original file | Final file |
|---|---|---|
| Filename | modeM0/AS1G08_026T01_9000002154_14623cztM0_level2.evt | modeM0/AS1G08_026T01_9000002154_14623cztM0_level2_quad_clean.evt |
| Size (bytes) | 624,156,480 | 104,163,840 |
| Size | 595.2 MB | 99.3 MB |
| Events in quadrant A | 3,747,469 | 676,281 |
| Events in quadrant B | 4,041,903 | 669,063 |
| Events in quadrant C | 5,245,701 | 654,694 |
| Events in quadrant D | 5,358,970 | 631,600 |
| Mode SS | |||
|---|---|---|---|
| Quadrant | BADHDUFLAG | Total packets | Discarded packets |
| A | 0 | 152 | 0 |
| B | 0 | 152 | 0 |
| C | 0 | 152 | 0 |
| D | 0 | 152 | 0 |
| Mode M0 | |||
|---|---|---|---|
| Quadrant | BADHDUFLAG | Total packets | Discarded packets |
| A | 0 | 16100 | 3 |
| B | 0 | 16974 | 2 |
| C | 0 | 21283 | 2 |
| D | 0 | 21168 | 2 |
| Mode M9 | |||
|---|---|---|---|
| Quadrant | BADHDUFLAG | Total packets | Discarded packets |
| A | 0 | 7 | 0 |
| B | 0 | 7 | 0 |
| C | 0 | 7 | 0 |
| D | 0 | 8 | 0 |
| Quadrant | Total seconds | Saturated seconds | Saturation percentage |
|---|---|---|---|
| A | 7513 | 77 | 1.024890% |
| B | 7513 | 195 | 2.595501% |
| C | 7513 | 87 | 1.157993% |
| D | 7513 | 632 | 8.412086% |
Noise dominated data is calculated using 1-second bins in cleaned event files. If a bin has >2000 counts, and if more than 50% of those come from <1% of pixels, then it is considered to be noise-dominated and hence unusable.
| Quadrant | # 1 sec bins | Bins with >0 counts | Bins with >2000 counts | High rate bins dominated by noise | Noise dominated (total time) | Noise dominated (detector-on time) | Marked lightcurve |
|---|---|---|---|---|---|---|---|
| A | 7809 | 7516 | 2 | 2 | 0.03% | 0.03% | 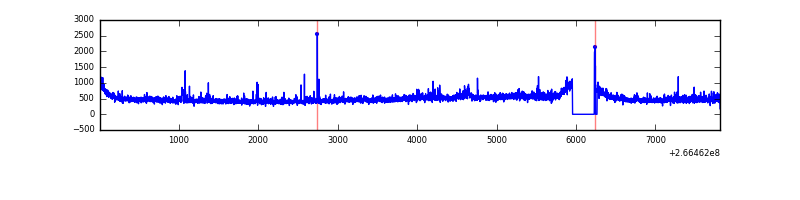 |
| B | 7809 | 7515 | 58 | 58 | 0.74% | 0.77% | 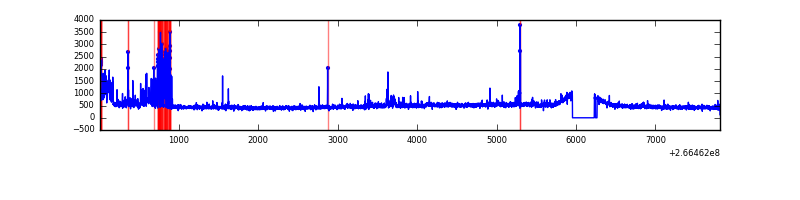 |
| C | 7809 | 7516 | 0 | 0 | 0.00% | 0.00% | 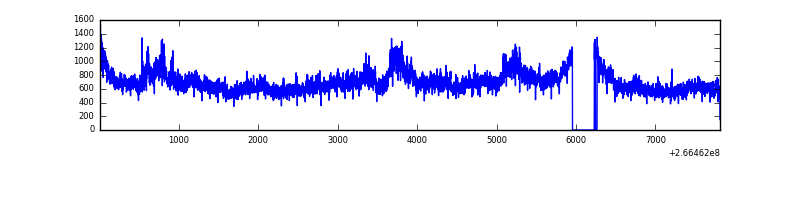 |
| D | 7809 | 7516 | 530 | 530 | 6.79% | 7.05% | 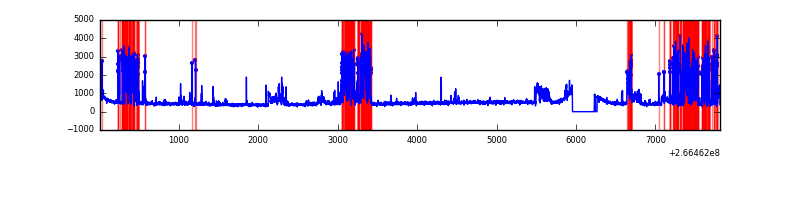 |
Top three noisy pixels from each quadrant. If the there are fewer than three noisy pixels in the level2.evt file, extra rows are filled as -1
| Pixel properties | Quadrant properties | ||||||
|---|---|---|---|---|---|---|---|
| Quadrant | DetID | PixID | Counts | Sigma | Mean | Median | Sigma |
| A | 1 | 162 | 83023 | 442.64 | 907 | 889 | 185.6 |
| A | 1 | 178 | 35888 | 188.62 | 907 | 889 | 185.6 |
| A | 1 | 161 | 31481 | 164.87 | 907 | 889 | 185.6 |
| B | 10 | 16 | 374832 | 2146.27 | 902 | 880 | 174.2 |
| B | 0 | 229 | 35645 | 199.53 | 902 | 880 | 174.2 |
| B | 0 | 189 | 31346 | 174.86 | 902 | 880 | 174.2 |
| C | 3 | 233 | 1806971 | 8853.94 | 880 | 886 | 204.0 |
| C | 13 | 61 | 6353 | 26.8 | 880 | 886 | 204.0 |
| C | 3 | 234 | 4620 | 18.31 | 880 | 886 | 204.0 |
| D | 10 | 199 | 1680850 | 8292.21 | 849 | 827 | 202.6 |
| D | 12 | 110 | 383432 | 1888.45 | 849 | 827 | 202.6 |
| D | 13 | 172 | 26302 | 125.74 | 849 | 827 | 202.6 |
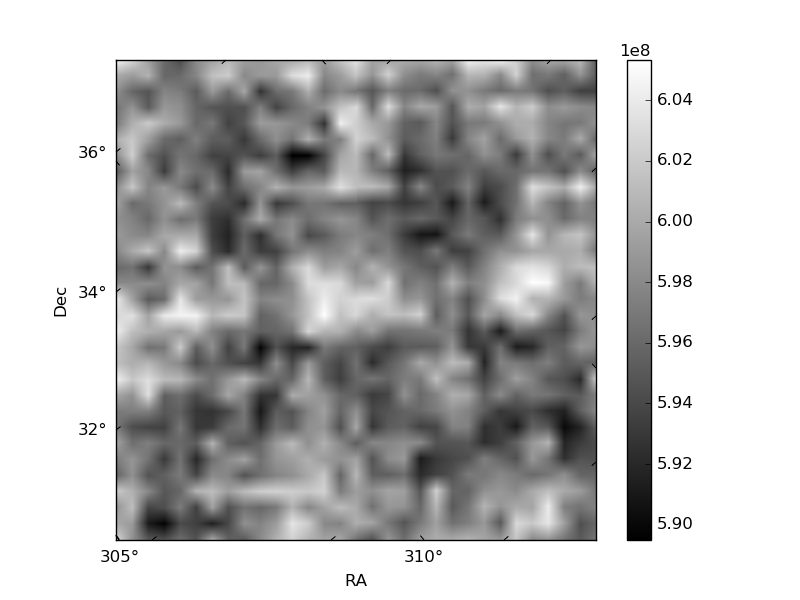
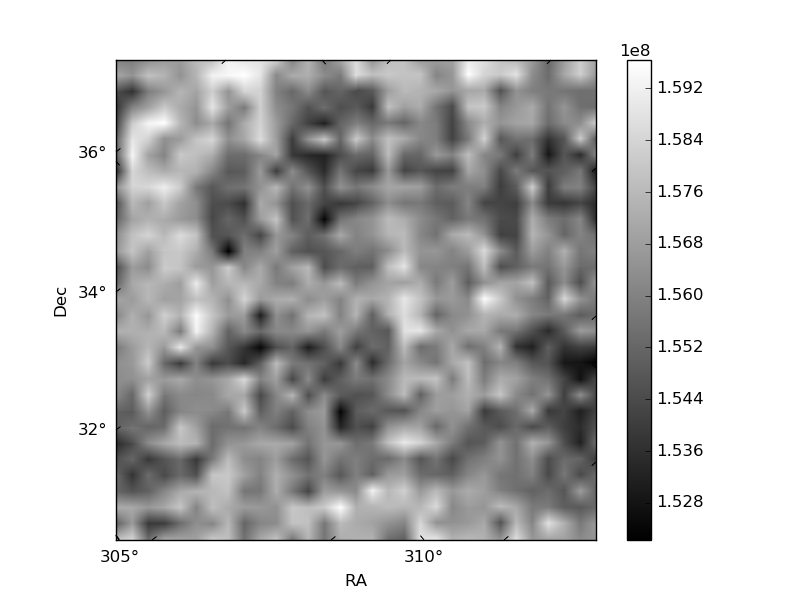
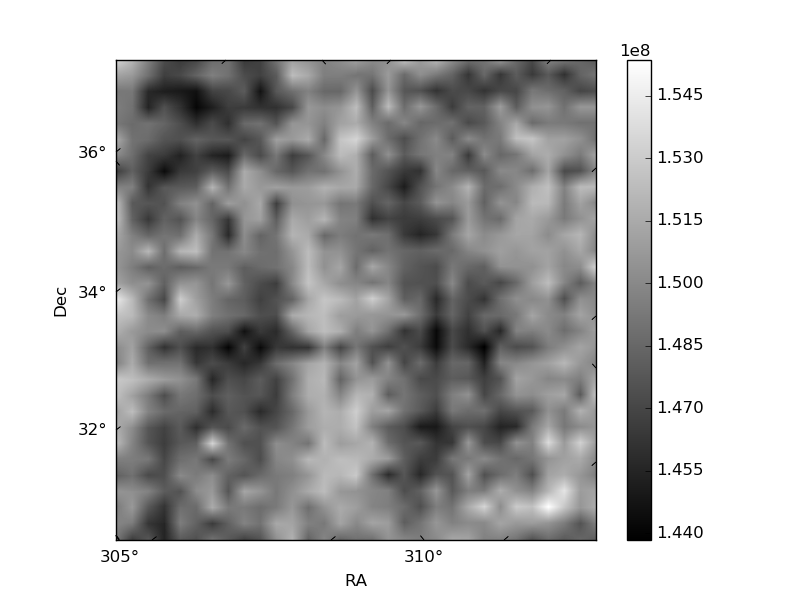
Histogram calculated using DETX and DETY for each event in the final _common_clean file
| Quadrant A | 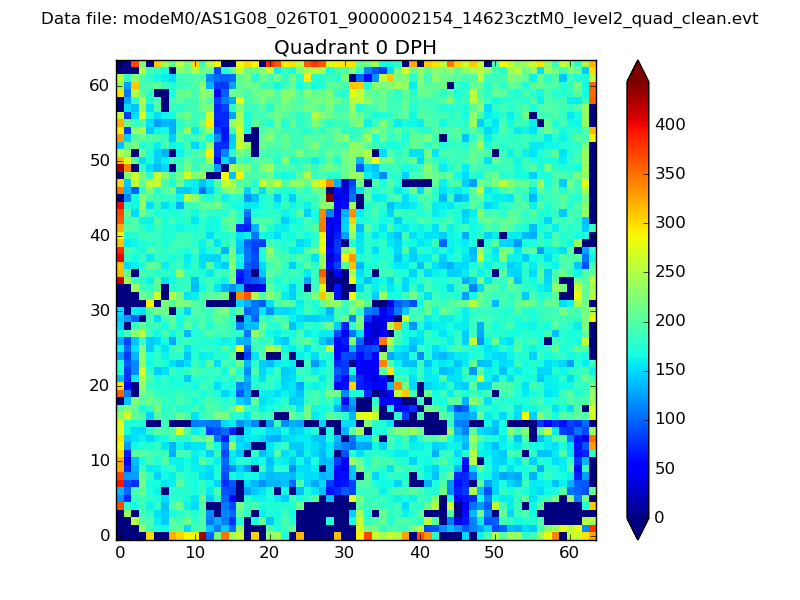 |
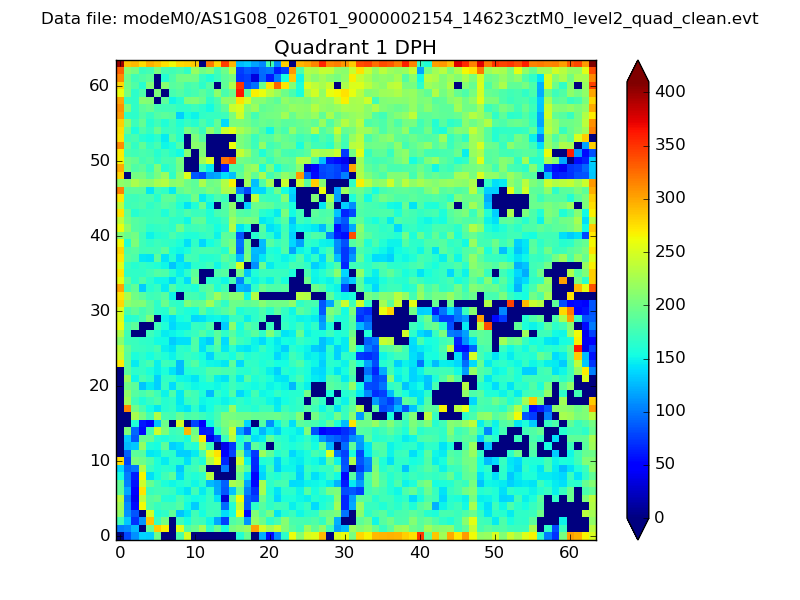 |
Quadrant B |
|---|---|---|---|
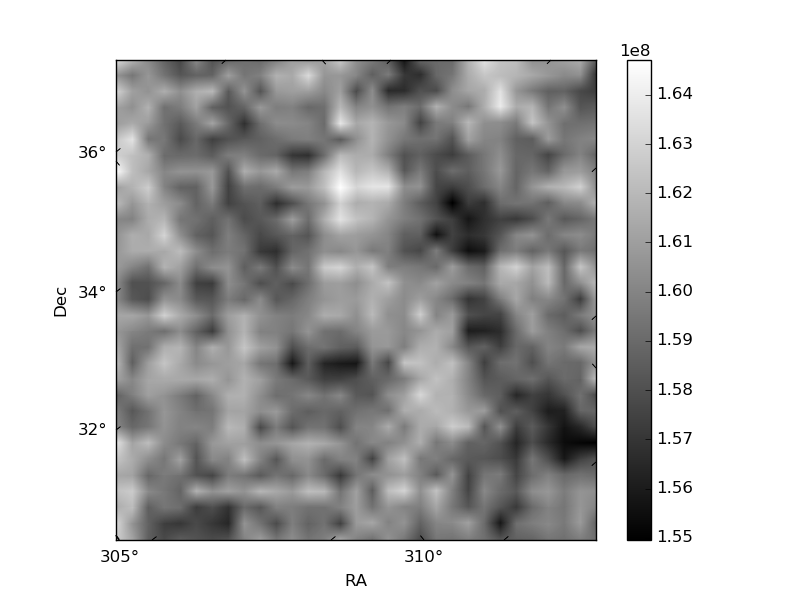
| Quadrant D | 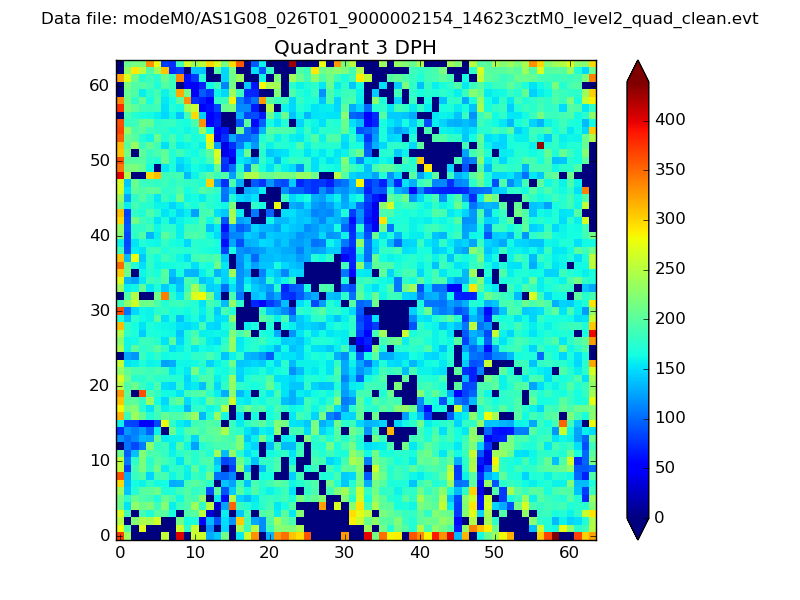 |
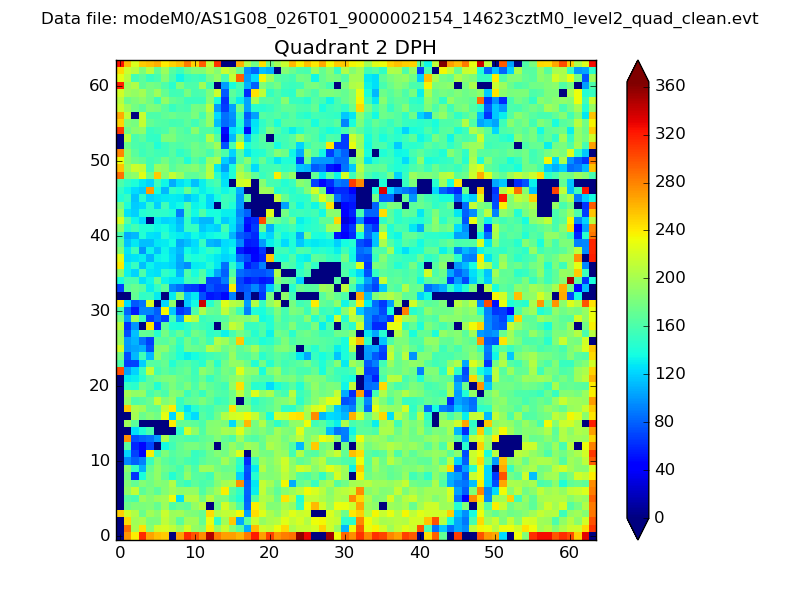 |
Quadrant C |
| Plot type | Count rate plots | Images |
|---|---|---|
| Comparison with Poisson distribution Blue bars denote a histogram of data divided into 1 sec bins. Red curve is a Poisson curve with rate = median count rate of data. |
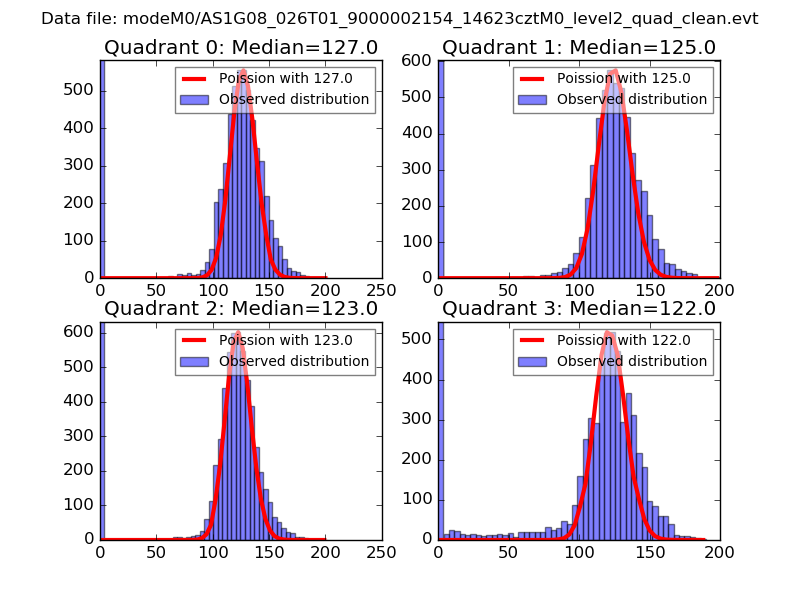 |
 |
| Quadrant-wise count rates Data is divided into 100 sec bins |
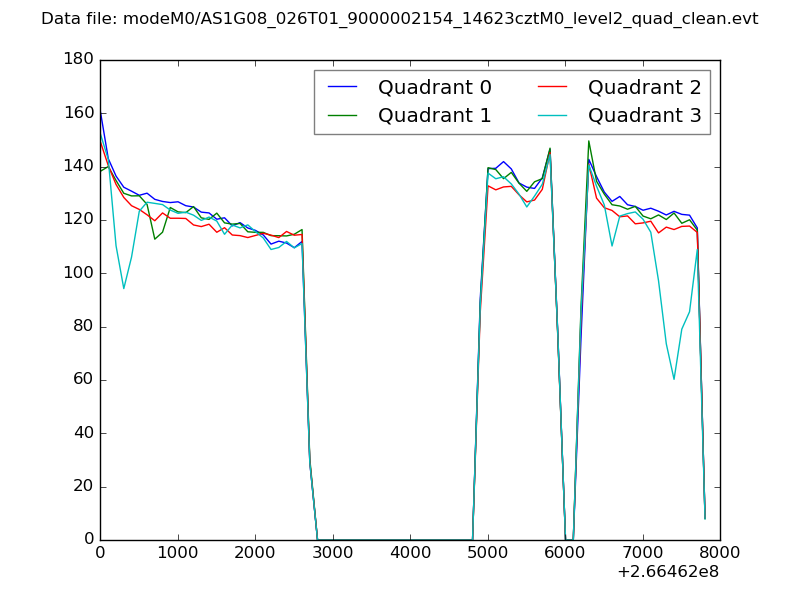 |
|
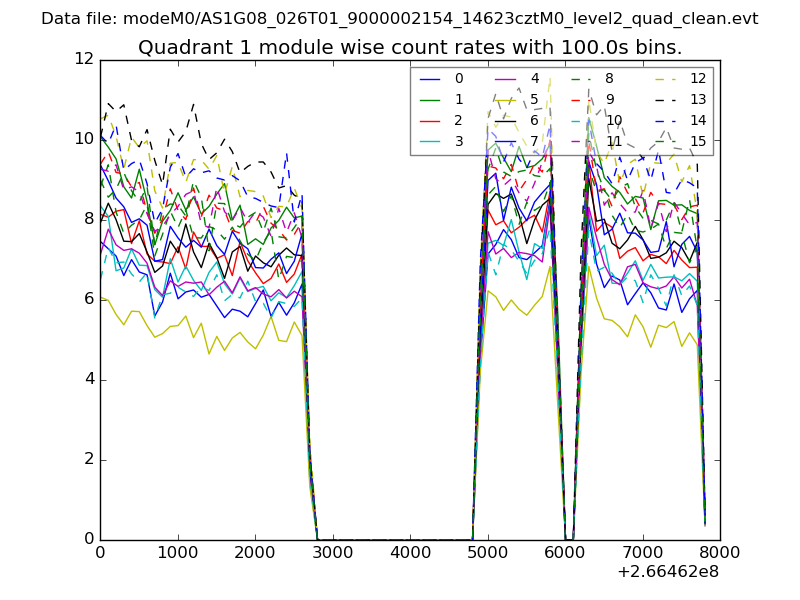
| Module-wise count rates for Quadrant A Data is divided into 100 sec bins |
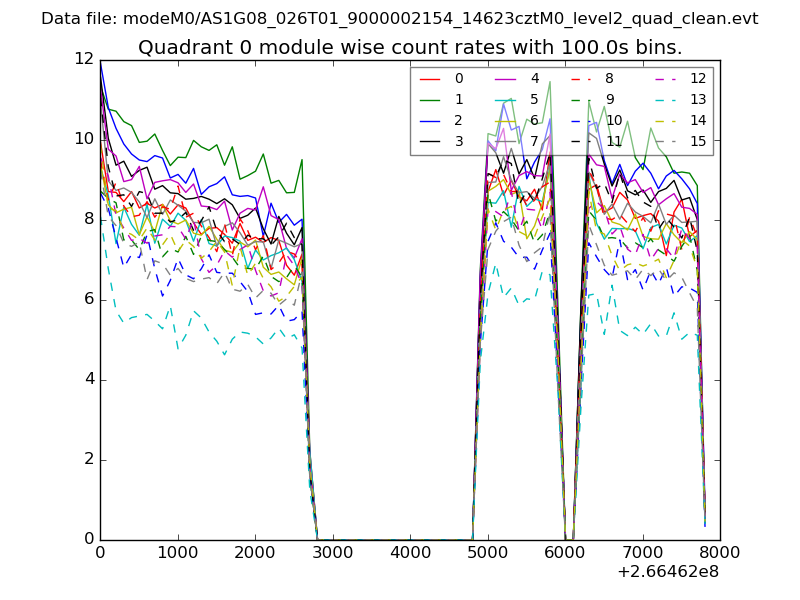 |
 |
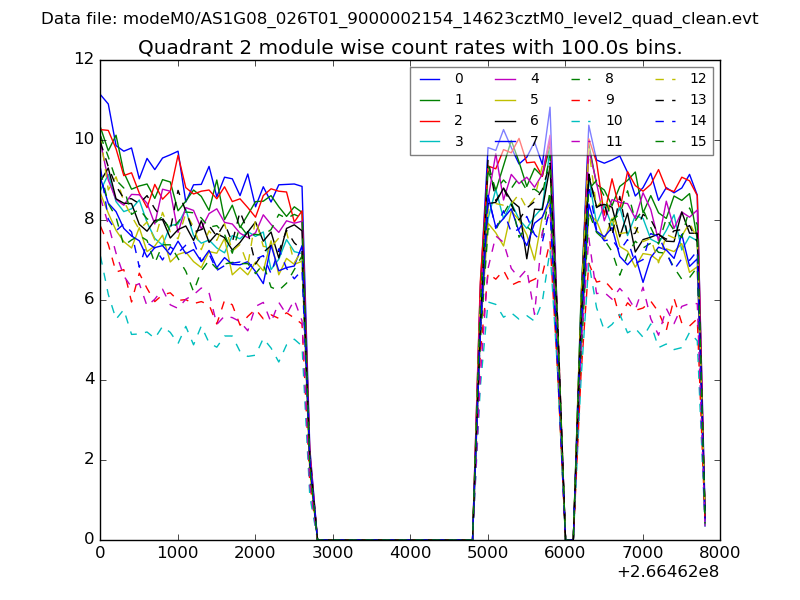
| Module-wise count rates for Quadrant B Data is divided into 100 sec bins |
 |
 |
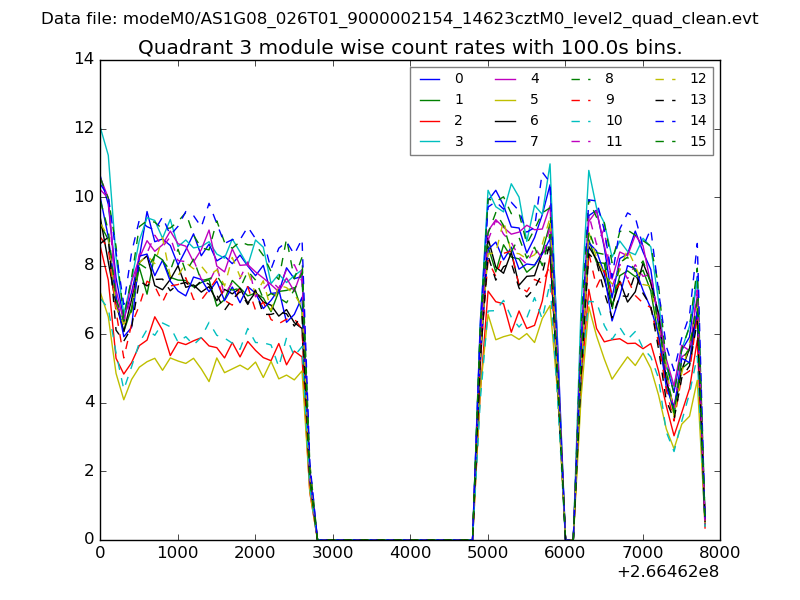
| Module-wise count rates for Quadrant C Data is divided into 100 sec bins |
 |
 |
| Module-wise count rates for Quadrant D Data is divided into 100 sec bins |
 |
 |
| Parameter | Plot |
|---|---|
| CZT HV Monitor | 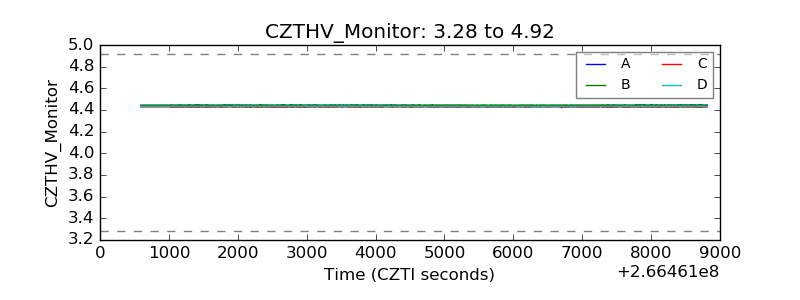 |
| D_VDD | 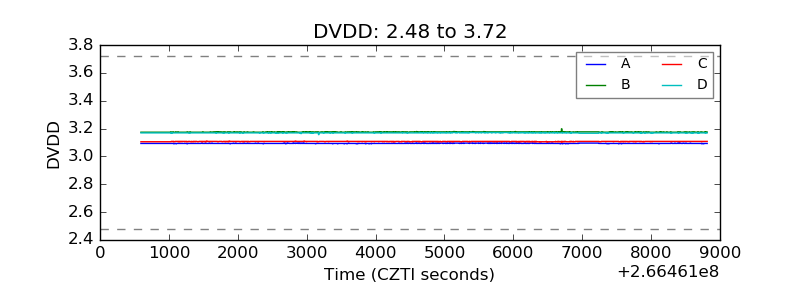 |
| Temperature 1 | 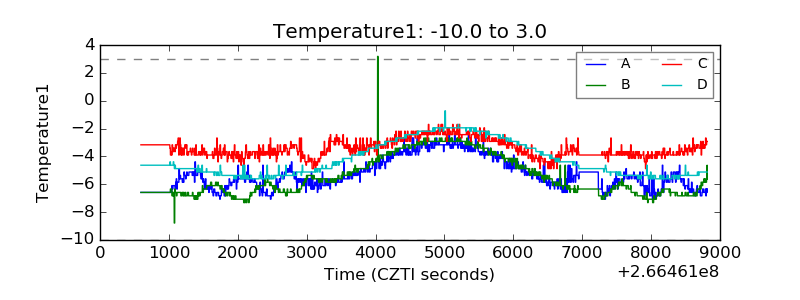 |
| Veto HV Monitor | 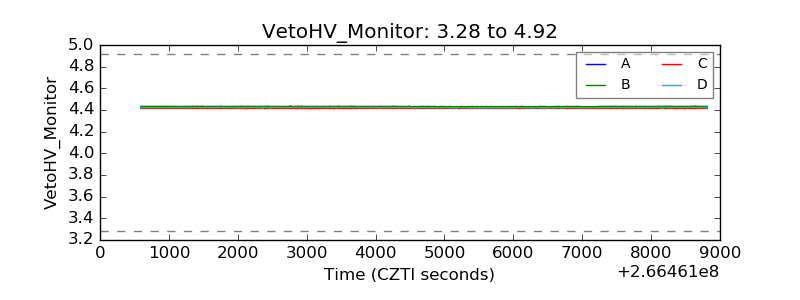 |
| Veto LLD | 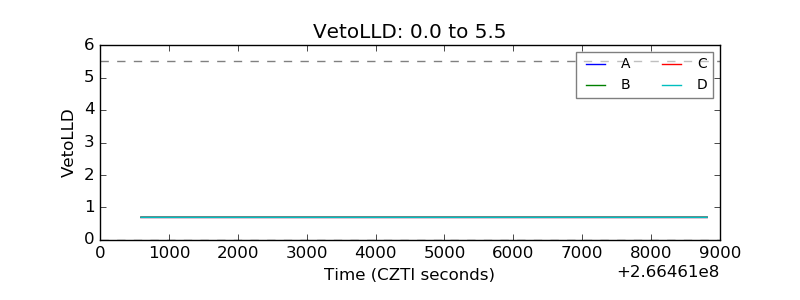 |
| Alpha Counter | 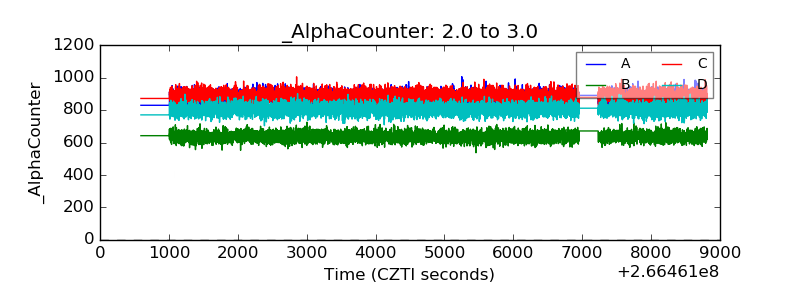 |
| _CPM_Rate | 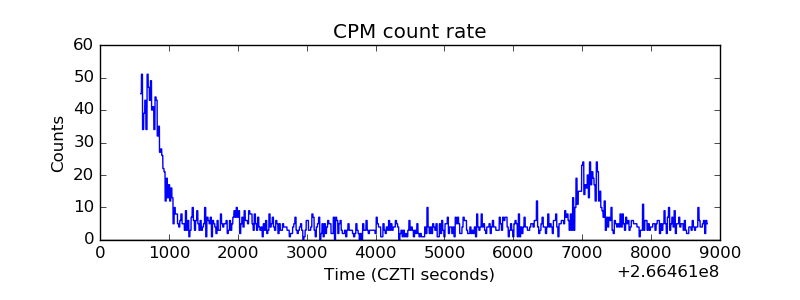 |
| CZT Counter | 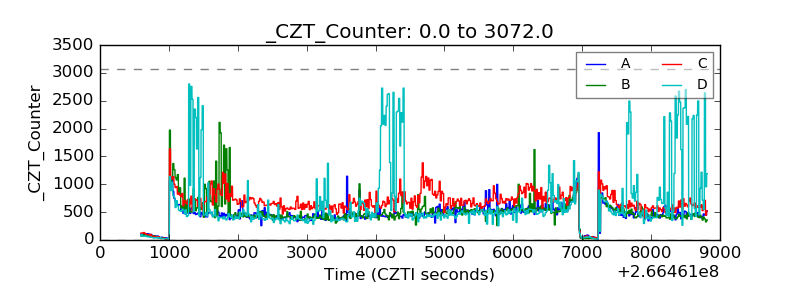 |
| +2.5 Volts monitor |  |
| +5 Volts monitor |  |
| _ROLL_ROT | 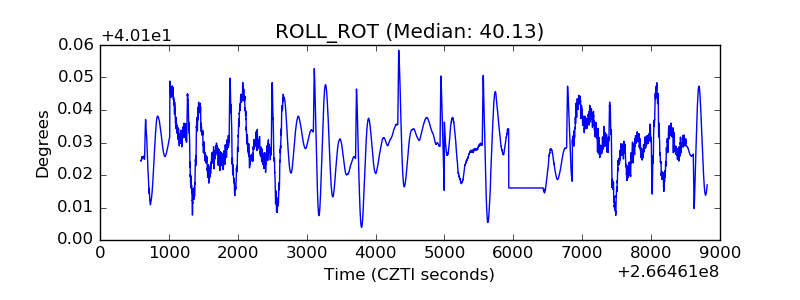 |
| _Roll_DEC | 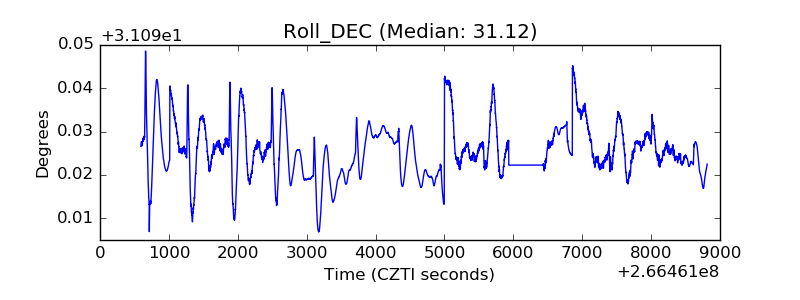 |
| _Roll_RA | 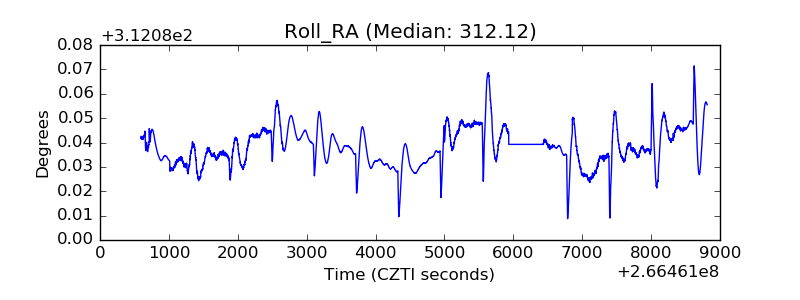 |
| Veto Counter | 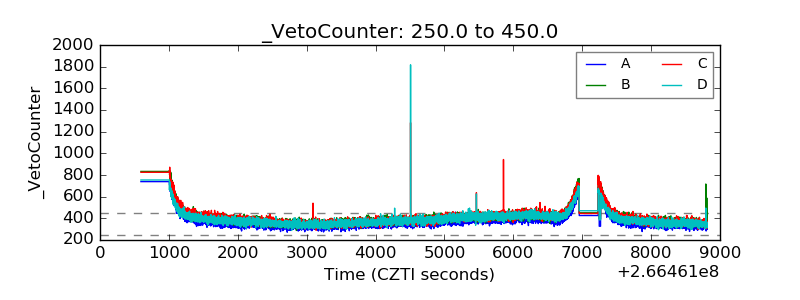 |