| Param | Original file | Final file |
|---|---|---|
| Filename | modeM0/AS1G08_026T01_9000002154_14627cztM0_level2.evt | modeM0/AS1G08_026T01_9000002154_14627cztM0_level2_quad_clean.evt |
| Size (bytes) | 1,421,821,440 | 210,680,640 |
| Size | 1.3 GB | 200.9 MB |
| Events in quadrant A | 9,265,388 | 1,311,687 |
| Events in quadrant B | 8,995,384 | 1,311,946 |
| Events in quadrant C | 13,525,396 | 1,269,767 |
| Events in quadrant D | 10,058,210 | 1,245,213 |
| Mode SS | |||
|---|---|---|---|
| Quadrant | BADHDUFLAG | Total packets | Discarded packets |
| A | 0 | 366 | 0 |
| B | 0 | 366 | 0 |
| C | 0 | 366 | 0 |
| D | 0 | 366 | 0 |
| Mode M0 | |||
|---|---|---|---|
| Quadrant | BADHDUFLAG | Total packets | Discarded packets |
| A | 0 | 38785 | 4 |
| B | 0 | 38094 | 3 |
| C | 0 | 54015 | 3 |
| D | 0 | 42410 | 3 |
| Mode M9 | |||
|---|---|---|---|
| Quadrant | BADHDUFLAG | Total packets | Discarded packets |
| A | 0 | 19 | 0 |
| B | 0 | 19 | 0 |
| C | 0 | 19 | 0 |
| D | 0 | 19 | 0 |
| Quadrant | Total seconds | Saturated seconds | Saturation percentage |
|---|---|---|---|
| A | 18018 | 213 | 1.182151% |
| B | 18018 | 238 | 1.320901% |
| C | 18018 | 200 | 1.110001% |
| D | 18018 | 820 | 4.551005% |
Noise dominated data is calculated using 1-second bins in cleaned event files. If a bin has >2000 counts, and if more than 50% of those come from <1% of pixels, then it is considered to be noise-dominated and hence unusable.
| Quadrant | # 1 sec bins | Bins with >0 counts | Bins with >2000 counts | High rate bins dominated by noise | Noise dominated (total time) | Noise dominated (detector-on time) | Marked lightcurve |
|---|---|---|---|---|---|---|---|
| A | 19854 | 18019 | 5 | 5 | 0.03% | 0.03% | 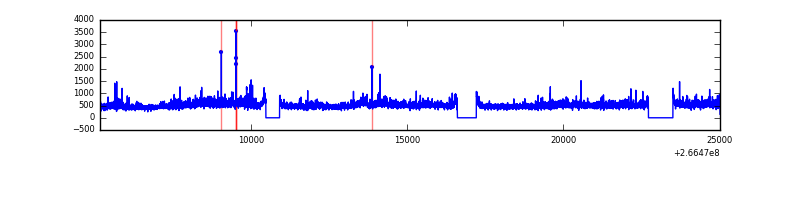 |
| B | 19854 | 18019 | 17 | 17 | 0.09% | 0.09% | 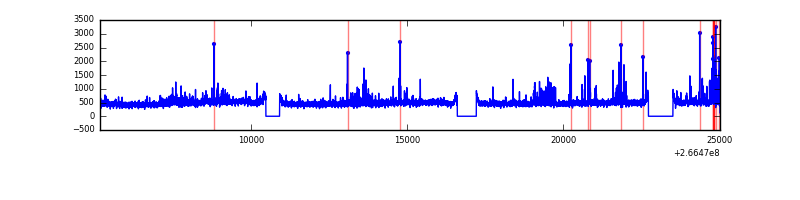 |
| C | 19854 | 18019 | 1 | 1 | 0.01% | 0.01% |  |
| D | 19854 | 18019 | 500 | 500 | 2.52% | 2.77% | 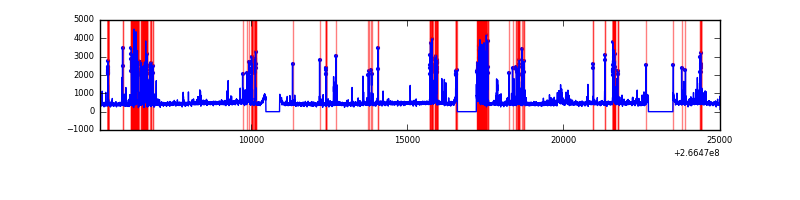 |
Top three noisy pixels from each quadrant. If the there are fewer than three noisy pixels in the level2.evt file, extra rows are filled as -1
| Pixel properties | Quadrant properties | ||||||
|---|---|---|---|---|---|---|---|
| Quadrant | DetID | PixID | Counts | Sigma | Mean | Median | Sigma |
| A | 0 | 23 | 288930 | 661.5 | 2149 | 2104 | 433.6 |
| A | 1 | 162 | 274089 | 627.27 | 2149 | 2104 | 433.6 |
| A | 1 | 178 | 127315 | 288.77 | 2149 | 2104 | 433.6 |
| B | 0 | 189 | 203902 | 489.83 | 2141 | 2083 | 412.0 |
| B | 0 | 229 | 149484 | 357.76 | 2141 | 2083 | 412.0 |
| B | 4 | 173 | 75746 | 178.79 | 2141 | 2083 | 412.0 |
| C | 3 | 233 | 5429439 | 11315.49 | 2067 | 2074 | 479.6 |
| C | 3 | 234 | 29353 | 56.87 | 2067 | 2074 | 479.6 |
| C | 13 | 61 | 14811 | 26.56 | 2067 | 2074 | 479.6 |
| D | 10 | 199 | 1964300 | 4057.89 | 2040 | 1987 | 483.6 |
| D | 12 | 110 | 185199 | 378.87 | 2040 | 1987 | 483.6 |
| D | 2 | 234 | 66170 | 132.72 | 2040 | 1987 | 483.6 |
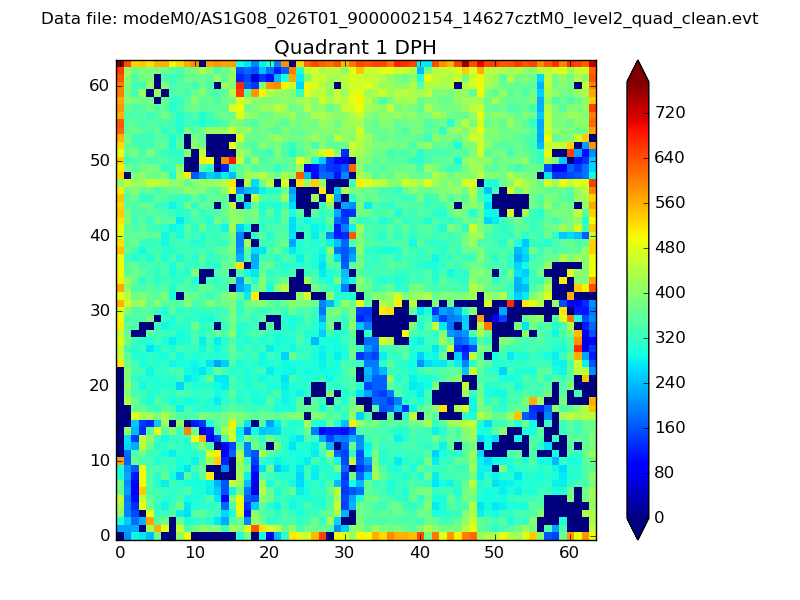
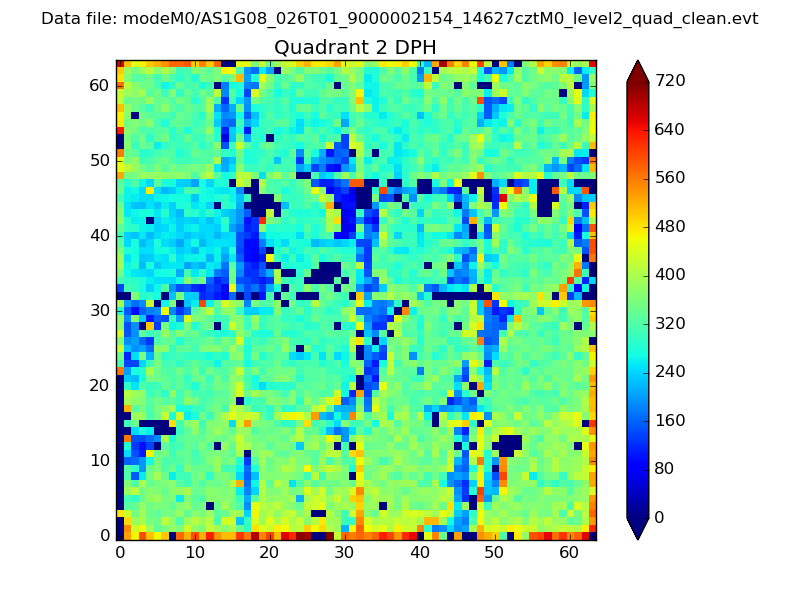
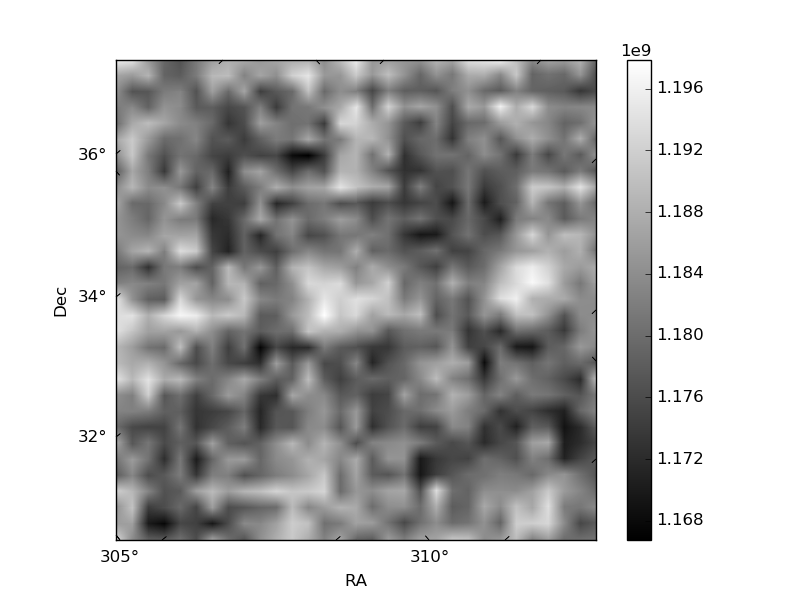
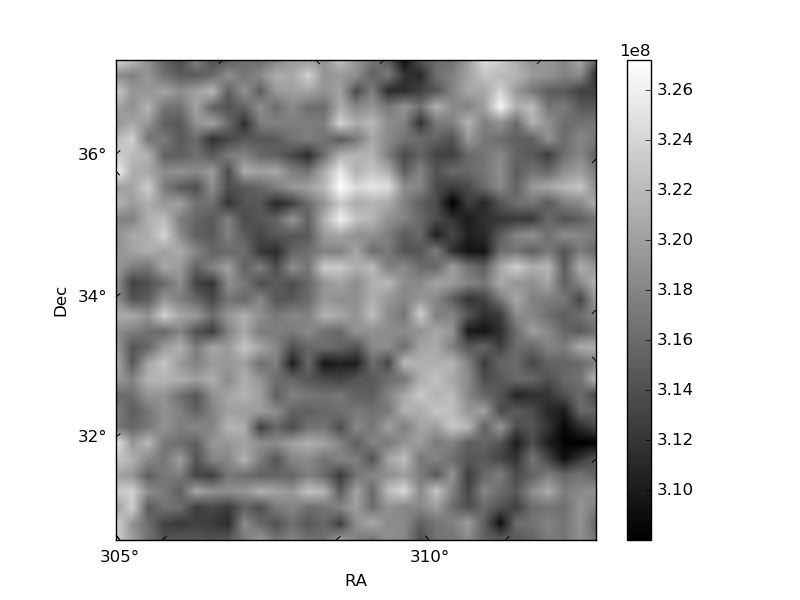
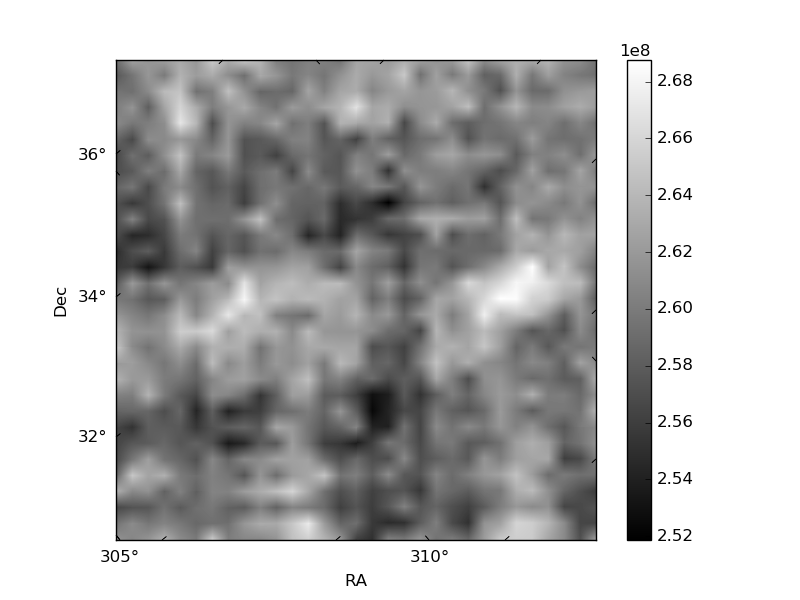
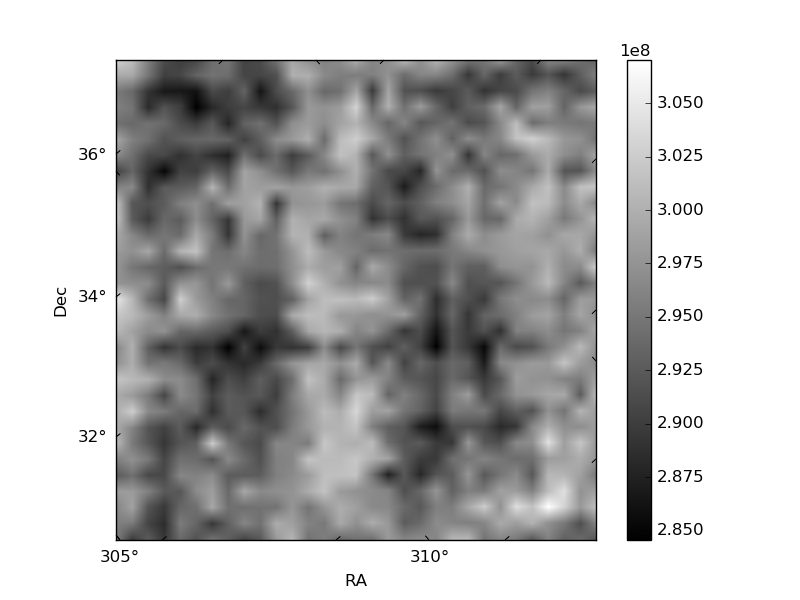
Histogram calculated using DETX and DETY for each event in the final _common_clean file
| Quadrant A | 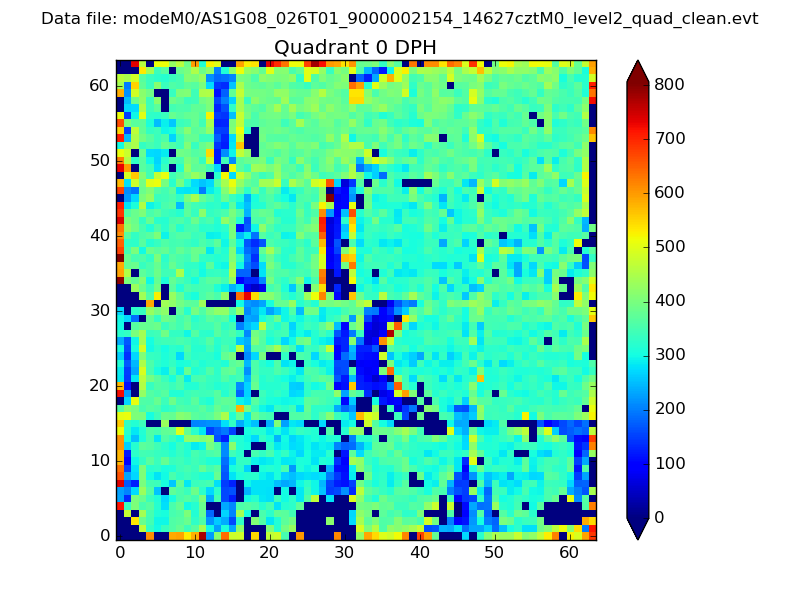 |
 |
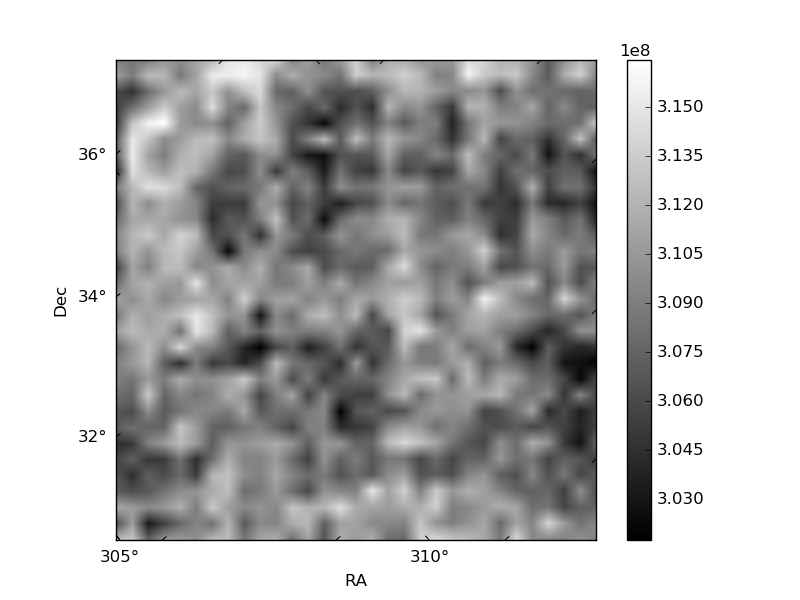
Quadrant B |
|---|---|---|---|
| Quadrant D | 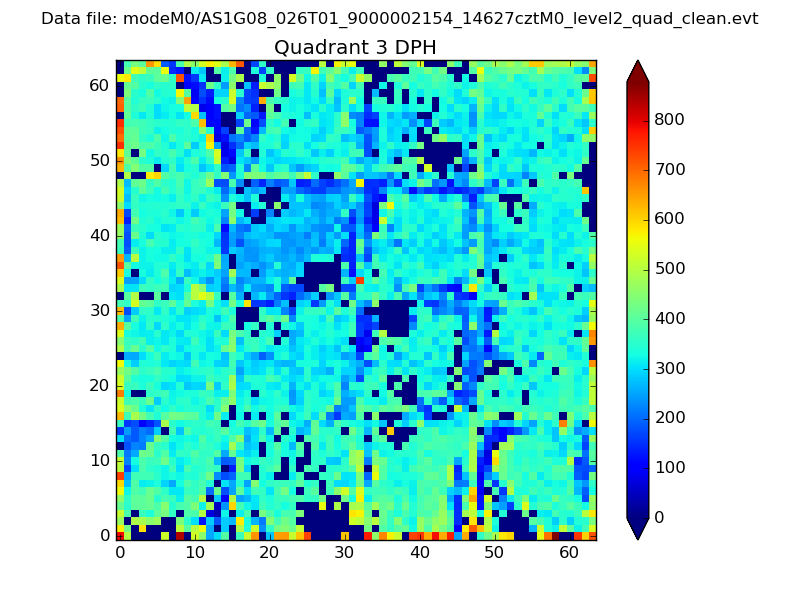 |
 |
Quadrant C |
| Plot type | Count rate plots | Images |
|---|---|---|
| Comparison with Poisson distribution Blue bars denote a histogram of data divided into 1 sec bins. Red curve is a Poisson curve with rate = median count rate of data. |
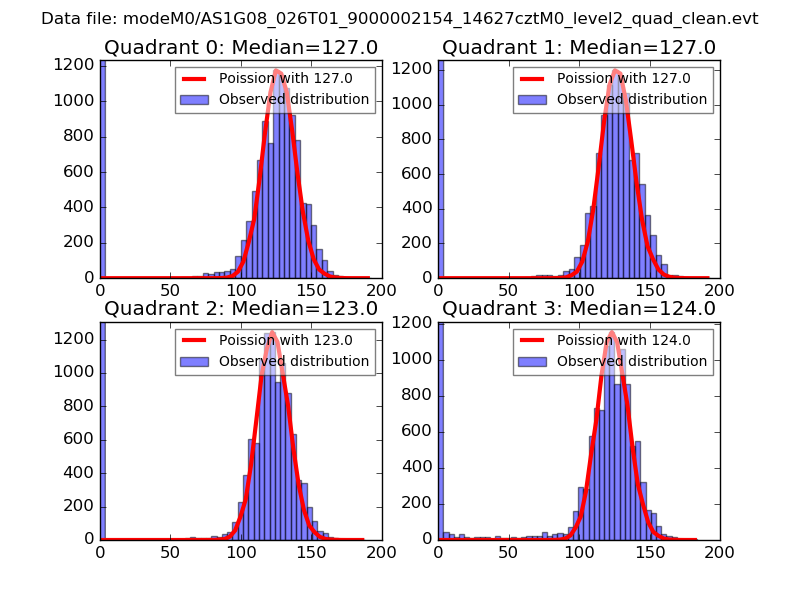 |
 |
| Quadrant-wise count rates Data is divided into 100 sec bins |
 |
|
| Module-wise count rates for Quadrant A Data is divided into 100 sec bins |
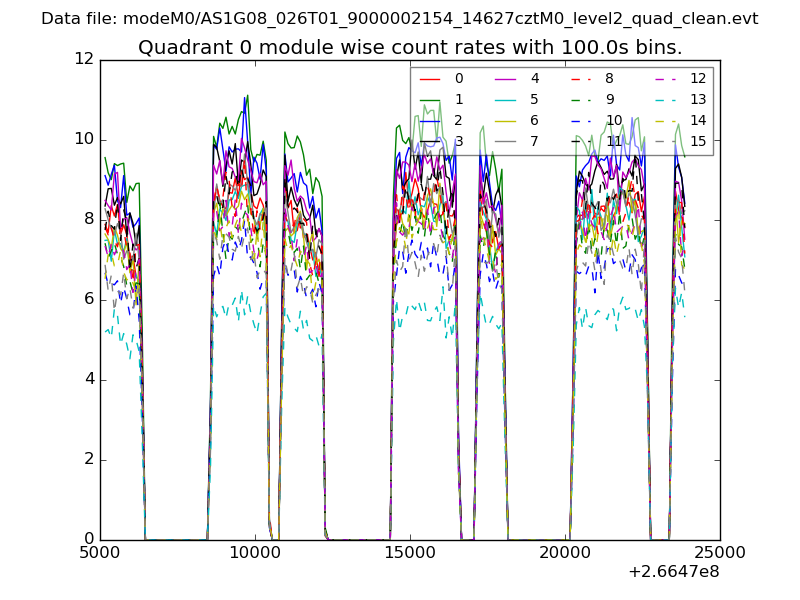 |
 |
| Module-wise count rates for Quadrant B Data is divided into 100 sec bins |
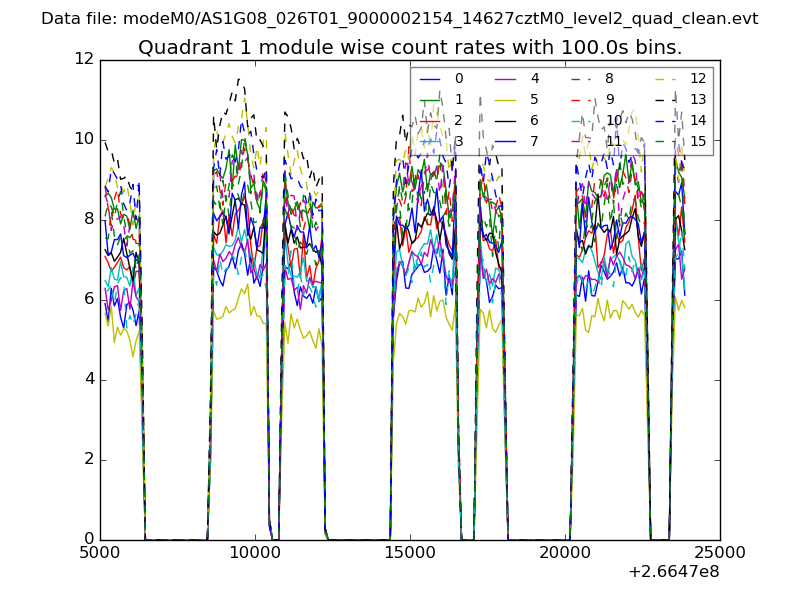 |
 |
| Module-wise count rates for Quadrant C Data is divided into 100 sec bins |
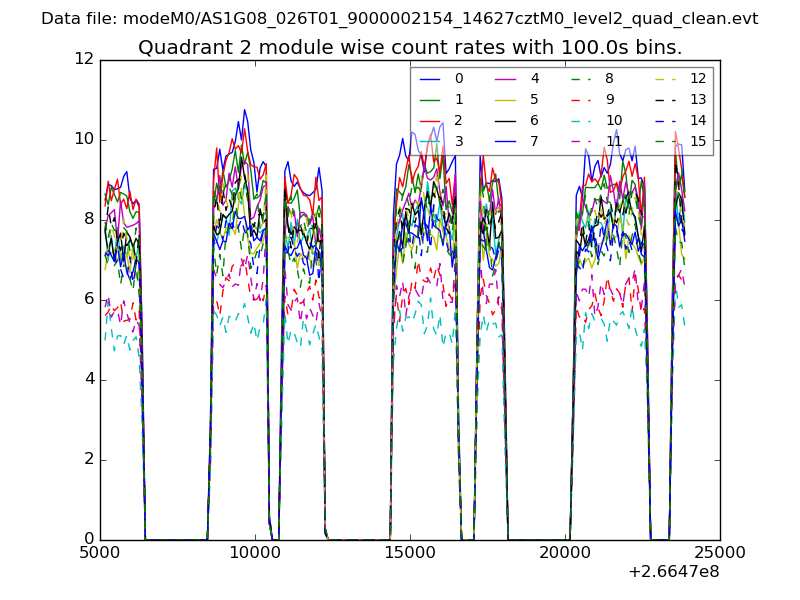 |
 |
| Module-wise count rates for Quadrant D Data is divided into 100 sec bins |
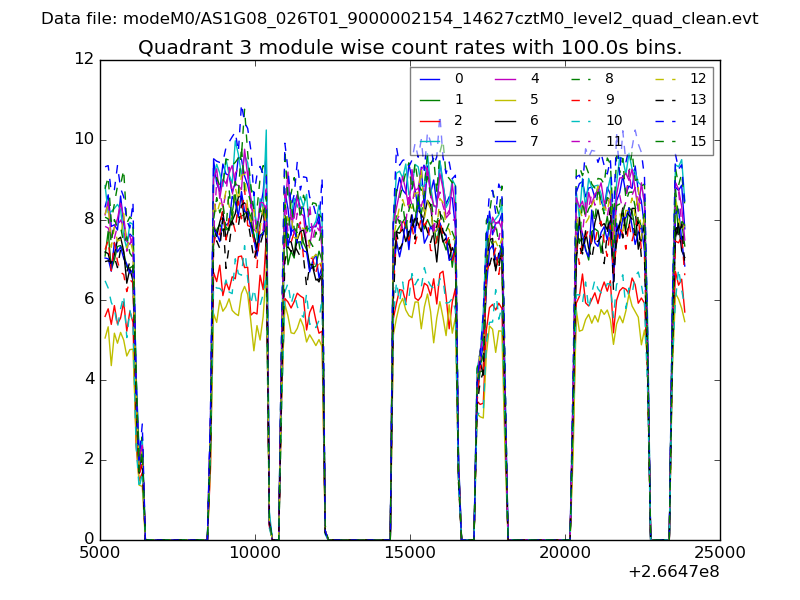 |
 |
| Parameter | Plot |
|---|---|
| CZT HV Monitor | 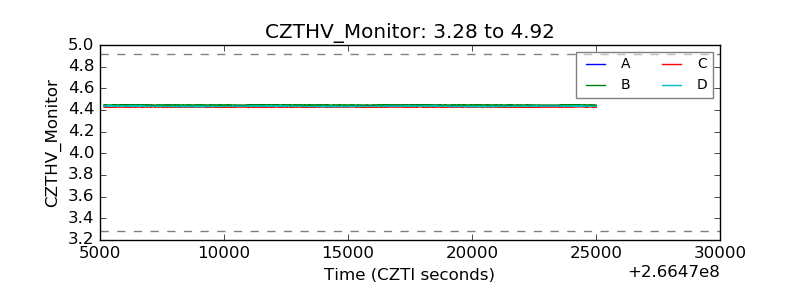 |
| D_VDD | 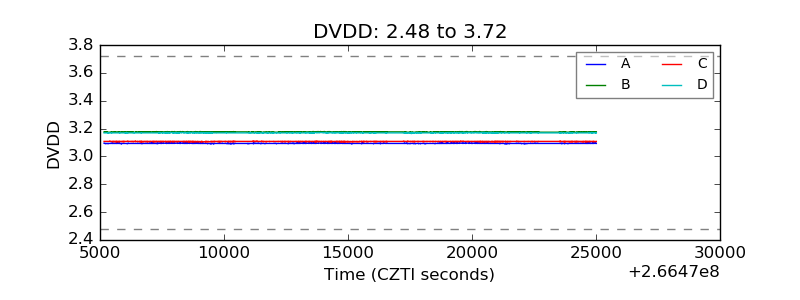 |
| Temperature 1 | 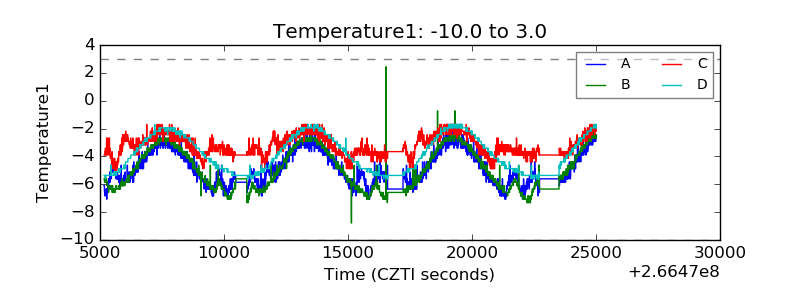 |
| Veto HV Monitor | 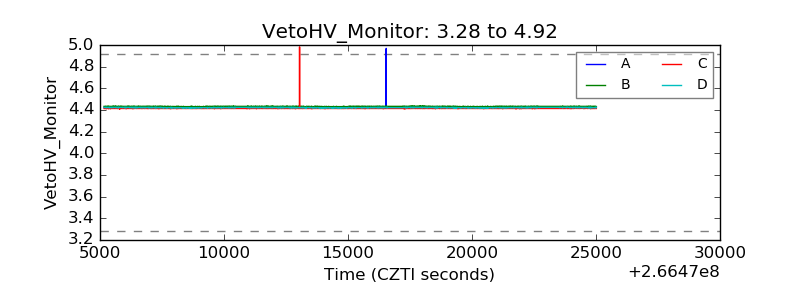 |
| Veto LLD |  |
| Alpha Counter | 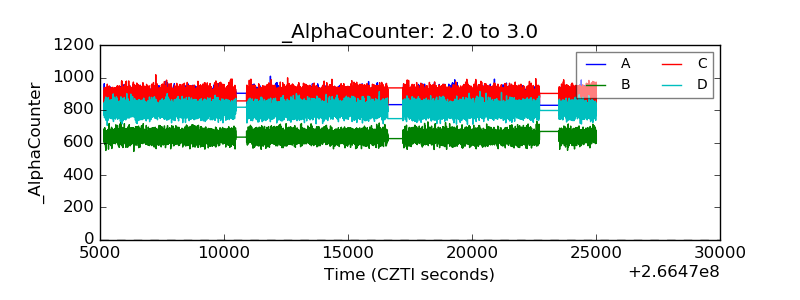 |
| _CPM_Rate | 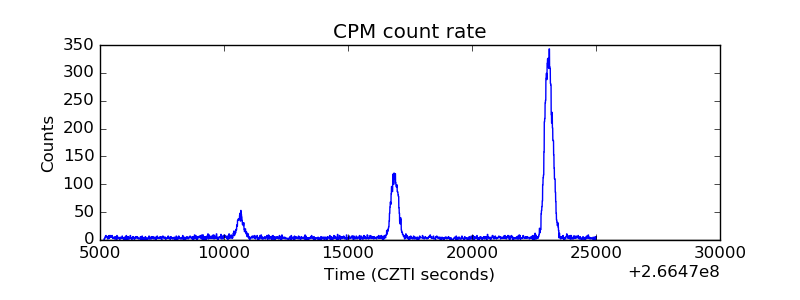 |
| CZT Counter | 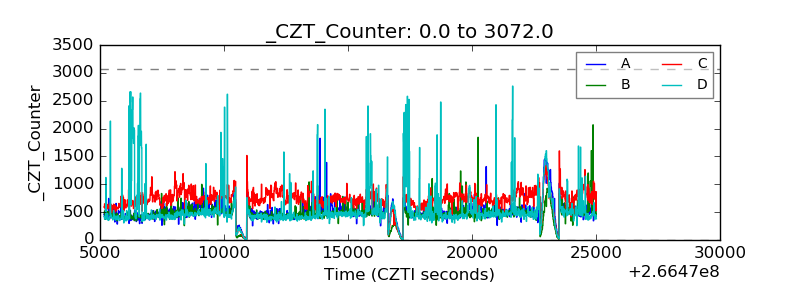 |
| +2.5 Volts monitor |  |
| +5 Volts monitor |  |
| _ROLL_ROT | 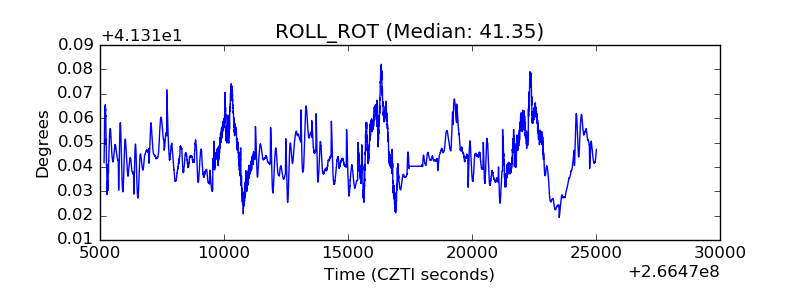 |
| _Roll_DEC | 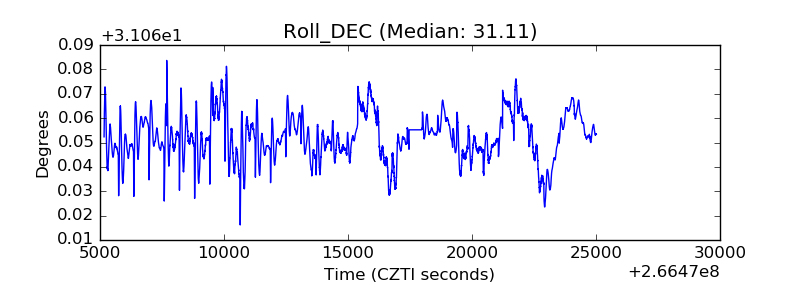 |
| _Roll_RA | 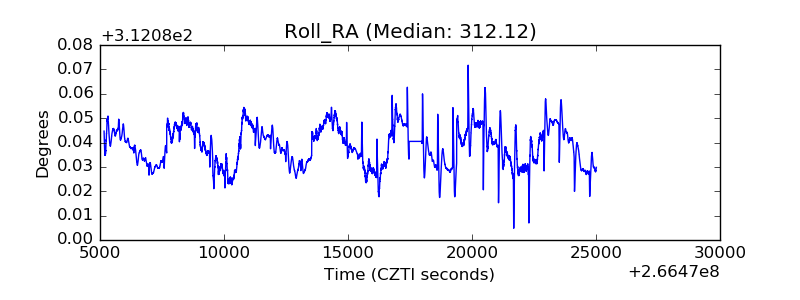 |
| Veto Counter | 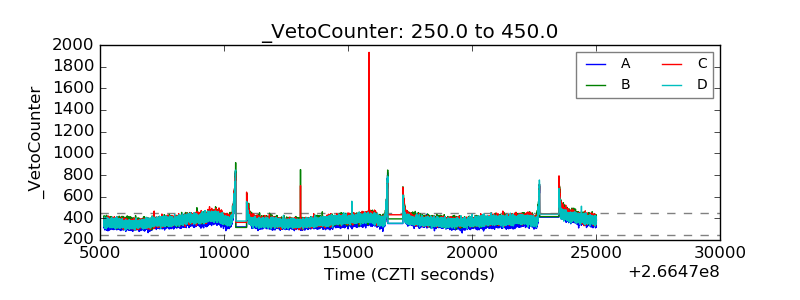 |