| Param | Original file | Final file |
|---|---|---|
| Filename | modeM0/AS1G08_026T01_9000002154_14628cztM0_level2.evt | modeM0/AS1G08_026T01_9000002154_14628cztM0_level2_quad_clean.evt |
| Size (bytes) | 561,634,560 | 64,964,160 |
| Size | 535.6 MB | 62.0 MB |
| Events in quadrant A | 3,661,698 | 385,294 |
| Events in quadrant B | 3,761,373 | 381,346 |
| Events in quadrant C | 5,719,976 | 366,127 |
| Events in quadrant D | 3,419,231 | 373,751 |
| Mode SS | |||
|---|---|---|---|
| Quadrant | BADHDUFLAG | Total packets | Discarded packets |
| A | 0 | 134 | 0 |
| B | 0 | 134 | 0 |
| C | 0 | 134 | 0 |
| D | 0 | 134 | 0 |
| Mode M0 | |||
|---|---|---|---|
| Quadrant | BADHDUFLAG | Total packets | Discarded packets |
| A | 0 | 14932 | 2 |
| B | 0 | 15196 | 1 |
| C | 0 | 21717 | 1 |
| D | 0 | 14549 | 1 |
| Mode M9 | |||
|---|---|---|---|
| Quadrant | BADHDUFLAG | Total packets | Discarded packets |
| A | 0 | 9 | 0 |
| B | 0 | 9 | 0 |
| C | 0 | 9 | 0 |
| D | 0 | 9 | 0 |
| Quadrant | Total seconds | Saturated seconds | Saturation percentage |
|---|---|---|---|
| A | 6602 | 95 | 1.438958% |
| B | 6602 | 160 | 2.423508% |
| C | 6602 | 113 | 1.711603% |
| D | 6602 | 125 | 1.893366% |
Noise dominated data is calculated using 1-second bins in cleaned event files. If a bin has >2000 counts, and if more than 50% of those come from <1% of pixels, then it is considered to be noise-dominated and hence unusable.
| Quadrant | # 1 sec bins | Bins with >0 counts | Bins with >2000 counts | High rate bins dominated by noise | Noise dominated (total time) | Noise dominated (detector-on time) | Marked lightcurve |
|---|---|---|---|---|---|---|---|
| A | 7508 | 6603 | 0 | 0 | 0.00% | 0.00% | 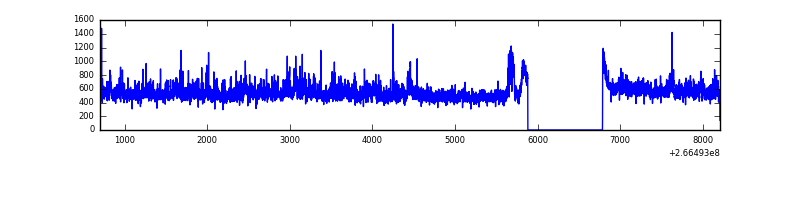 |
| B | 7508 | 6603 | 28 | 28 | 0.37% | 0.42% | 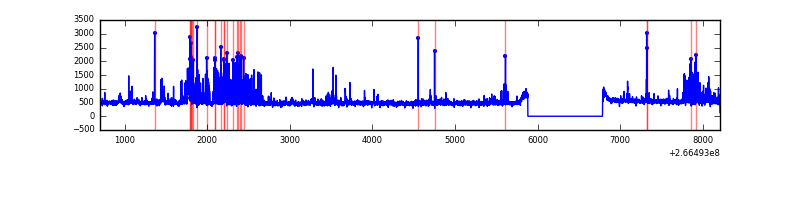 |
| C | 7508 | 6603 | 1 | 1 | 0.01% | 0.02% | 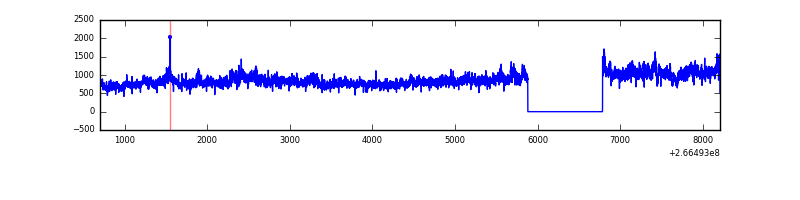 |
| D | 7508 | 6603 | 54 | 54 | 0.72% | 0.82% | 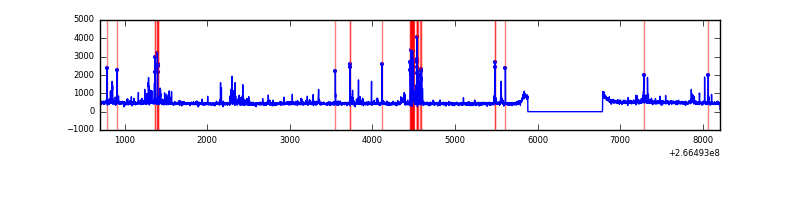 |
Top three noisy pixels from each quadrant. If the there are fewer than three noisy pixels in the level2.evt file, extra rows are filled as -1
| Pixel properties | Quadrant properties | ||||||
|---|---|---|---|---|---|---|---|
| Quadrant | DetID | PixID | Counts | Sigma | Mean | Median | Sigma |
| A | 0 | 23 | 154896 | 916.83 | 820 | 803 | 168.1 |
| A | 1 | 162 | 134506 | 795.52 | 820 | 803 | 168.1 |
| A | 1 | 178 | 63436 | 372.66 | 820 | 803 | 168.1 |
| B | 0 | 189 | 365340 | 2329.05 | 810 | 791 | 156.5 |
| B | 0 | 229 | 96704 | 612.77 | 810 | 791 | 156.5 |
| B | 4 | 173 | 54728 | 344.6 | 810 | 791 | 156.5 |
| C | 3 | 233 | 2666752 | 14744.4 | 778 | 781 | 180.8 |
| C | 3 | 234 | 12259 | 63.48 | 778 | 781 | 180.8 |
| C | 13 | 61 | 5563 | 26.45 | 778 | 781 | 180.8 |
| D | 10 | 199 | 258186 | 1367.34 | 789 | 771 | 188.3 |
| D | 12 | 110 | 76220 | 400.77 | 789 | 771 | 188.3 |
| D | 13 | 122 | 23596 | 121.24 | 789 | 771 | 188.3 |
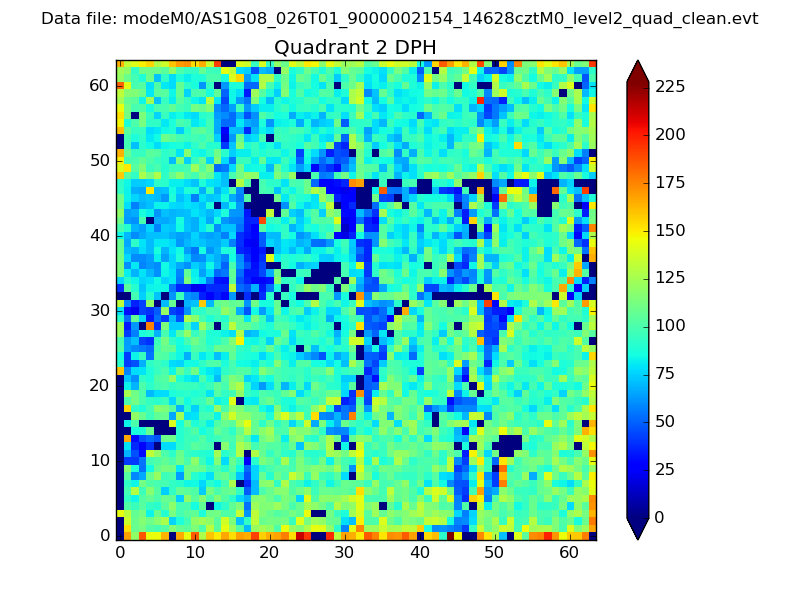
Histogram calculated using DETX and DETY for each event in the final _common_clean file
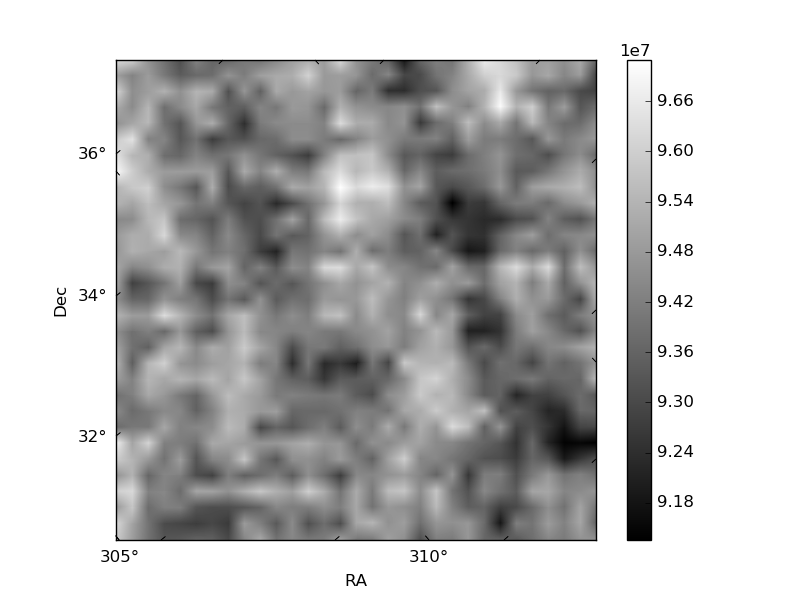
| Quadrant A | 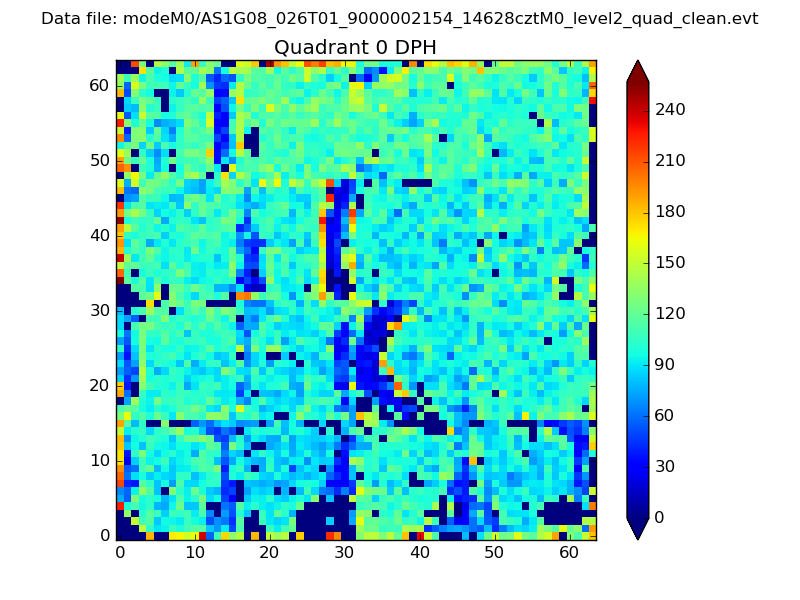 |
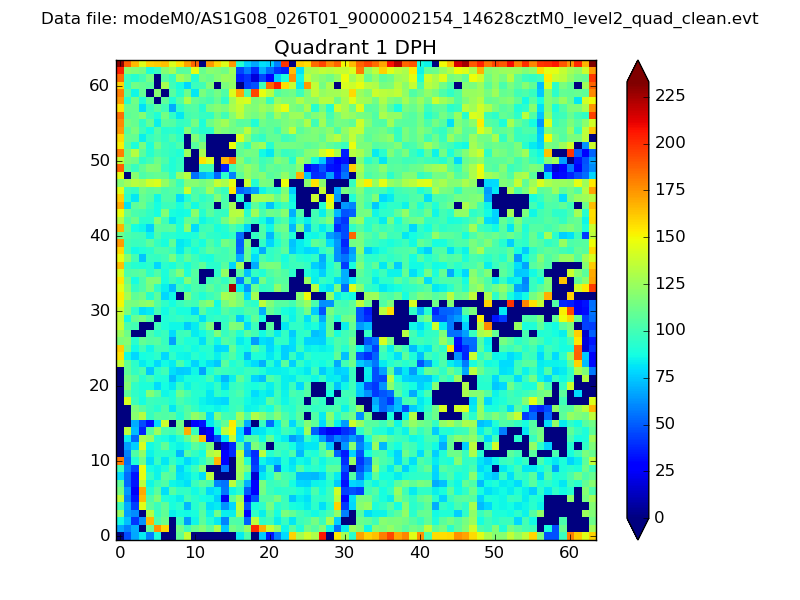 |
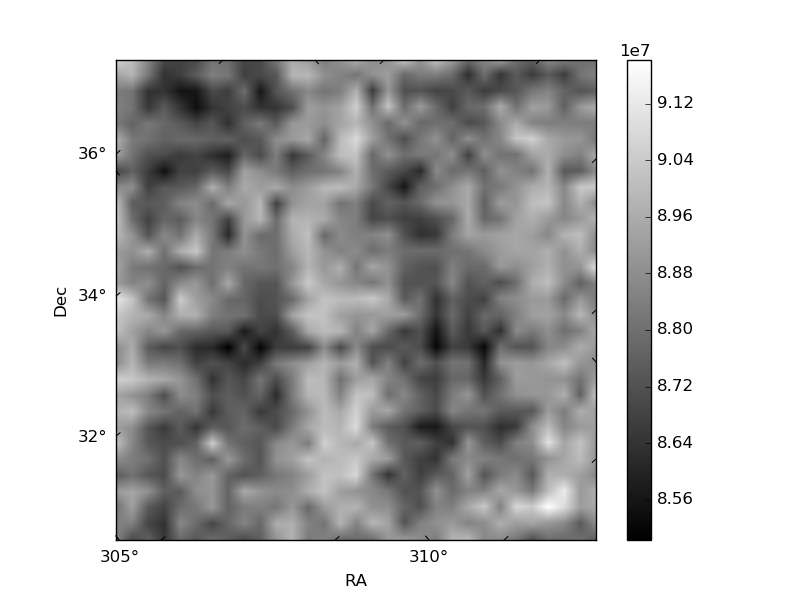
Quadrant B |
|---|---|---|---|
| Quadrant D | 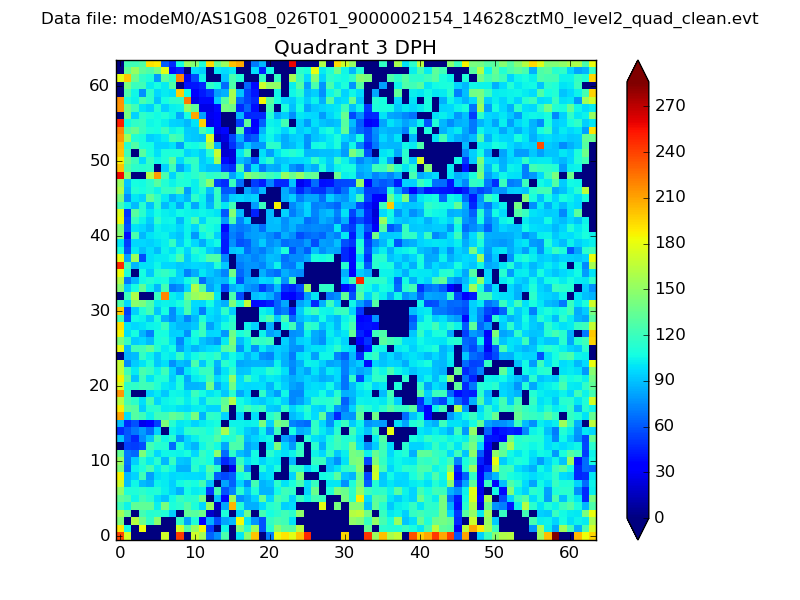 |
 |
Quadrant C |
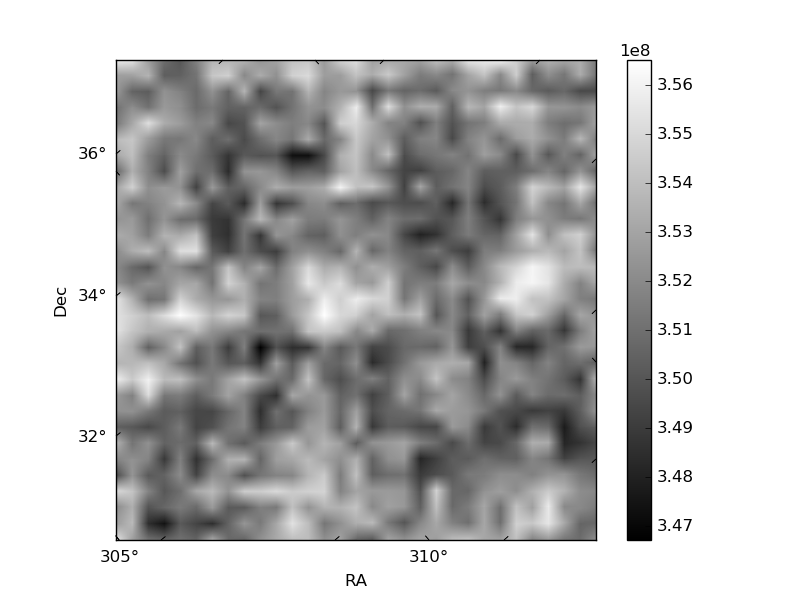
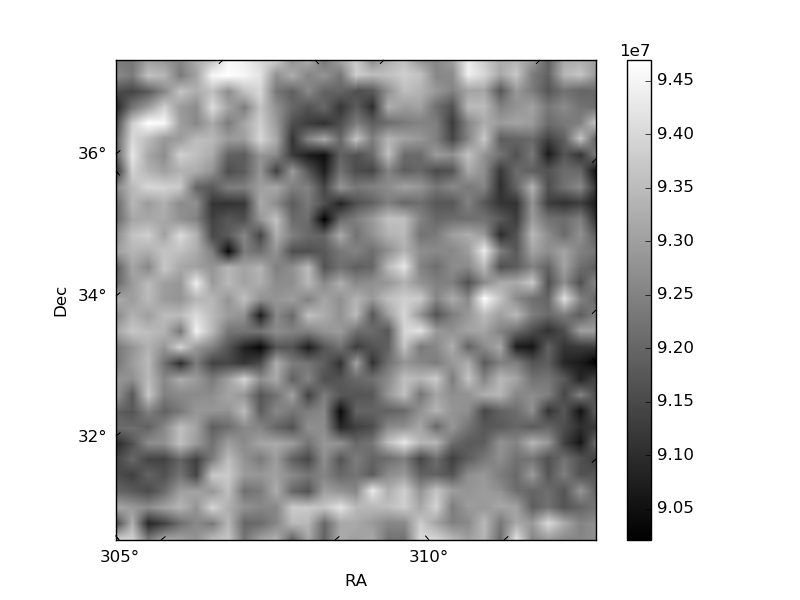
| Plot type | Count rate plots | Images |
|---|---|---|
| Comparison with Poisson distribution Blue bars denote a histogram of data divided into 1 sec bins. Red curve is a Poisson curve with rate = median count rate of data. |
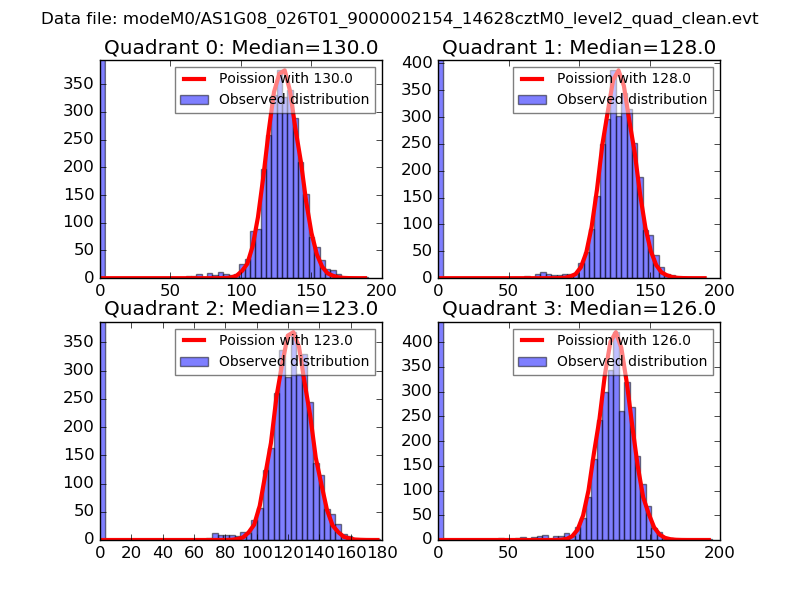 |
 |
| Quadrant-wise count rates Data is divided into 100 sec bins |
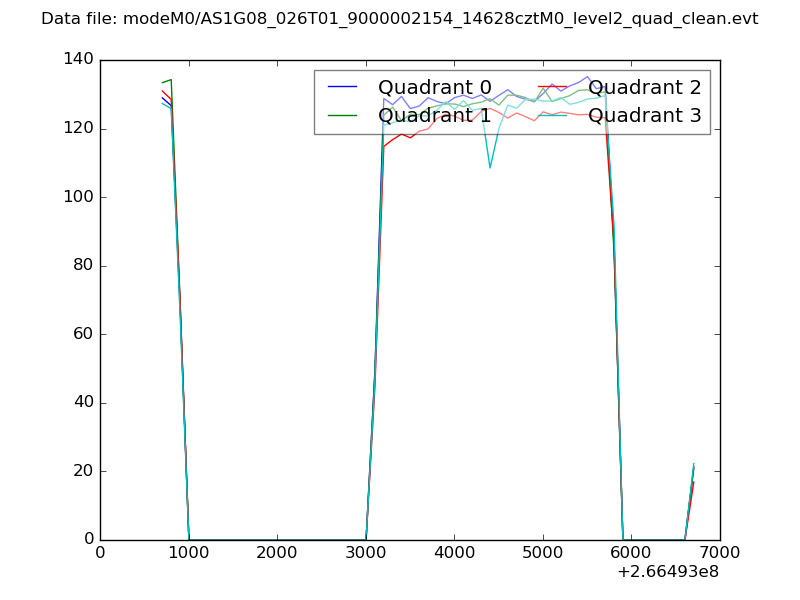 |
|
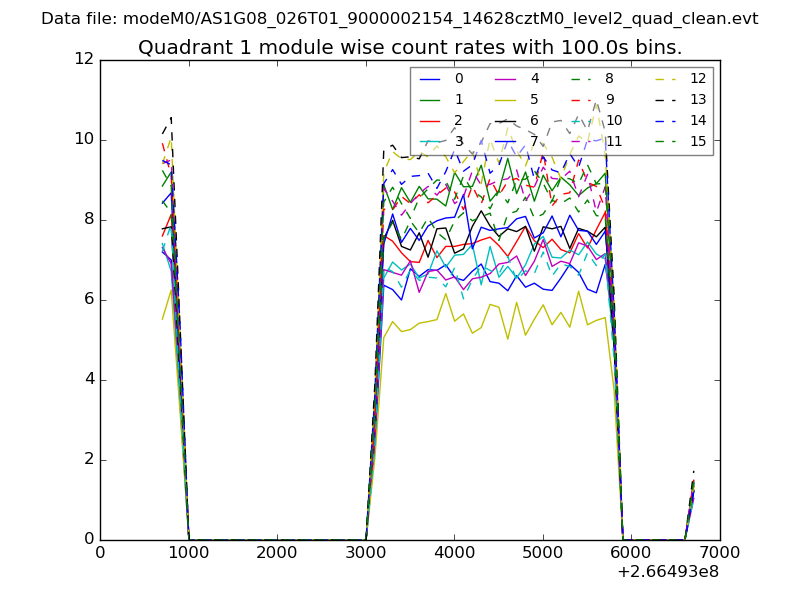
| Module-wise count rates for Quadrant A Data is divided into 100 sec bins |
 |
 |
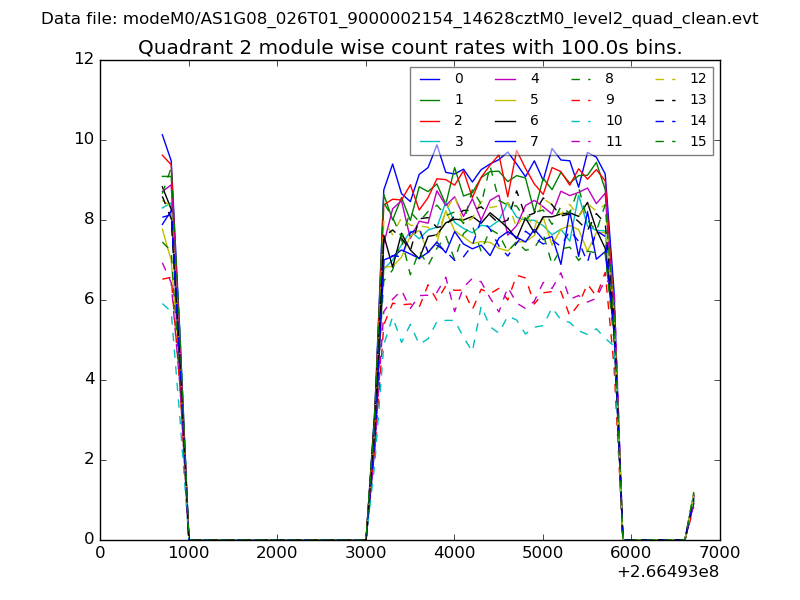
| Module-wise count rates for Quadrant B Data is divided into 100 sec bins |
 |
 |
| Module-wise count rates for Quadrant C Data is divided into 100 sec bins |
 |
 |
| Module-wise count rates for Quadrant D Data is divided into 100 sec bins |
 |
 |
| Parameter | Plot |
|---|---|
| CZT HV Monitor | 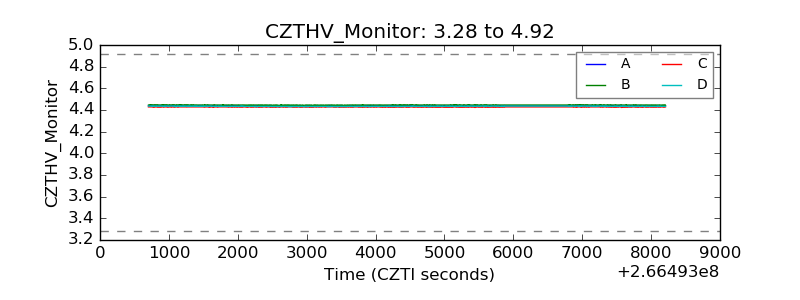 |
| D_VDD | 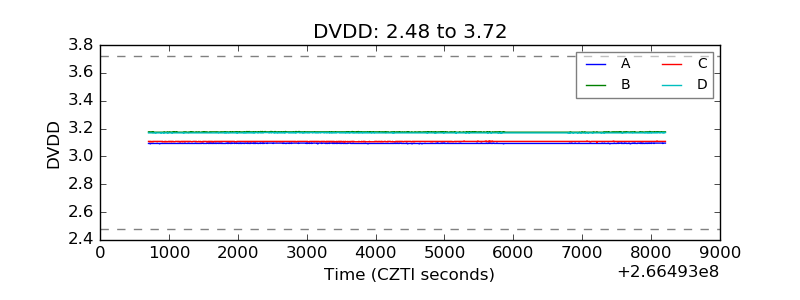 |
| Temperature 1 |  |
| Veto HV Monitor | 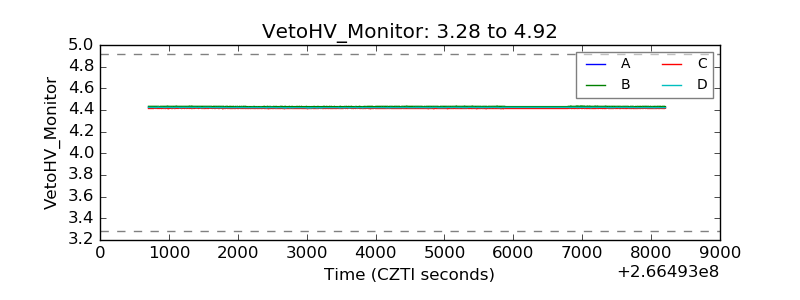 |
| Veto LLD | 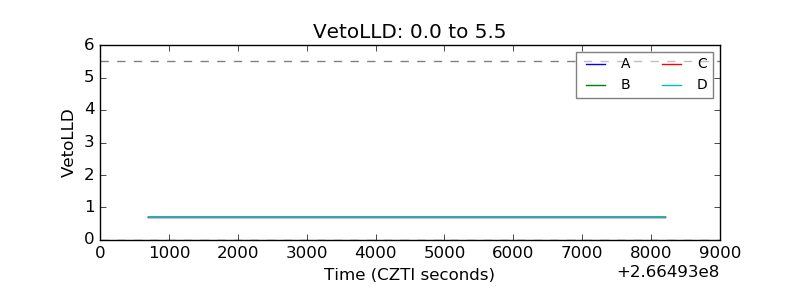 |
| Alpha Counter | 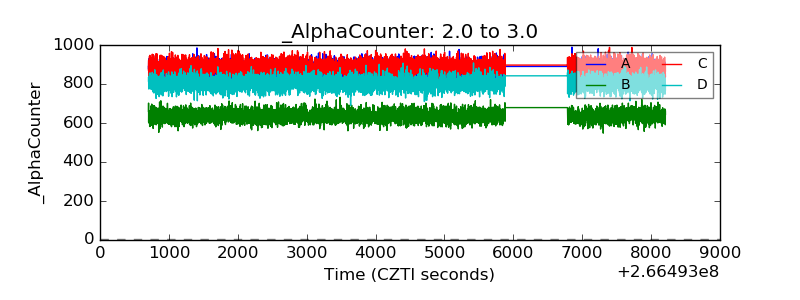 |
| _CPM_Rate | 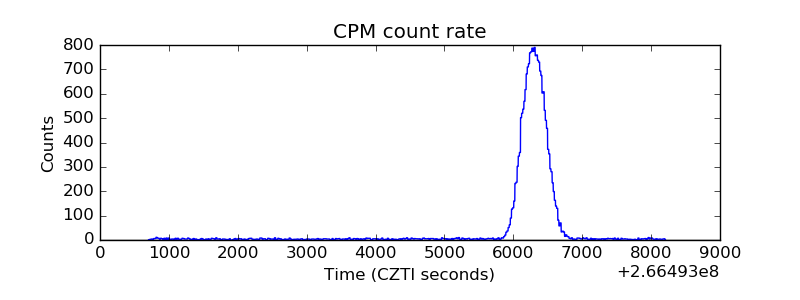 |
| CZT Counter | 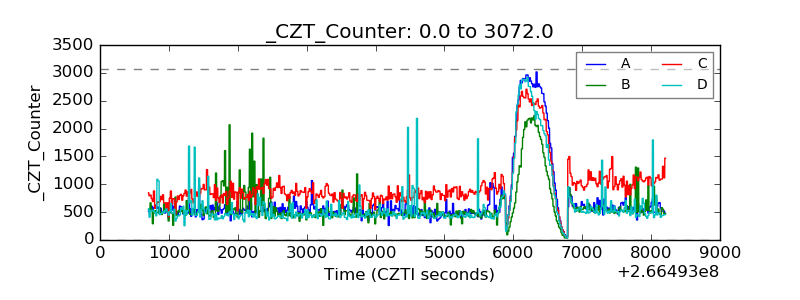 |
| +2.5 Volts monitor |  |
| +5 Volts monitor |  |
| _ROLL_ROT | 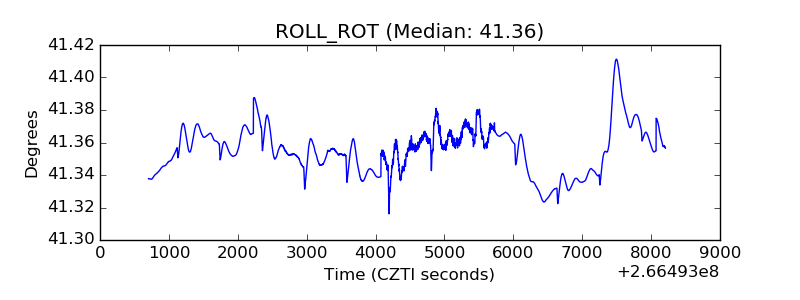 |
| _Roll_DEC | 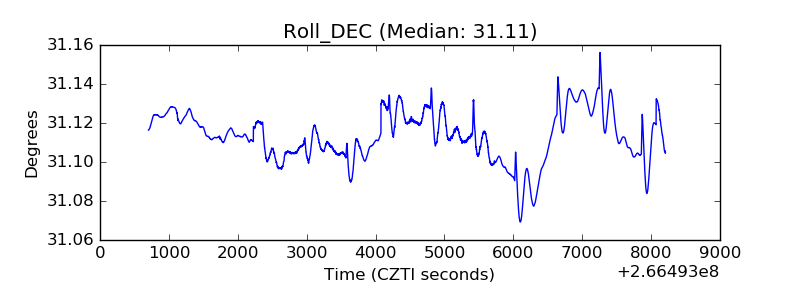 |
| _Roll_RA | 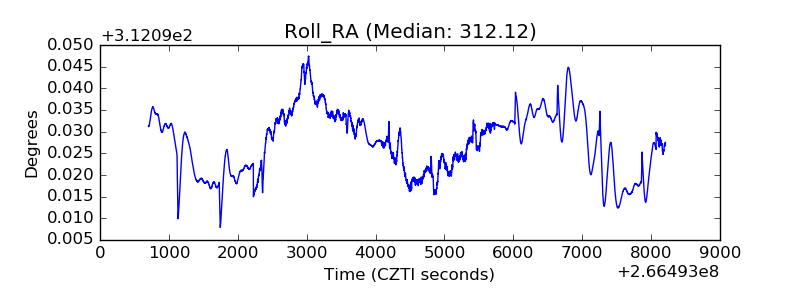 |
| Veto Counter | 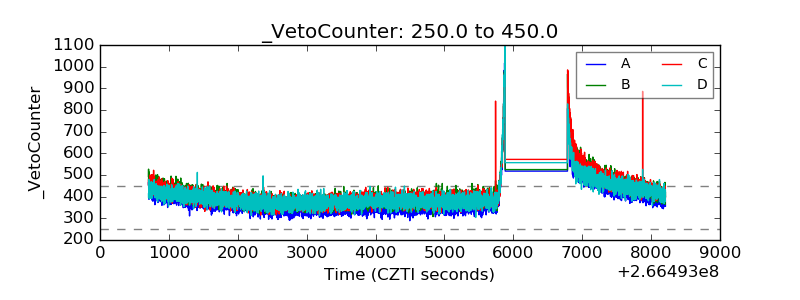 |