| Param | Original file | Final file |
|---|---|---|
| Filename | modeM0/AS1G08_026T01_9000002154_14629cztM0_level2.evt | modeM0/AS1G08_026T01_9000002154_14629cztM0_level2_quad_clean.evt |
| Size (bytes) | 589,510,080 | 66,052,800 |
| Size | 562.2 MB | 63.0 MB |
| Events in quadrant A | 3,618,354 | 396,061 |
| Events in quadrant B | 3,540,377 | 389,517 |
| Events in quadrant C | 6,940,018 | 369,213 |
| Events in quadrant D | 3,308,784 | 385,155 |
| Mode SS | |||
|---|---|---|---|
| Quadrant | BADHDUFLAG | Total packets | Discarded packets |
| A | 0 | 136 | 0 |
| B | 0 | 136 | 0 |
| C | 0 | 136 | 0 |
| D | 0 | 136 | 0 |
| Mode M0 | |||
|---|---|---|---|
| Quadrant | BADHDUFLAG | Total packets | Discarded packets |
| A | 0 | 15022 | 3 |
| B | 0 | 14658 | 2 |
| C | 0 | 25473 | 2 |
| D | 0 | 14164 | 2 |
| Mode M9 | |||
|---|---|---|---|
| Quadrant | BADHDUFLAG | Total packets | Discarded packets |
| A | 0 | 17 | 0 |
| B | 0 | 17 | 0 |
| C | 0 | 17 | 0 |
| D | 0 | 18 | 0 |
| Quadrant | Total seconds | Saturated seconds | Saturation percentage |
|---|---|---|---|
| A | 6587 | 86 | 1.305602% |
| B | 6587 | 100 | 1.518142% |
| C | 6587 | 154 | 2.337938% |
| D | 6587 | 76 | 1.153788% |
Noise dominated data is calculated using 1-second bins in cleaned event files. If a bin has >2000 counts, and if more than 50% of those come from <1% of pixels, then it is considered to be noise-dominated and hence unusable.
| Quadrant | # 1 sec bins | Bins with >0 counts | Bins with >2000 counts | High rate bins dominated by noise | Noise dominated (total time) | Noise dominated (detector-on time) | Marked lightcurve |
|---|---|---|---|---|---|---|---|
| A | 7663 | 6588 | 1 | 1 | 0.01% | 0.02% | 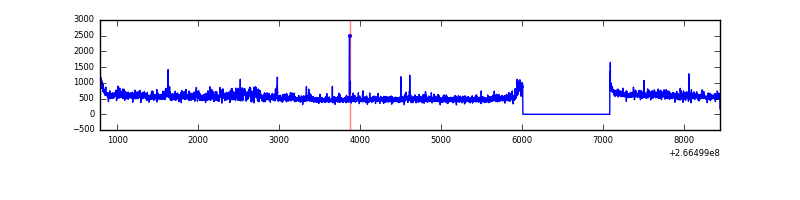 |
| B | 7663 | 6588 | 9 | 9 | 0.12% | 0.14% | 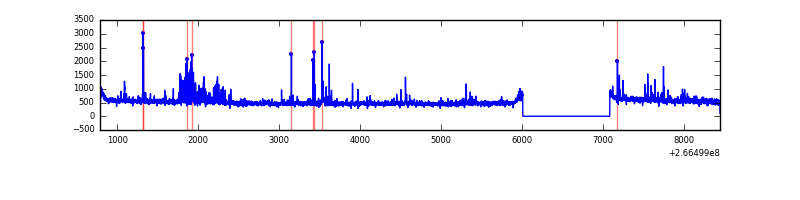 |
| C | 7663 | 6588 | 2 | 2 | 0.03% | 0.03% | 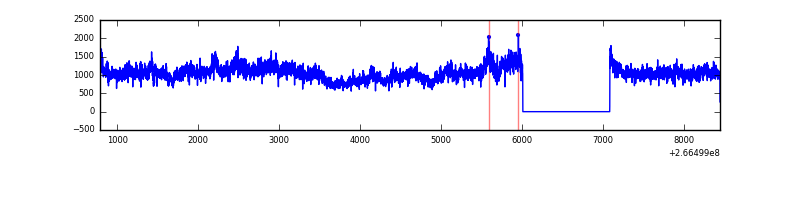 |
| D | 7663 | 6588 | 12 | 12 | 0.16% | 0.18% | 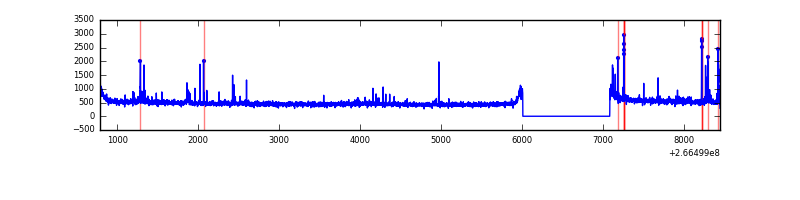 |
Top three noisy pixels from each quadrant. If the there are fewer than three noisy pixels in the level2.evt file, extra rows are filled as -1
| Pixel properties | Quadrant properties | ||||||
|---|---|---|---|---|---|---|---|
| Quadrant | DetID | PixID | Counts | Sigma | Mean | Median | Sigma |
| A | 0 | 23 | 102857 | 593.85 | 850 | 830 | 171.8 |
| A | 1 | 162 | 99210 | 572.62 | 850 | 830 | 171.8 |
| A | 1 | 178 | 42232 | 240.98 | 850 | 830 | 171.8 |
| B | 0 | 189 | 155422 | 957.84 | 841 | 821 | 161.4 |
| B | 4 | 173 | 32788 | 198.05 | 841 | 821 | 161.4 |
| B | 12 | 111 | 18837 | 111.62 | 841 | 821 | 161.4 |
| C | 3 | 233 | 3767525 | 20183.06 | 807 | 812 | 186.6 |
| C | 3 | 234 | 17705 | 90.52 | 807 | 812 | 186.6 |
| C | 3 | 232 | 6710 | 31.6 | 807 | 812 | 186.6 |
| D | 10 | 199 | 59240 | 297.47 | 823 | 803 | 196.4 |
| D | 2 | 152 | 34659 | 172.34 | 823 | 803 | 196.4 |
| D | 10 | 70 | 33349 | 165.67 | 823 | 803 | 196.4 |
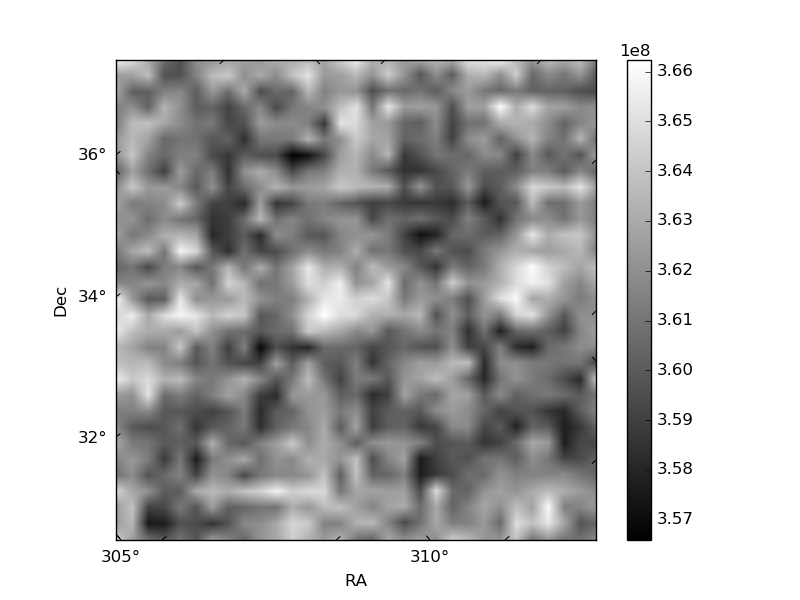
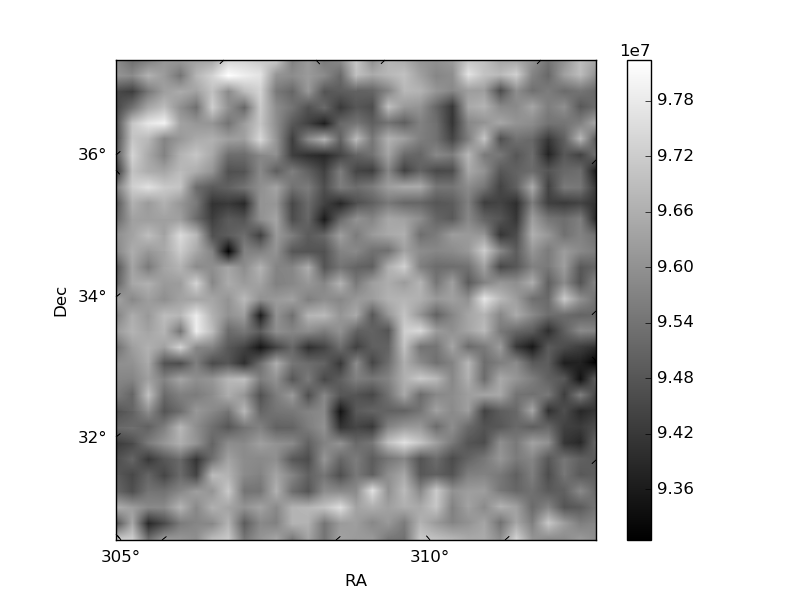
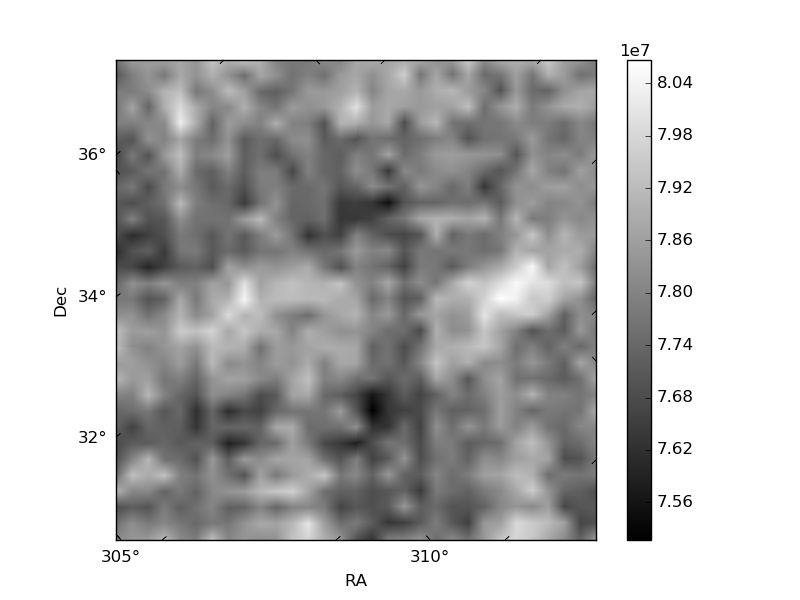
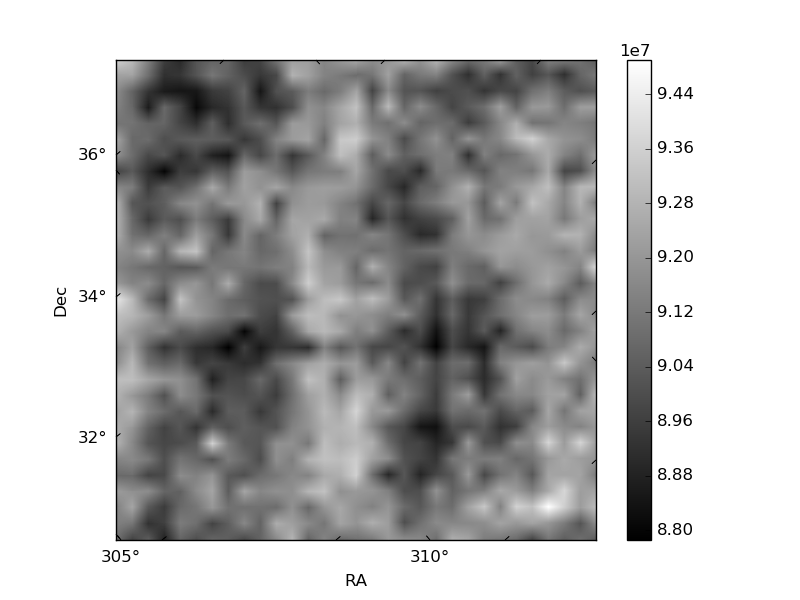
Histogram calculated using DETX and DETY for each event in the final _common_clean file
| Quadrant A | 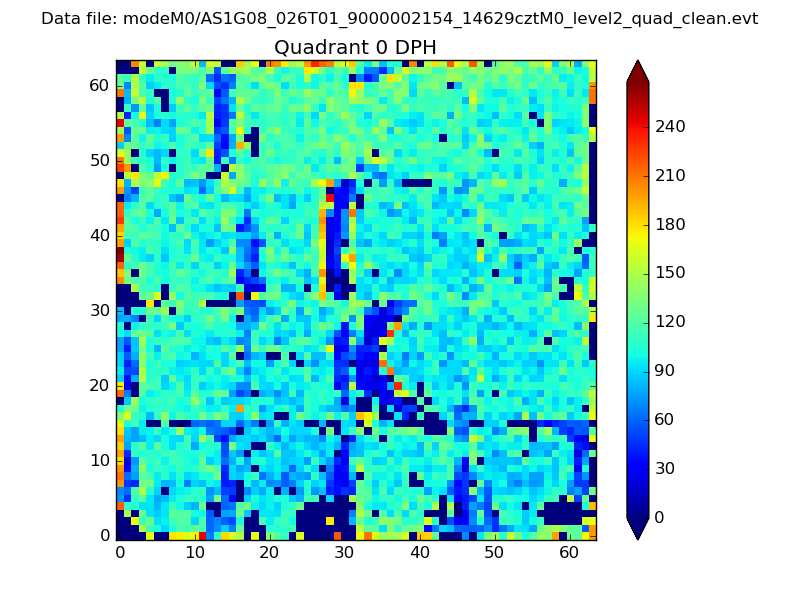 |
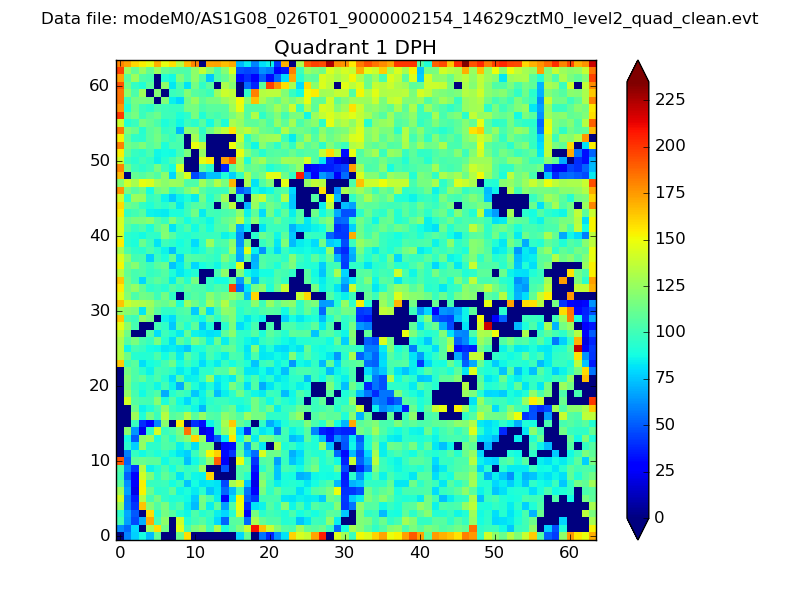 |
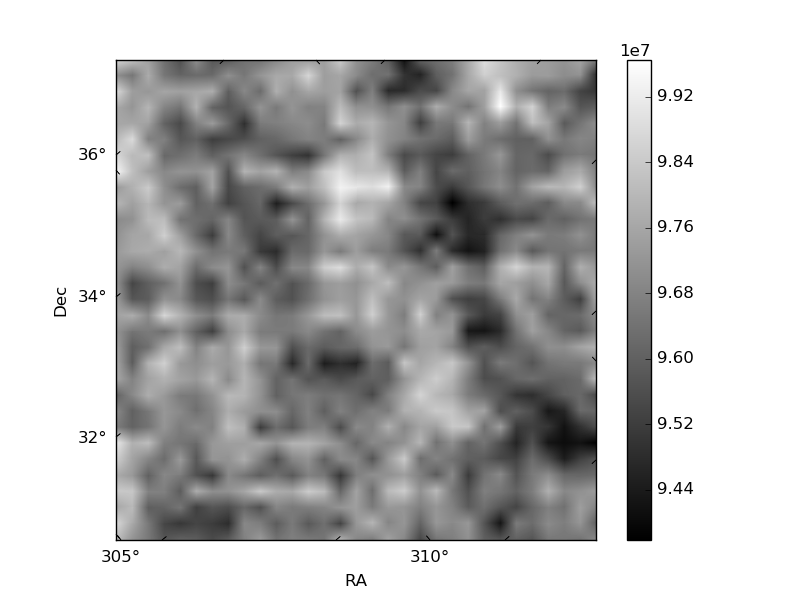
Quadrant B |
|---|---|---|---|
| Quadrant D | 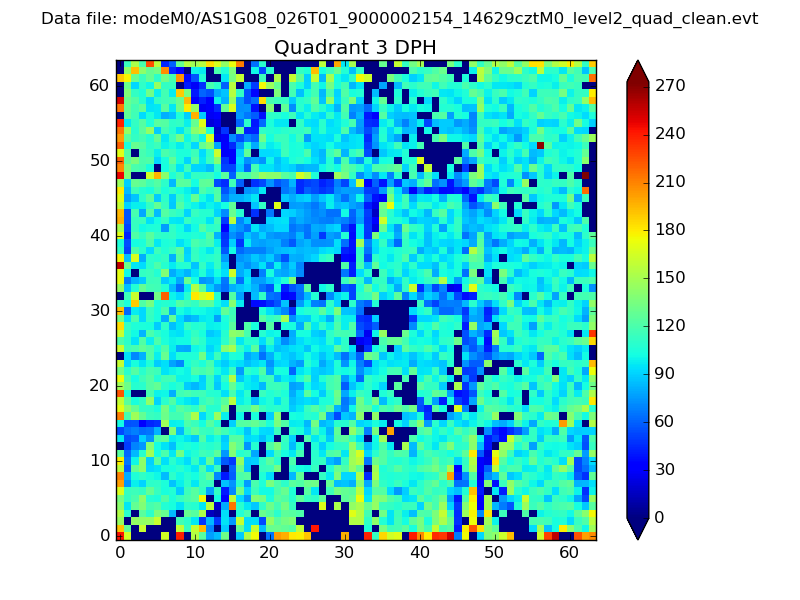 |
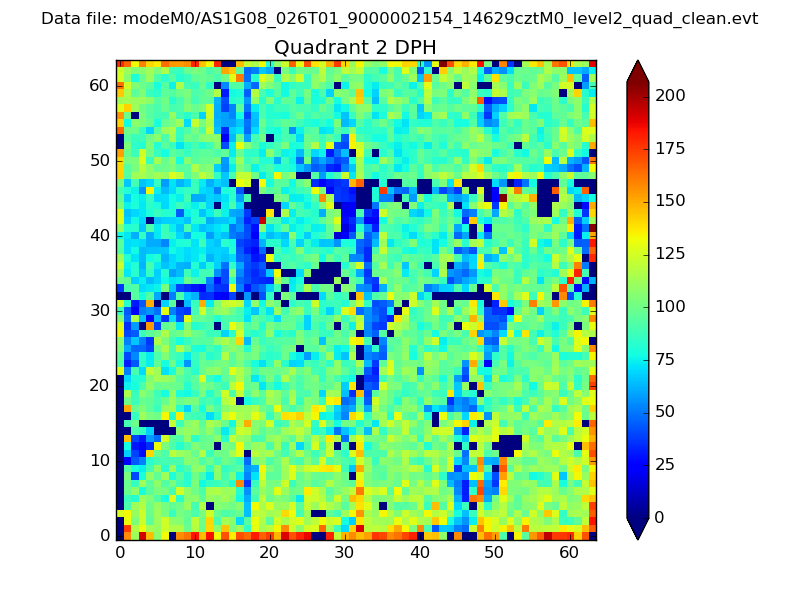 |
Quadrant C |
| Plot type | Count rate plots | Images |
|---|---|---|
| Comparison with Poisson distribution Blue bars denote a histogram of data divided into 1 sec bins. Red curve is a Poisson curve with rate = median count rate of data. |
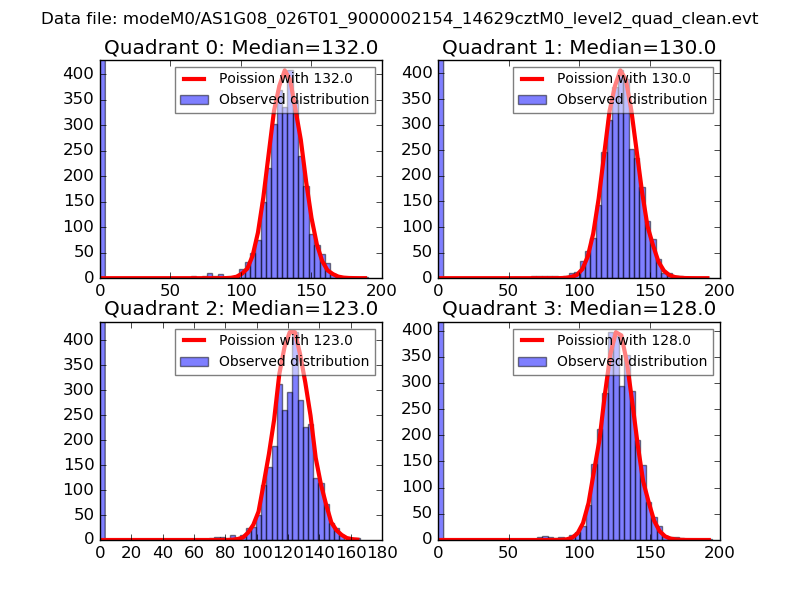 |
 |
| Quadrant-wise count rates Data is divided into 100 sec bins |
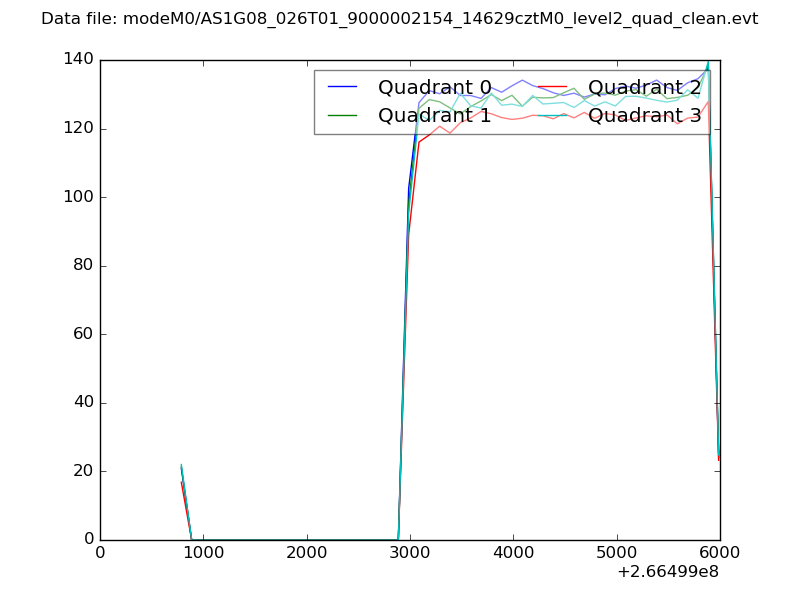 |
|
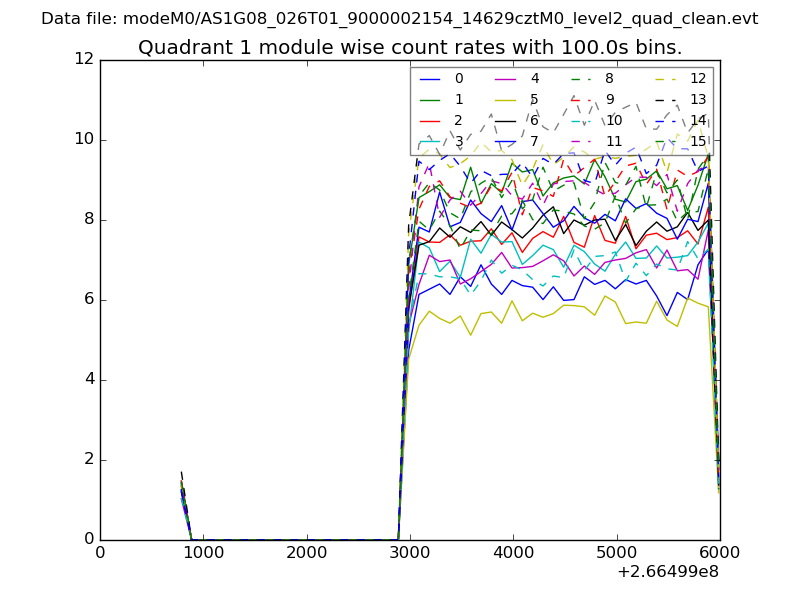
| Module-wise count rates for Quadrant A Data is divided into 100 sec bins |
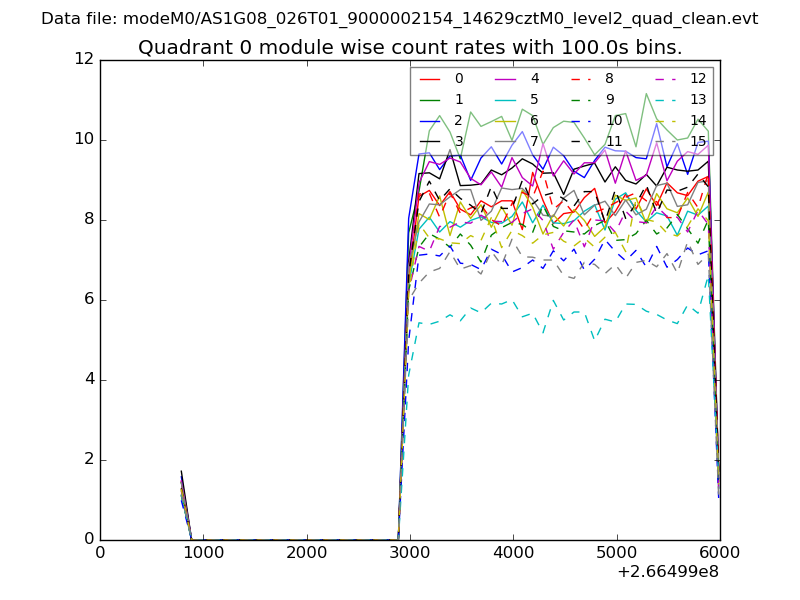 |
 |
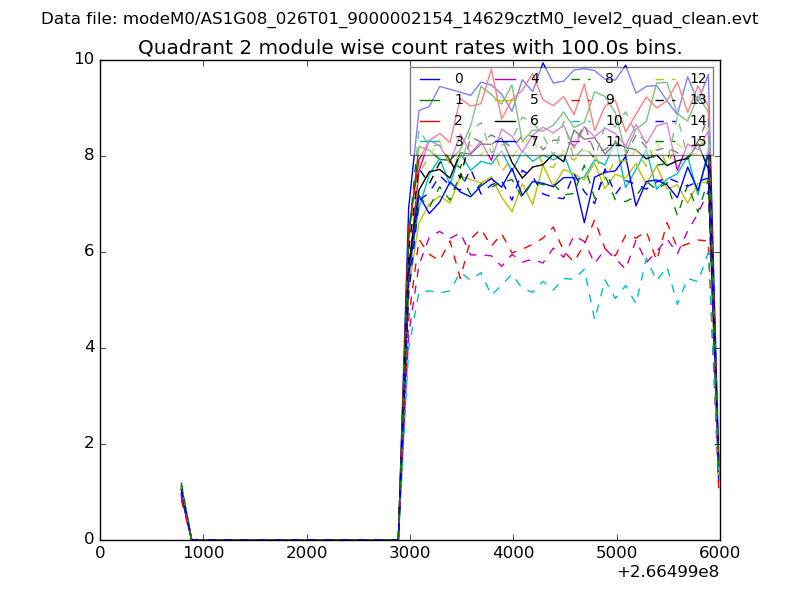
| Module-wise count rates for Quadrant B Data is divided into 100 sec bins |
 |
 |
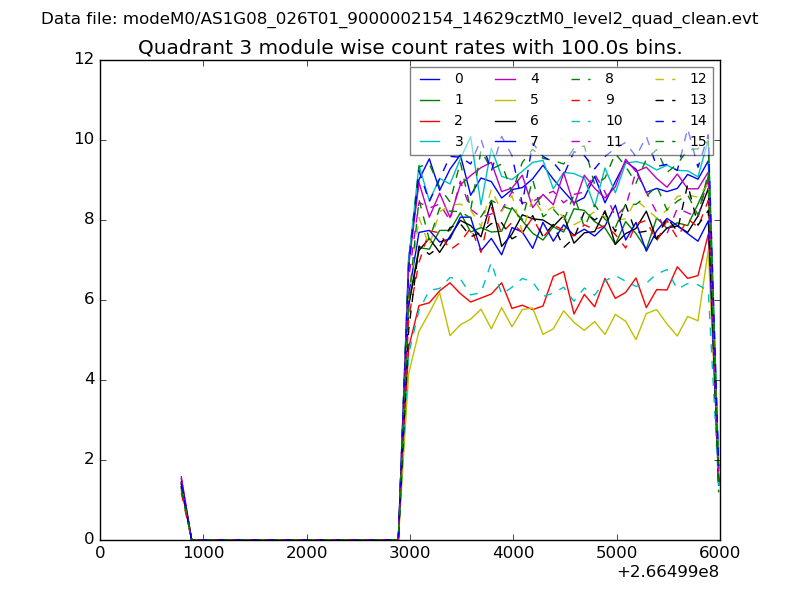
| Module-wise count rates for Quadrant C Data is divided into 100 sec bins |
 |
 |
| Module-wise count rates for Quadrant D Data is divided into 100 sec bins |
 |
 |
| Parameter | Plot |
|---|---|
| CZT HV Monitor | 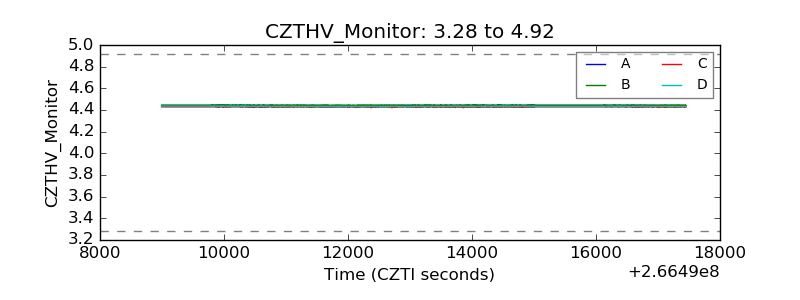 |
| D_VDD | 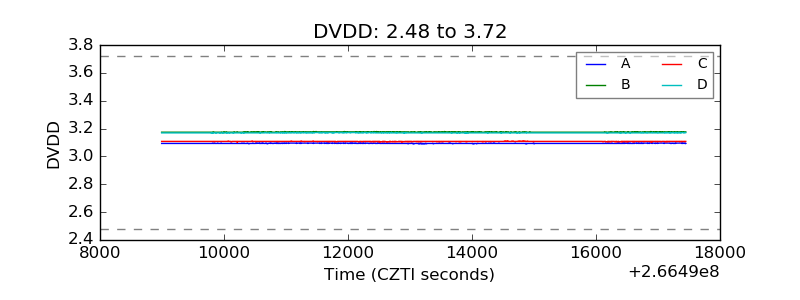 |
| Temperature 1 | 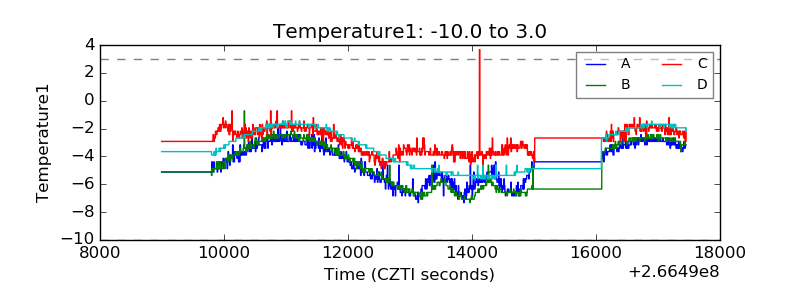 |
| Veto HV Monitor | 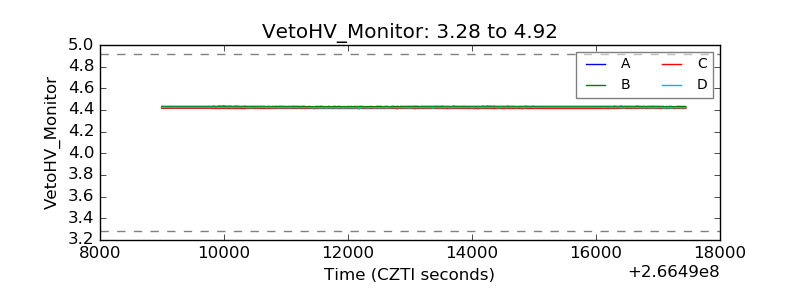 |
| Veto LLD | 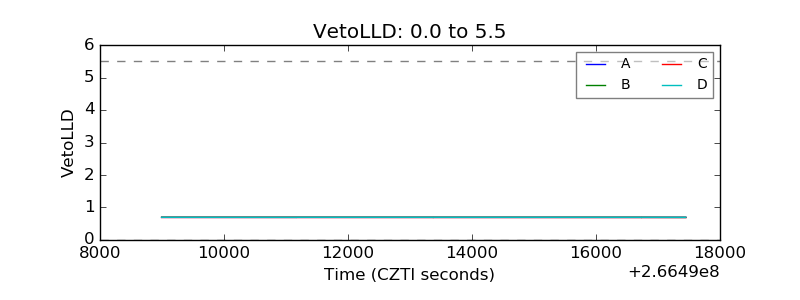 |
| Alpha Counter | 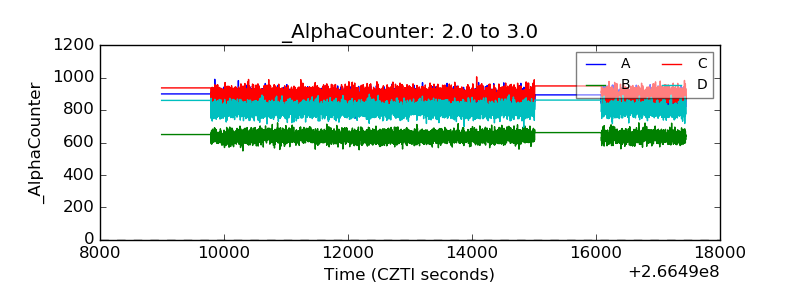 |
| _CPM_Rate | 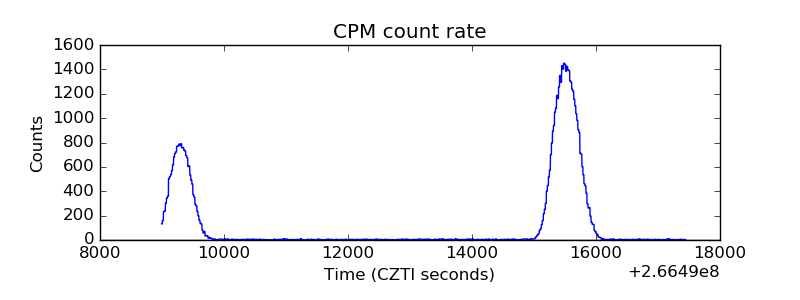 |
| CZT Counter | 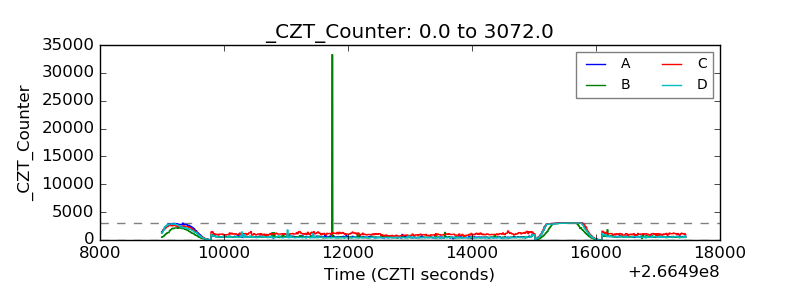 |
| +2.5 Volts monitor |  |
| +5 Volts monitor |  |
| _ROLL_ROT | 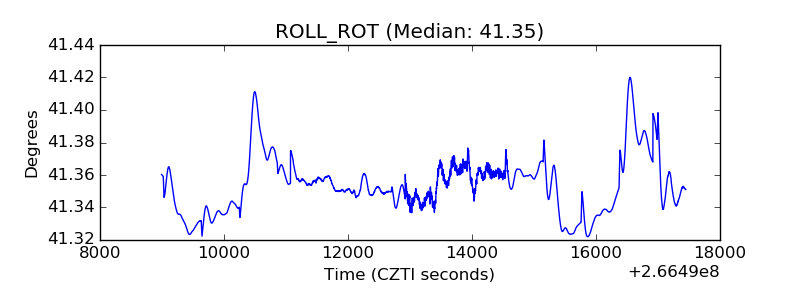 |
| _Roll_DEC | 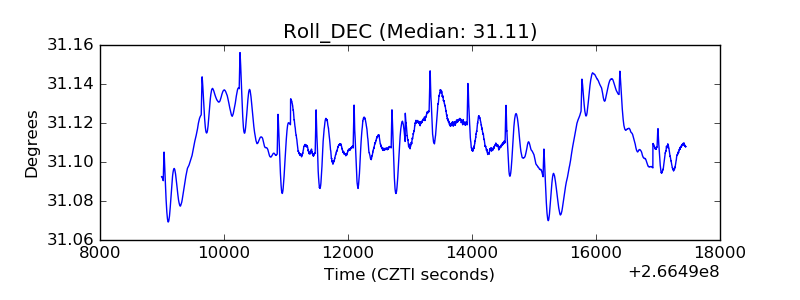 |
| _Roll_RA | 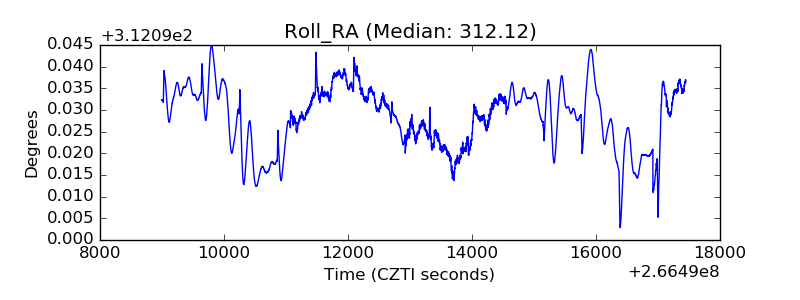 |
| Veto Counter | 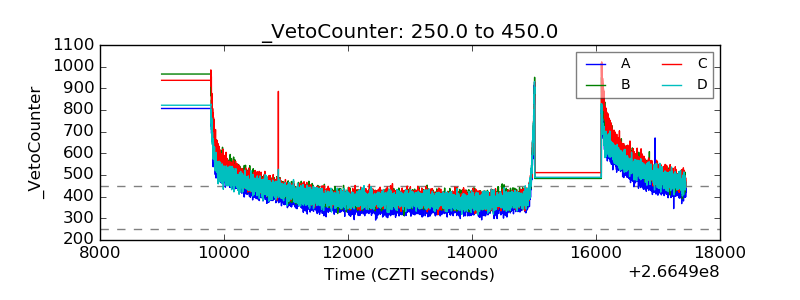 |