| Param | Original file | Final file |
|---|---|---|
| Filename | modeM0/AS1G08_026T01_9000002154_14632cztM0_level2.evt | modeM0/AS1G08_026T01_9000002154_14632cztM0_level2_quad_clean.evt |
| Size (bytes) | 247,083,840 | 29,721,600 |
| Size | 235.6 MB | 28.3 MB |
| Events in quadrant A | 1,511,834 | 182,535 |
| Events in quadrant B | 1,468,038 | 182,554 |
| Events in quadrant C | 2,623,110 | 173,725 |
| Events in quadrant D | 1,702,324 | 174,450 |
| Mode SS | |||
|---|---|---|---|
| Quadrant | BADHDUFLAG | Total packets | Discarded packets |
| A | 0 | 52 | 0 |
| B | 0 | 52 | 0 |
| C | 0 | 52 | 0 |
| D | 0 | 52 | 0 |
| Mode M0 | |||
|---|---|---|---|
| Quadrant | BADHDUFLAG | Total packets | Discarded packets |
| A | 0 | 6264 | 1 |
| B | 0 | 5979 | 1 |
| C | 0 | 9657 | 1 |
| D | 0 | 6985 | 1 |
| Mode M9 | |||
|---|---|---|---|
| Quadrant | BADHDUFLAG | Total packets | Discarded packets |
| A | 0 | 8 | 0 |
| B | 0 | 8 | 0 |
| C | 0 | 8 | 0 |
| D | 0 | 9 | 0 |
| Quadrant | Total seconds | Saturated seconds | Saturation percentage |
|---|---|---|---|
| A | 2597 | 8 | 0.308048% |
| B | 2597 | 20 | 0.770119% |
| C | 2597 | 44 | 1.694263% |
| D | 2597 | 26 | 1.001155% |
Noise dominated data is calculated using 1-second bins in cleaned event files. If a bin has >2000 counts, and if more than 50% of those come from <1% of pixels, then it is considered to be noise-dominated and hence unusable.
| Quadrant | # 1 sec bins | Bins with >0 counts | Bins with >2000 counts | High rate bins dominated by noise | Noise dominated (total time) | Noise dominated (detector-on time) | Marked lightcurve |
|---|---|---|---|---|---|---|---|
| A | 2598 | 2598 | 0 | 0 | 0.00% | 0.00% | 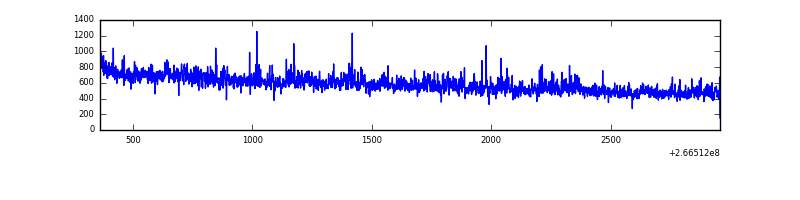 |
| B | 2598 | 2598 | 0 | 0 | 0.00% | 0.00% | 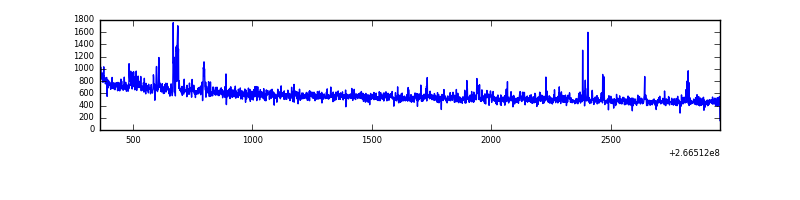 |
| C | 2598 | 2598 | 1 | 1 | 0.04% | 0.04% | 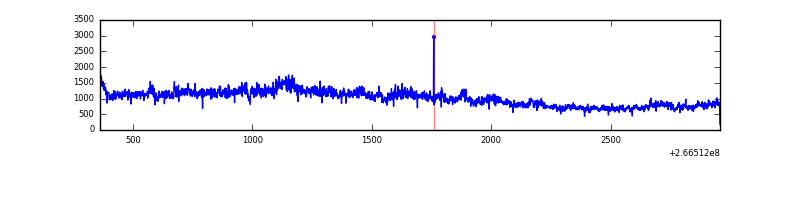 |
| D | 2598 | 2598 | 21 | 21 | 0.81% | 0.81% | 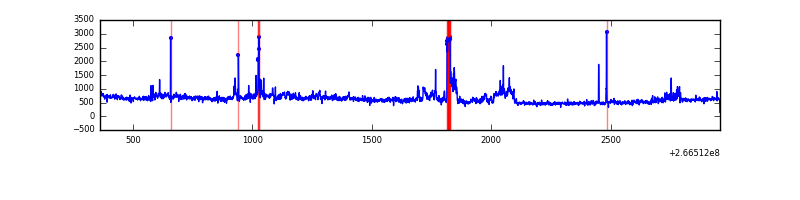 |
Top three noisy pixels from each quadrant. If the there are fewer than three noisy pixels in the level2.evt file, extra rows are filled as -1
| Pixel properties | Quadrant properties | ||||||
|---|---|---|---|---|---|---|---|
| Quadrant | DetID | PixID | Counts | Sigma | Mean | Median | Sigma |
| A | 1 | 162 | 46900 | 633.82 | 362 | 354 | 73.4 |
| A | 1 | 178 | 20611 | 275.84 | 362 | 354 | 73.4 |
| A | 1 | 161 | 18067 | 241.2 | 362 | 354 | 73.4 |
| B | 0 | 189 | 35769 | 519.13 | 359 | 352 | 68.2 |
| B | 4 | 173 | 8526 | 119.81 | 359 | 352 | 68.2 |
| B | 0 | 190 | 7856 | 109.99 | 359 | 352 | 68.2 |
| C | 3 | 233 | 1245597 | 15394.28 | 351 | 354 | 80.9 |
| C | 3 | 234 | 4926 | 56.52 | 351 | 354 | 80.9 |
| C | 14 | 234 | 2595 | 27.7 | 351 | 354 | 80.9 |
| D | 13 | 122 | 295693 | 3515.19 | 354 | 346 | 84.0 |
| D | 10 | 70 | 23603 | 276.8 | 354 | 346 | 84.0 |
| D | 13 | 172 | 20849 | 244.02 | 354 | 346 | 84.0 |
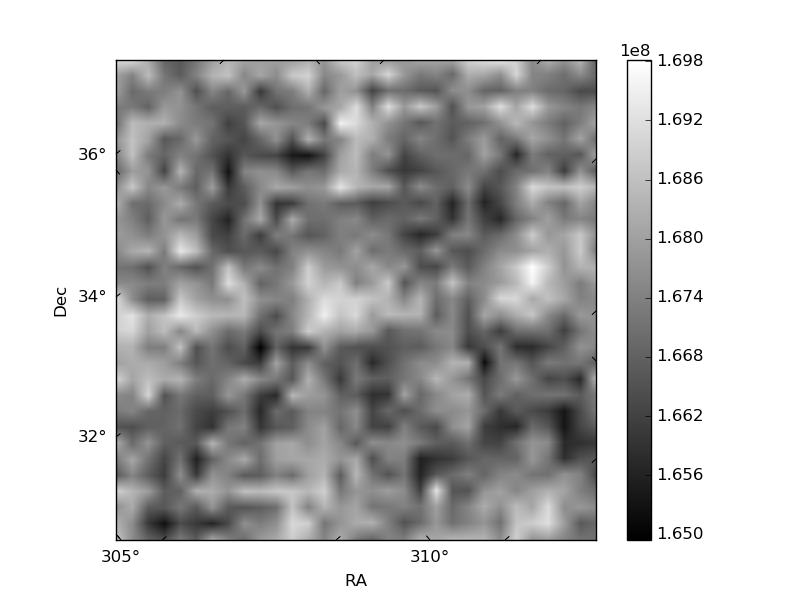
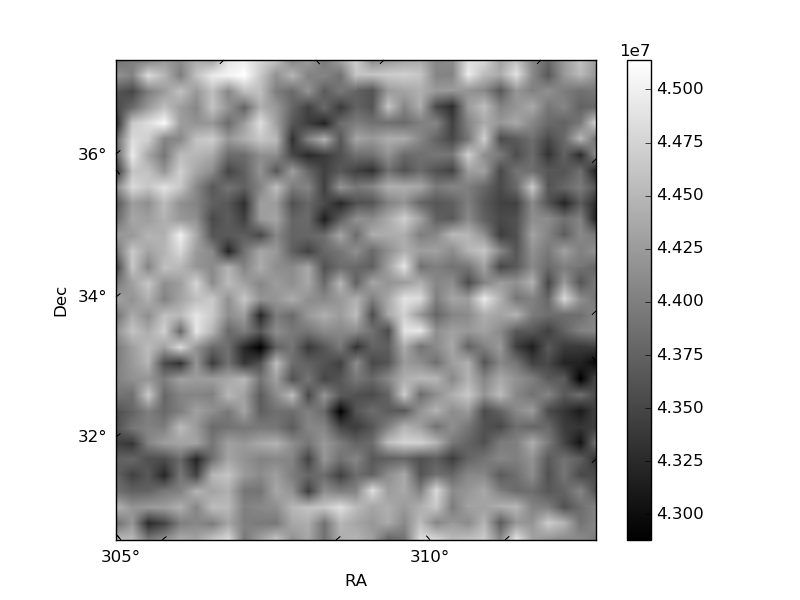
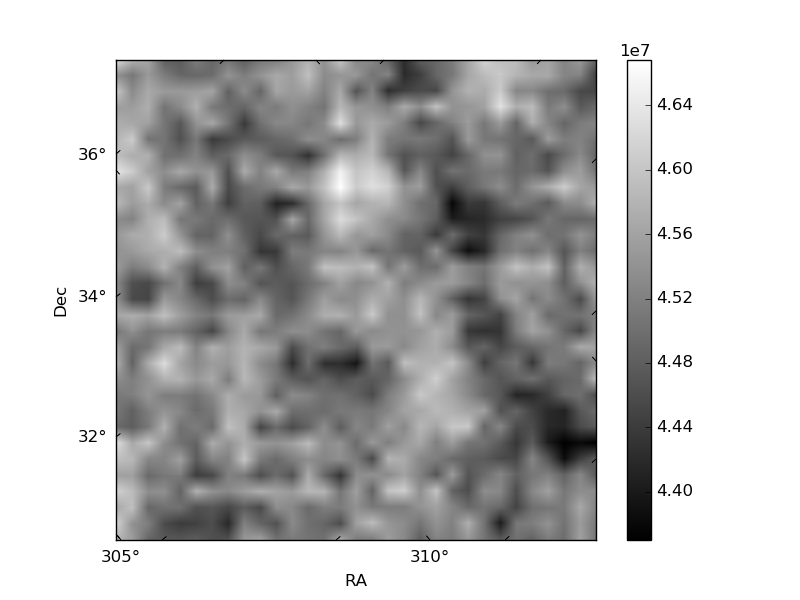
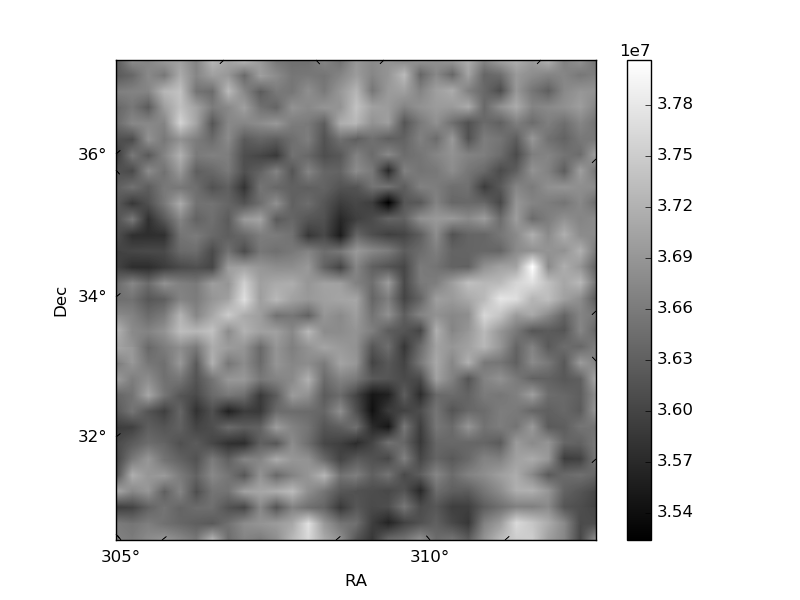
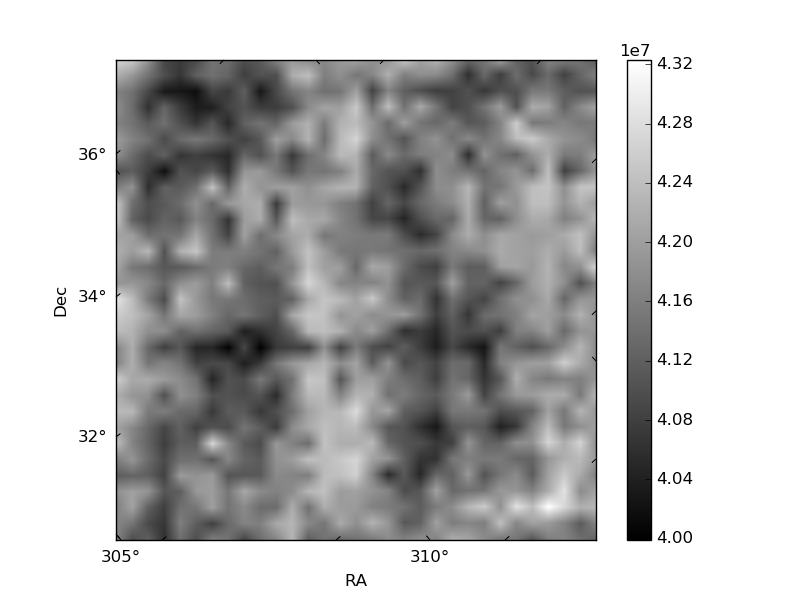
Histogram calculated using DETX and DETY for each event in the final _common_clean file
| Quadrant A | 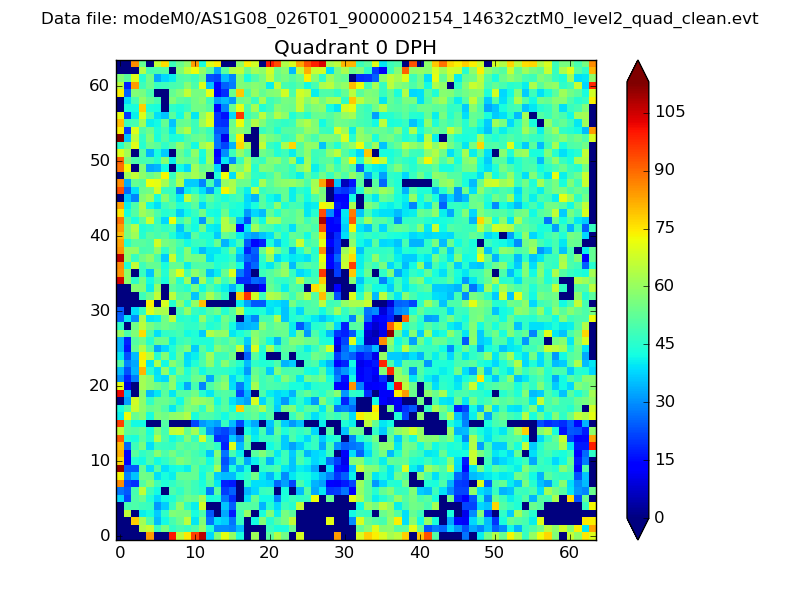 |
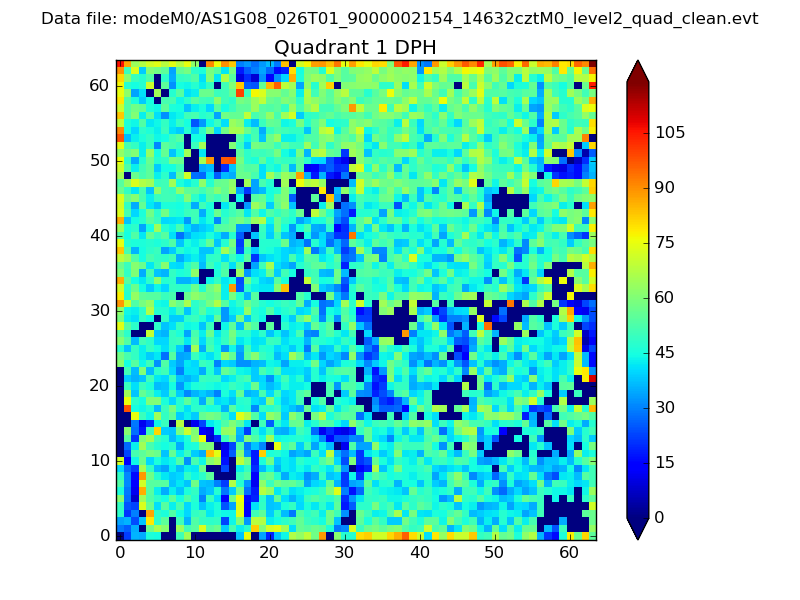 |
Quadrant B |
|---|---|---|---|
| Quadrant D | 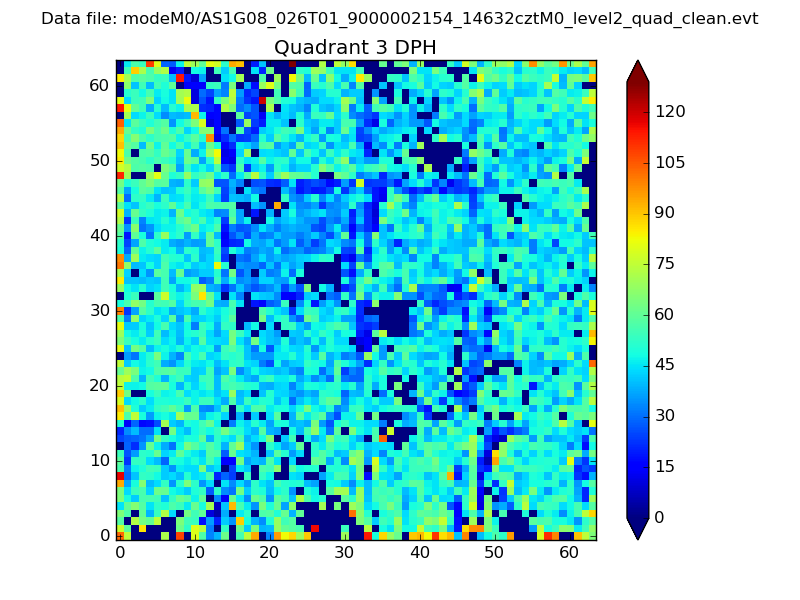 |
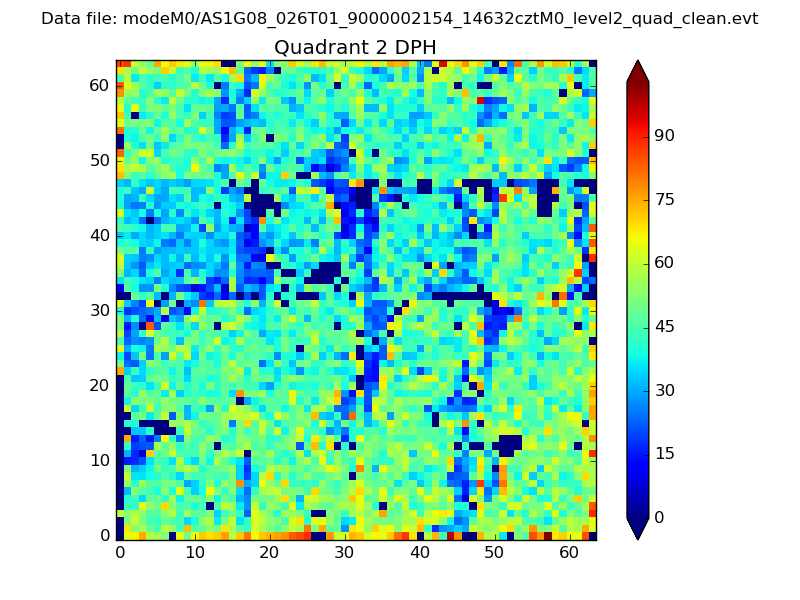 |
Quadrant C |
| Plot type | Count rate plots | Images |
|---|---|---|
| Comparison with Poisson distribution Blue bars denote a histogram of data divided into 1 sec bins. Red curve is a Poisson curve with rate = median count rate of data. |
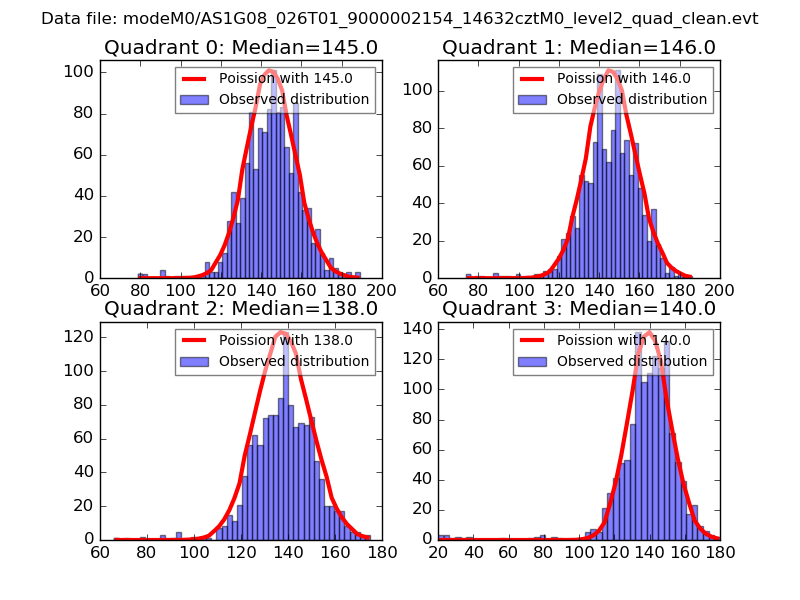 |
 |
| Quadrant-wise count rates Data is divided into 100 sec bins |
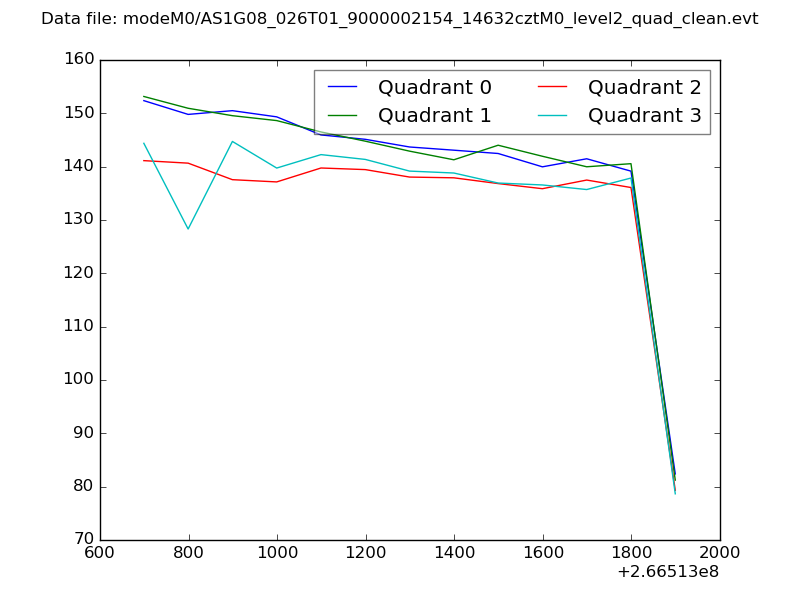 |
|
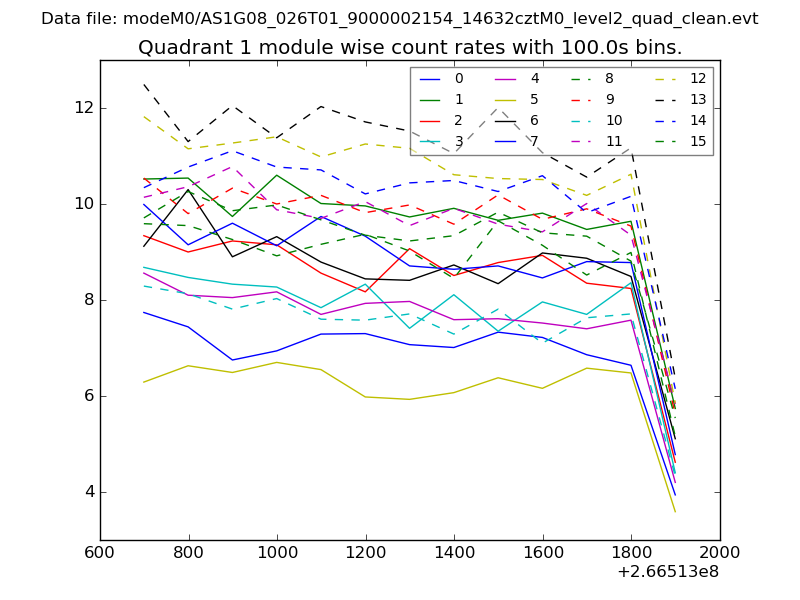
| Module-wise count rates for Quadrant A Data is divided into 100 sec bins |
 |
 |
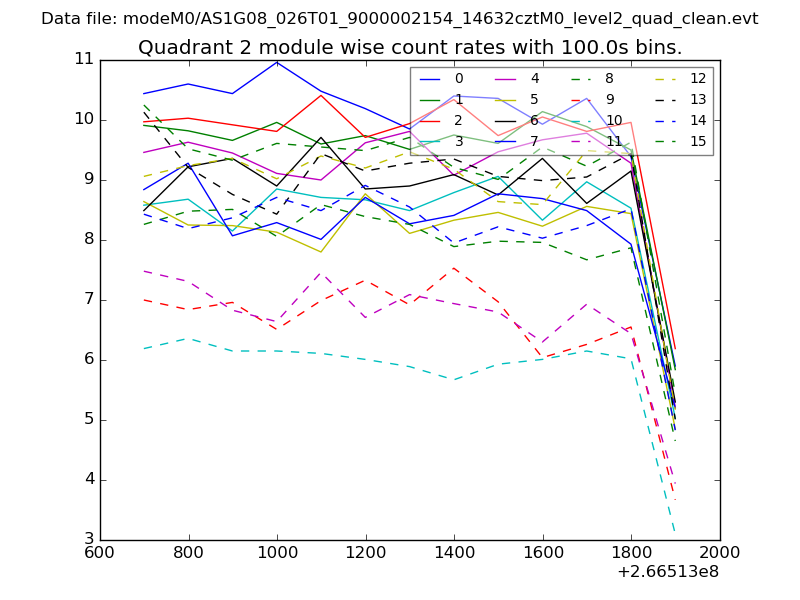
| Module-wise count rates for Quadrant B Data is divided into 100 sec bins |
 |
 |
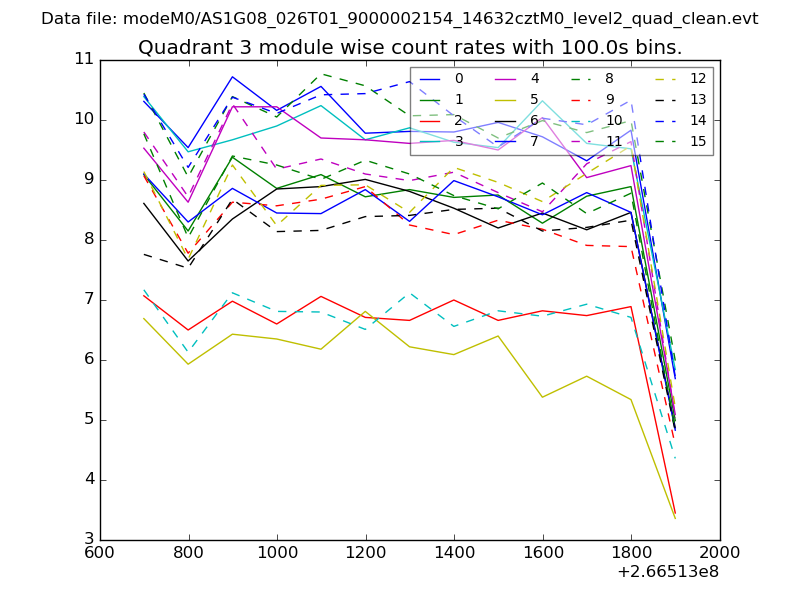
| Module-wise count rates for Quadrant C Data is divided into 100 sec bins |
 |
 |
| Module-wise count rates for Quadrant D Data is divided into 100 sec bins |
 |
 |
| Parameter | Plot |
|---|---|
| CZT HV Monitor | 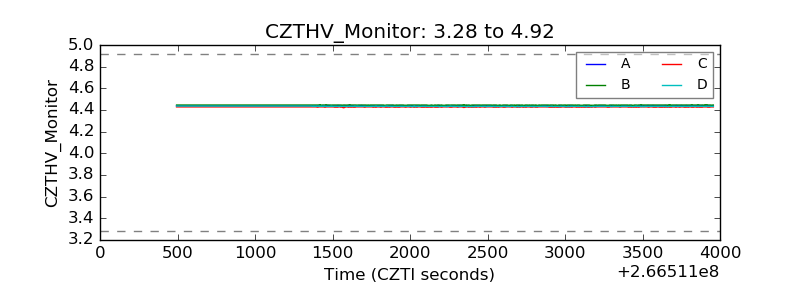 |
| D_VDD | 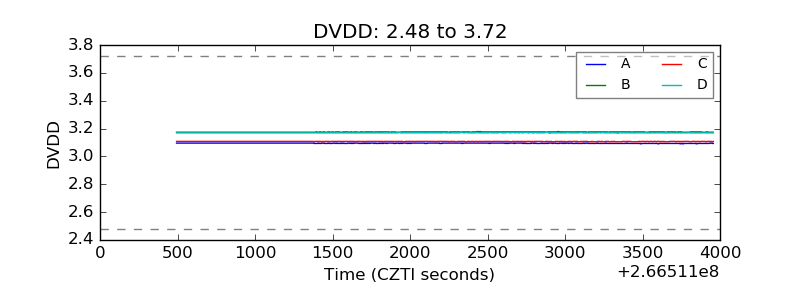 |
| Temperature 1 | 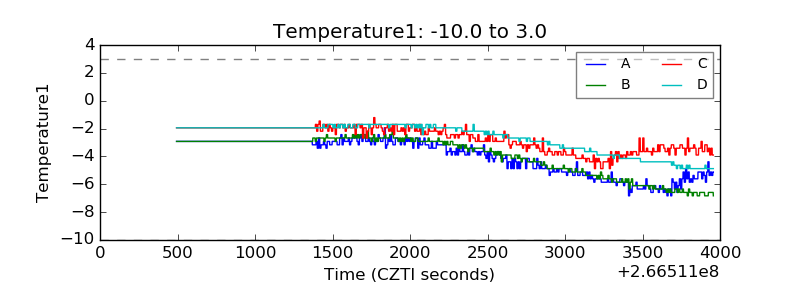 |
| Veto HV Monitor | 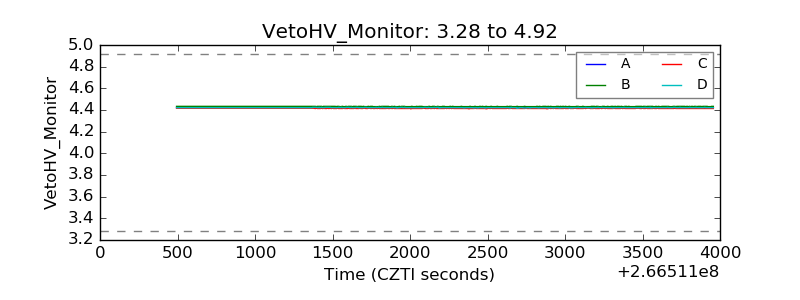 |
| Veto LLD | 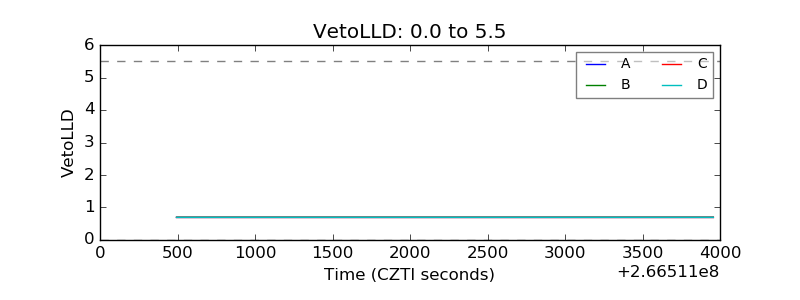 |
| Alpha Counter | 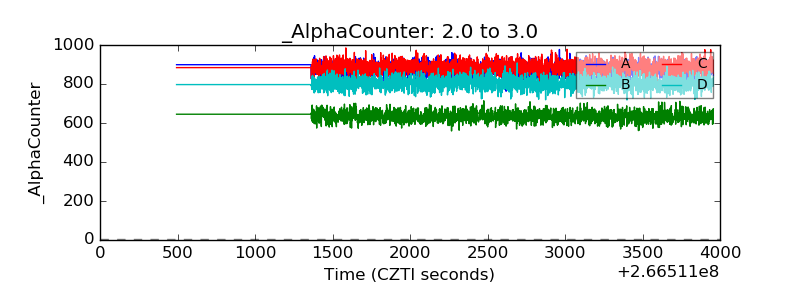 |
| _CPM_Rate | 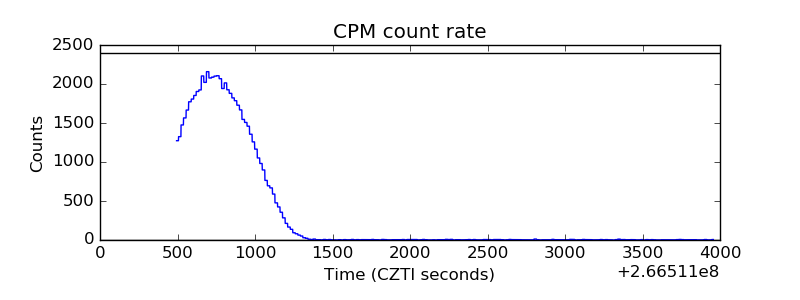 |
| CZT Counter | 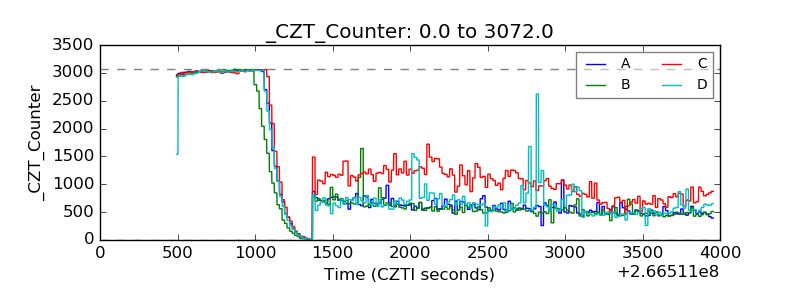 |
| +2.5 Volts monitor |  |
| +5 Volts monitor |  |
| _ROLL_ROT | 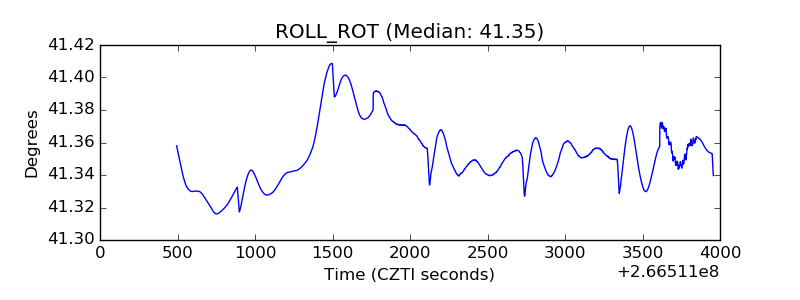 |
| _Roll_DEC | 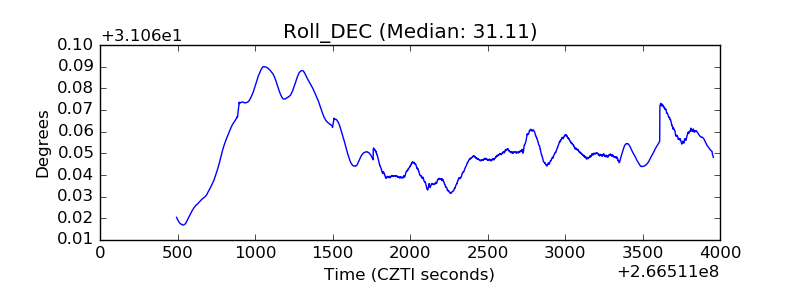 |
| _Roll_RA | 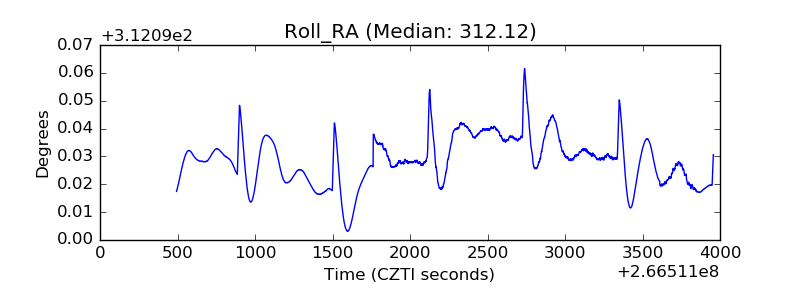 |
| Veto Counter |  |