| Param | Original file | Final file |
|---|---|---|
| Filename | modeM0/AS1A04_043T01_9000002156cztM0_level2.fits | modeM0/AS1A04_043T01_9000002156cztM0_level2_quad_clean.evt |
| Size (bytes) | 432,164,160 | 389,183,040 |
| Size | 412.1 MB | 371.2 MB |
| Events in quadrant A | 2,624,450 | 2,290,536 |
| Events in quadrant B | 2,538,036 | 2,250,014 |
| Events in quadrant C | 2,580,960 | 2,149,021 |
| Events in quadrant D | 2,249,022 | 2,001,061 |
| Mode M9 | |||
|---|---|---|---|
| Quadrant | BADHDUFLAG | Total packets | Discarded packets |
| A | 0 | 72 | 0 |
| B | 0 | 72 | 0 |
| C | 0 | 72 | 0 |
| D | 0 | 72 | 0 |
| Mode M0 | |||
|---|---|---|---|
| Quadrant | BADHDUFLAG | Total packets | Discarded packets |
| A | 0 | 101975 | 0 |
| B | 0 | 102320 | 0 |
| C | 0 | 141449 | 0 |
| D | 0 | 112518 | 0 |
| Mode SS | |||
|---|---|---|---|
| Quadrant | BADHDUFLAG | Total packets | Discarded packets |
| A | 0 | 914 | 0 |
| B | 0 | 914 | 0 |
| C | 0 | 914 | 0 |
| D | 0 | 914 | 0 |
| Quadrant | Total seconds | Saturated seconds | Saturation percentage |
|---|---|---|---|
| A | 45098 | 402 | 0.891392% |
| B | 45098 | 688 | 1.525567% |
| C | 45098 | 616 | 1.365914% |
| D | 45098 | 2186 | 4.847222% |
Noise dominated data is calculated using 1-second bins in cleaned event files. If a bin has >2000 counts, and if more than 50% of those come from <1% of pixels, then it is considered to be noise-dominated and hence unusable.
| Quadrant | # 1 sec bins | Bins with >0 counts | Bins with >2000 counts | High rate bins dominated by noise | Noise dominated (total time) | Noise dominated (detector-on time) | Marked lightcurve |
|---|---|---|---|---|---|---|---|
| A | 52213 | 45096 | 0 | 0 | 0.00% | 0.00% |  |
| B | 52213 | 45095 | 0 | 0 | 0.00% | 0.00% |  |
| C | 52213 | 45096 | 0 | 0 | 0.00% | 0.00% |  |
| D | 52213 | 45092 | 0 | 0 | 0.00% | 0.00% | 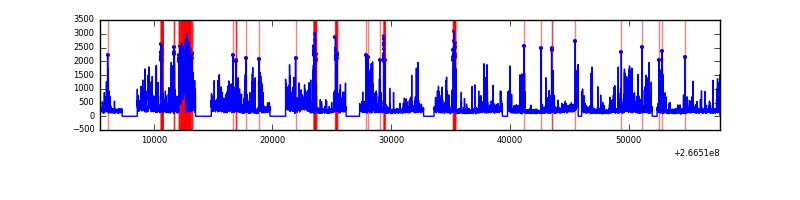 |
Top three noisy pixels from each quadrant. If the there are fewer than three noisy pixels in the level2.evt file, extra rows are filled as -1
| Pixel properties | Quadrant properties | ||||||
|---|---|---|---|---|---|---|---|
| Quadrant | DetID | PixID | Counts | Sigma | Mean | Median | Sigma |
| A | 0 | 29 | 2572 | 11.32 | 683 | 641 | 170.6 |
| A | 7 | 110 | 2187 | 9.06 | 683 | 641 | 170.6 |
| A | 9 | 19 | 2020 | 8.08 | 683 | 641 | 170.6 |
| B | 2 | 9 | 2189 | 11.82 | 670 | 642 | 130.9 |
| B | 3 | 80 | 1708 | 8.14 | 670 | 642 | 130.9 |
| B | 14 | 254 | 1704 | 8.11 | 670 | 642 | 130.9 |
| C | 1 | 80 | 1926 | 7.28 | 681 | 638 | 176.9 |
| C | 1 | 81 | 1916 | 7.22 | 681 | 638 | 176.9 |
| C | 2 | 191 | 1767 | 6.38 | 681 | 638 | 176.9 |
| D | 6 | 231 | 1707 | 6.47 | 642 | 587 | 173.1 |
| D | 10 | 189 | 1634 | 6.05 | 642 | 587 | 173.1 |
| D | 3 | 14 | 1622 | 5.98 | 642 | 587 | 173.1 |
Histogram calculated using DETX and DETY for each event in the final _common_clean file
| Quadrant A | 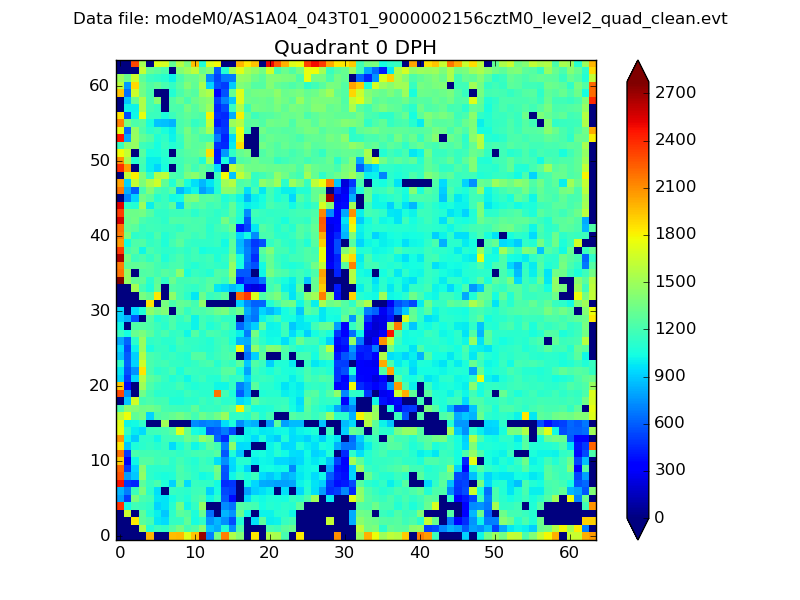 |
 |
Quadrant B |
|---|---|---|---|
| Quadrant D |  |
 |
Quadrant C |
| Plot type | Count rate plots | Images |
|---|---|---|
| Comparison with Poisson distribution Blue bars denote a histogram of data divided into 1 sec bins. Red curve is a Poisson curve with rate = median count rate of data. |
 |
 |
| Quadrant-wise count rates Data is divided into 100 sec bins |
 |
|
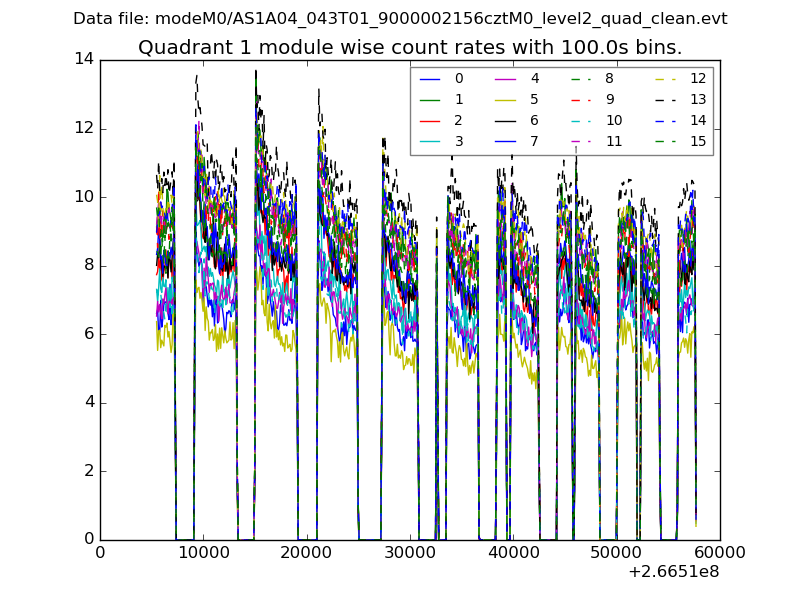
| Module-wise count rates for Quadrant A Data is divided into 100 sec bins |
 |
 |
| Module-wise count rates for Quadrant B Data is divided into 100 sec bins |
 |
 |
| Module-wise count rates for Quadrant C Data is divided into 100 sec bins |
 |
 |
| Module-wise count rates for Quadrant D Data is divided into 100 sec bins |
 |
 |
| Parameter | Plot |
|---|---|
| CZT HV Monitor |  |
| D_VDD | 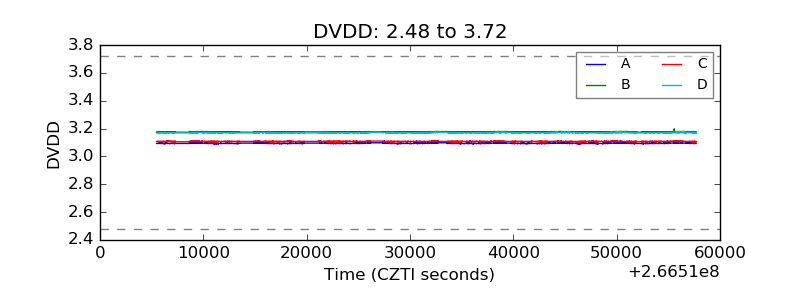 |
| Temperature 1 |  |
| Veto HV Monitor |  |
| Veto LLD |  |
| Alpha Counter | 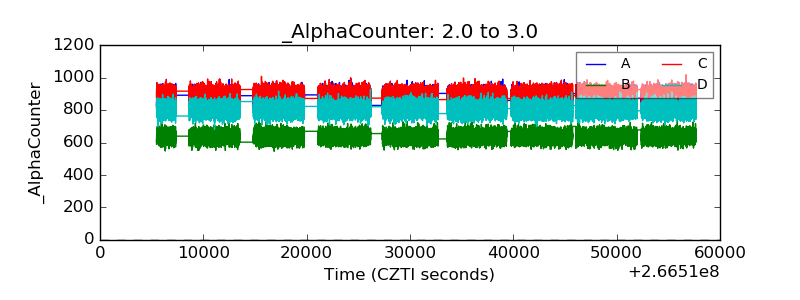 |
| _CPM_Rate | 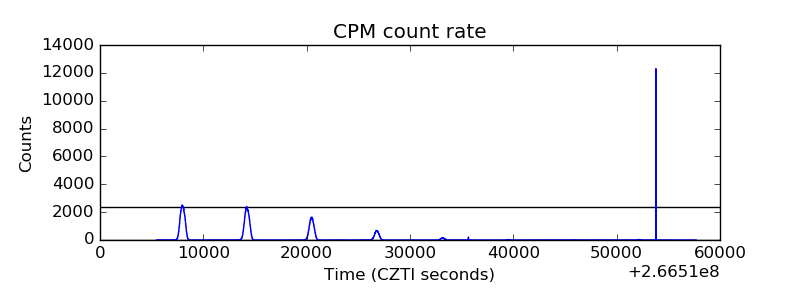 |
| CZT Counter |  |
| +2.5 Volts monitor |  |
| +5 Volts monitor |  |
| _ROLL_ROT |  |
| _Roll_DEC | 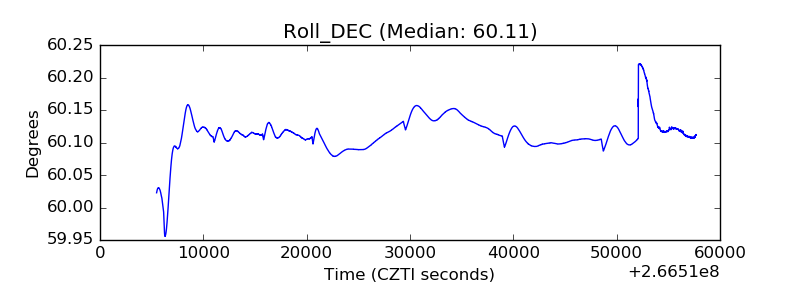 |
| _Roll_RA |  |
| Veto Counter |  |